
Table of Contents
- Introduction
- Introduction to Kubernetes
- Why monitor Kubernetes with Graphite?
- Introduction to Graphite
- Creating the Telegraf Daemonset File Structure
- Deploying the Telegraf Daemonset
- Viewing Metrics with Hosted Graphite
- Plotting the Metrics on Hosted Grafana
- Benefits of Monitoring Kubernetes Cluster with Hosted Graphite and Grafana
- Conclusion
Great systems are not just built. They are monitored.
MetricFire runs Graphite and Grafana as a fully managed service for growing engineering teams, taking care of storage, scaling, and version updates so your team doesn't have to. Plans start at $19/month, billed per metric namespace rather than per host, and include engineer-staffed support. Integrations work natively with Heroku, AWS, Azure, and GCP, and data is stored with 3× redundancy in SOC2- and ISO:27001-certified data centres.
Introduction
In this article, we will be looking into Kubernetes monitoring with Graphite and Grafana. Specifically, we will look at how your whole Kubernetes set-up can be centrally monitored through Hosted Graphite and Hosted Grafana dashboards. This will allow Kubernetes Administrators to centrally manage all of their Kubernetes clusters without setting up any additional infrastructure for monitoring.
To follow the steps in this blog, sign up for the MetricFire free trial, where you can use Graphite and Grafana directly on our platform. MetricFire is a full-scale Hosted Graphite and Grafana service where we set up and manage these open-source tools so you don’t have to.
Introduction to Kubernetes
Kubernetes is the most popular platform for managing containerized applications. Many big and small organizations today use Kubernetes to deploy their production services. However, even though it greatly simplifies the deployment of production services, it also brings its own set of complexities and challenges. Thus, it becomes very important to monitor the components running inside Kubernetes pods, services, and daemons to make sure they are behaving as expected.
For more information on Kubernetes, check out our beginner's guide here. The MetricFire blog also has some great tutorials on Deploying Grafana to Kubernetes, HA Kubernetes monitoring, and more.
Why monitor Kubernetes with Graphite?
Prometheus is the de facto tool for monitoring Kubernetes, with convenient abilities like service discovery and hundreds of pre-built dashboards. However, Prometheus is intended for day-to-day monitoring, and it's a terrible tool for long-term data storage. If you need to keep your data for a long time so that you can view trends and analysis over a year, then you will have to write data out from your local Prometheus instance for remote storage. This can be challenging to maintain and use, not to mention expensive.
That's where Hosted Graphite by MetricFire comes into play. If you want to monitor your Kubernetes installation completely hassle-free without installing a local Prometheus instance, then we recommend using Hosted Graphite with a Snap daemon. This snap_k8s daemon acts like an agent, sending the data to Hosted Graphite from inside your Kubernetes cluster. This solution is very easy—it requires almost no set-up on your side, and we can take care of everything from the MetricFire platform. We will outline this solution in this article.
Now, let's dive into how we can monitor Kubernetes with Hosted Graphite by MetricFire!
Introduction to Graphite
Graphite is one of the most popular open-source enterprise monitoring tools, and it's used by many enterprises worldwide. Graphite provides us with the entire stack, consisting of a database for metrics storage called Whisper, a daemon called Carbon for listening to incoming events, and finally, a graphite web application that allows us to see the metrics in the browser.
In this solution, we will not focus on open-source graphite, which can be troublesome to set up initially, but instead, we'll use Hosted Graphite, which has many advantages.
There are some differences between open-source Graphite and Hosted Graphite, which will not be covered in detail in this article. In short, Hosted Graphite is an enhanced version of Graphite that provides more granular metrics and more transparent scalability than open-source Graphite.
Creating the Telegraf Daemonset File Structure
Daemonset deployments are typically managed through YAML file configurations, with Helm charts being a popular choice for automating the creation of these files—similar to a framework boilerplate. However, if you don’t need the added complexity of Helm charts, Kustomize is a great alternative for managing deployments, as it's already integrated into kubectl. In the following section, we'll walk you through a basic file structure for deploying the Telegraf agent as a daemonset using the Kustomize command line tool. You can either manually create each directory and file on your local machine or clone our public repository from the MetricFire GitHub.
Project Directory:
telegraf-daemonset/
├── kustomization.yaml
└── resources/
    ├── config.yaml
    ├── daemonset.yaml
    ├── namespace.yaml
    ├── role.yaml
    ├── role-binding.yaml
    └── service_account.yaml
kustomization.yaml: This file serves as the orchestrator, tying together all the other YAML files and applying any additional configurations or patches. It ensures that the deployment is consistent and repeatable across environments.
apiVersion: kustomize.config.k8s.io/v1beta1
kind: Kustomization

namespace: monitoring

resources:
  - resources/config.yaml
  - resources/daemonset.yaml
  - resources/namespace.yaml
  - resources/role-binding.yaml
  - resources/role.yaml
  - resources/service_account.yaml
resources/config.yaml: This file holds the configuration data required by your DaemonSet or any other Kubernetes resource. For Telegraf, this typically includes the input/output plugins and their respective configurations. In Kubernetes, it is utilized as a ConfigMap to supply configuration data to your DaemonSet. We'll be configuring the inputs alongside the 'default' performance collection plugins.kubernetes plugin and the outputs.graphite plugin, which will forward data to your Hosted Graphite trial account (be sure to include your HG API key in this file).
apiVersion: v1
kind: ConfigMap
metadata:
  name: telegraf-config
data:
  telegraf.conf: |
    [agent]
      hostname = "$HOSTNAME"
      interval = "10s"
      round_interval = true

    [[inputs.cpu]]
      percpu = false  ## setting to 'false' limits the number of cpu metrics returned

    [[inputs.disk]]
      ignore_fs = ["tmpfs", "devtmpfs", "devfs", "iso9660", "overlay", "aufs", "squashfs"]

    # [[inputs.diskio]]  ## commented out to limit the number of metrics returned

    [[inputs.mem]]

    [[inputs.system]]

    [[outputs.graphite]]
      servers = ["carbon.hostedgraphite.com:2003"]
      prefix = "<YOUR-HG-API-KEY>.telegraf-k8"

    [[inputs.kubernetes]]
      url = "https://$HOSTIP:10250"
      bearer_token = "/var/run/secrets/kubernetes.io/serviceaccount/token"
      insecure_skip_verify = true
resources/daemonset.yaml: This file defines the DaemonSet resource for Kubernetes. A DaemonSet ensures that a copy of a Pod runs on all (or some) nodes in the cluster. It contains specifications for the Pod template, such as the container image, resource limits, and volumes.
apiVersion: apps/v1
kind: DaemonSet
metadata:
  name: telegraf
spec:
  selector:
    matchLabels:
      name: telegraf
  template:
    metadata:
      labels:
        name: telegraf
    spec:
      serviceAccountName: telegraf-sa
      containers:
      - name: telegraf
        image: telegraf:latest
        resources:
          limits:
            memory: 200Mi
            cpu: 200m
          requests:
            memory: 100Mi
            cpu: 100m
        volumeMounts:
        - name: config
          mountPath: /etc/telegraf/telegraf.conf
          subPath: telegraf.conf
        - name: docker-socket
          mountPath: /var/run/docker.sock
        - name: varlibdockercontainers
          mountPath: /var/lib/docker/containers
          readOnly: true
        - name: hostfsro
          mountPath: /hostfs
          readOnly: true
        env:
        # This pulls HOSTNAME from the node, not the pod.
        - name: HOSTNAME
          valueFrom:
            fieldRef:
              fieldPath: spec.nodeName
        # In test clusters where hostnames are resolved in /etc/hosts on each node,
        # the HOSTNAME is not resolvable from inside containers
        # So inject the host IP as well
        - name: HOSTIP
          valueFrom:
            fieldRef:
              fieldPath: status.hostIP
        # Mount the host filesystem and set the appropriate env variables.
        # ref: https://github.com/influxdata/telegraf/blob/master/docs/FAQ.md
        # HOST_PROC is required by the cpu, disk, mem, input plugins
        - name: "HOST_PROC"
          value: "/hostfs/proc"
        # HOST_SYS is required by the diskio plugin
        - name: "HOST_SYS"
          value: "/hostfs/sys"
        - name: "HOST_MOUNT_PREFIX"
          value: "/hostfs"
      volumes:
      - name: hostfsro
        hostPath:
          path: /
      - name: config
        configMap:
          name: telegraf-config
      - name: docker-socket
        hostPath:
          path: /var/run/docker.sock
      - name: varlibdockercontainers
        hostPath:
          path: /var/lib/docker/containers
resources/namespace.yaml: Namespaces are used to separate resources in a cluster logically. This file ensures that all the resources for your DaemonSet are deployed in the specified namespace.
apiVersion: v1
kind: Namespace
metadata:
  name: monitoring
resources/role.yaml: Roles are used to grant access to resources within a namespace. This file specifies what actions can be taken on which resources by the service account used by your DaemonSet.
kind: ClusterRole
apiVersion: rbac.authorization.k8s.io/v1
metadata:
  name: telegraf-cluster-role
rules:
  - apiGroups: ["metrics.k8s.io"]
    resources: ["pods"]
    verbs: ["get", "list", "watch"]
  - apiGroups: [""]
    resources: ["nodes", "nodes/proxy", "nodes/stats", "persistentvolumes"]
    verbs: ["get", "list", "watch"]
resources/role-binding.yaml: This file binds a Role to a user, group, or service account. It allows you to specify who can perform actions on the resources defined in the Role within the specified namespace.
apiVersion: rbac.authorization.k8s.io/v1
kind: ClusterRoleBinding
metadata:
  name: telegraf-sa-binding
subjects:
  - kind: ServiceAccount
    name: telegraf-sa
roleRef:
  apiGroup: rbac.authorization.k8s.io
  kind: ClusterRole
  name: telegraf-cluster-role
resources/service_account.yaml: Service accounts provide an identity for processes that run in a Pod. They are used to authenticate with the Kubernetes API server and are associated with Pods that must interact with the cluster's resources.
apiVersion: v1
kind: ServiceAccount
metadata:
  name: telegraf-sa
Deploying the Telegraf Daemonset
By now, your project directory should contain the `kustomization.yaml` file along with the `resources` directory, which houses the other 6 YAML files.
With the correct cluster context already in use, you can perform a dry run to test and then deploy the `kustomization.yaml` file directly from your root project directory:
- kubectl apply -k . --dry-run=client
- kubectl apply -k .
Expected output:
namespace/monitoring created
serviceaccount/telegraf-sa created
clusterrole.rbac.authorization.k8s.io/telegraf-cluster-role created
clusterrolebinding.rbac.authorization.k8s.io/telegraf-sa-binding created
configmap/telegraf-config created
daemonset.apps/telegraf created
You can now retrieve a list of running DaemonSets in your cluster and verify that one with the name "telegraf" exists within the "monitoring" namespace:
- kubectl get daemonsets --all-namespaces
Telegraf will now begin collecting and forwarding node, pod container, volume, and network activity metrics to your Hosted Graphite trial account. These metrics, sent in the Graphite format, can be utilized in HG to build custom dashboards and set up alerts. For more details and additional configuration options for the `inputs.kubernetes` plugin, refer to the official GitHub repository.
Viewing Metrics with Hosted Graphite
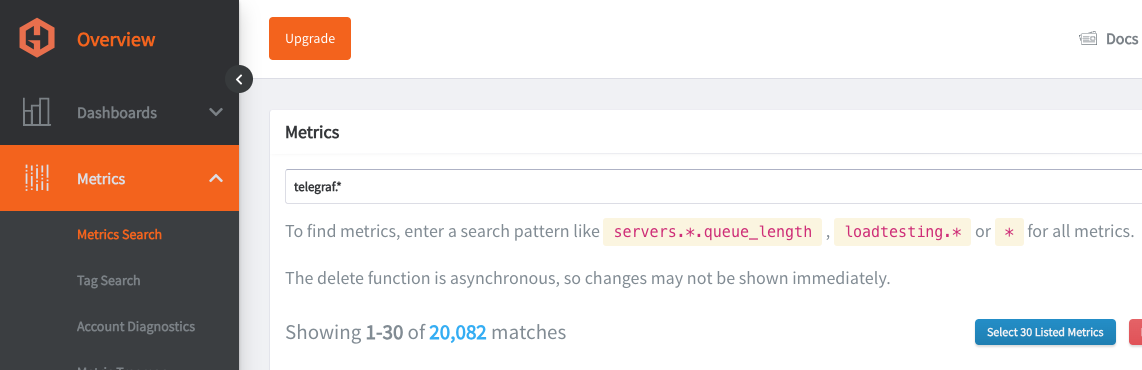
Go to your Hosted Graphite trial account and head to the Metrics Search section. To view a complete list of your Graphite metrics, use "Telegraf" as your search parameter, as all your metrics will be prefixed with it
Plotting the Metrics on Hosted Grafana
Now, for the most exciting part, we will plot these raw metrics data into visualizations that users can understand. We will use Grafana, an open-source web application for interactive data visualization using charts, graphs, and various other data visualization tools. It also provides capabilities to connect to multiple data sources, such as Graphite, Elasticsearch, and MySQL, along with alerting capabilities.
First, let’s log in to Hosted Graphite at https://www.hostedgraphite.com/app and browse to Dashboards -> Grafana to open the Hosted Grafana application page.
Since Hosted Grafana is part of MetricFire’s offering, the data source connection between Grafana and Graphite is automatically made for us.
Grafana comes with many pre-built dashboards as part of its Grafana dashboards library, and MetricFire's support team is happy to install more wherever needed, or use the Hosted Graphite Dashboard Library, and generate a pre-made Kubernetes Overview dashboard that will be compatible with you telegraf-k8 metrics.
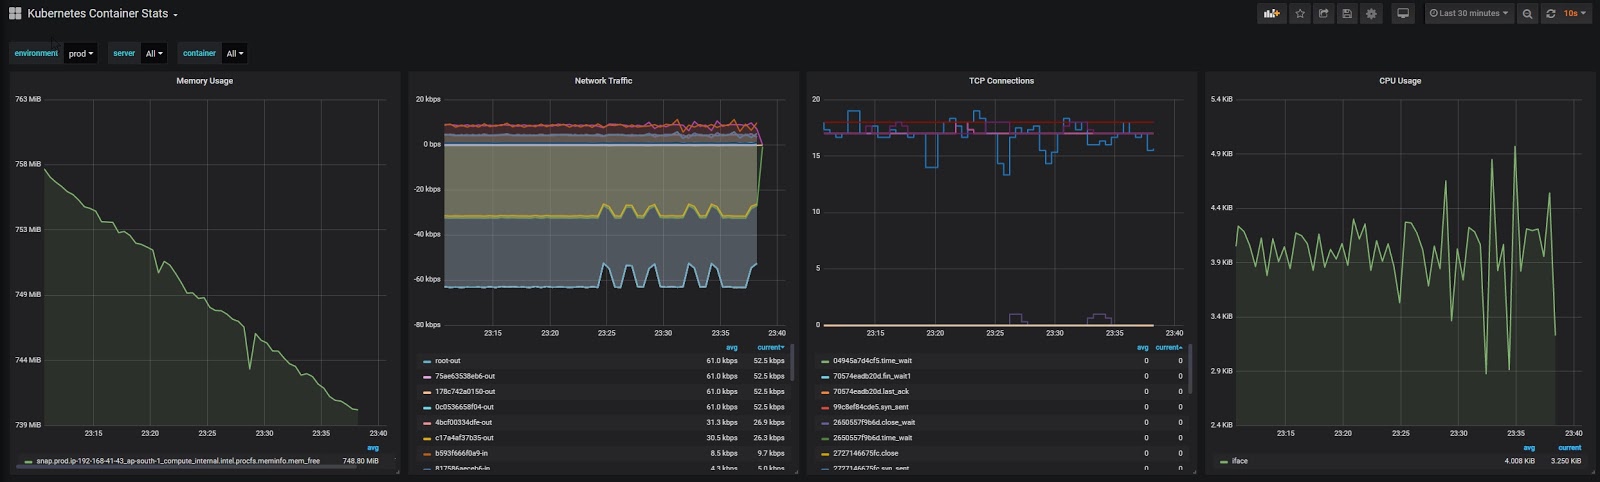
We can also download ready-made dashboards built for Kubernetes instead of creating one ourselves from scratch. We will download a pre-built dashboard from the Grafana dashboard library for our use case.
On the Kubernetes Container Stats page, click the link “Download JSON” and import it into the Hosted Grafana portal. Make sure to choose the Graphite data source appropriately.
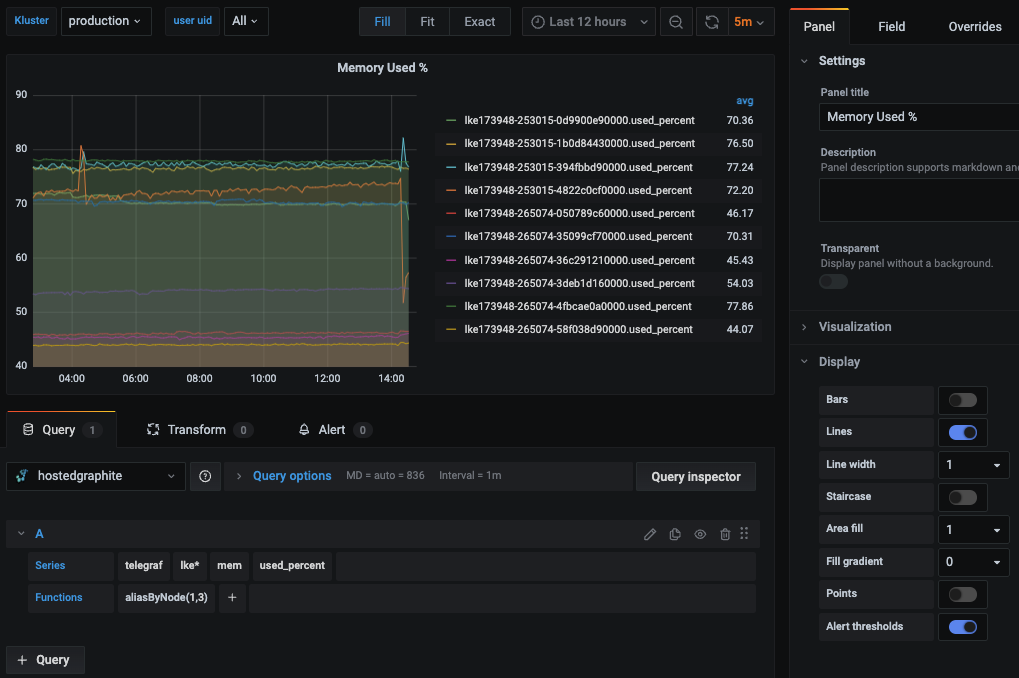
You can alos navigate to Dashboards => Primary Dashboards, select the + button to create a new panel and use the query UI in Edit mode to select a graphite metric path (in HG, the default data source will be the Hosted Graphite backend). See the HG dashboard docs for more details on creating dashboards and using more advanced features like variables, annotations, and Graphite functions:
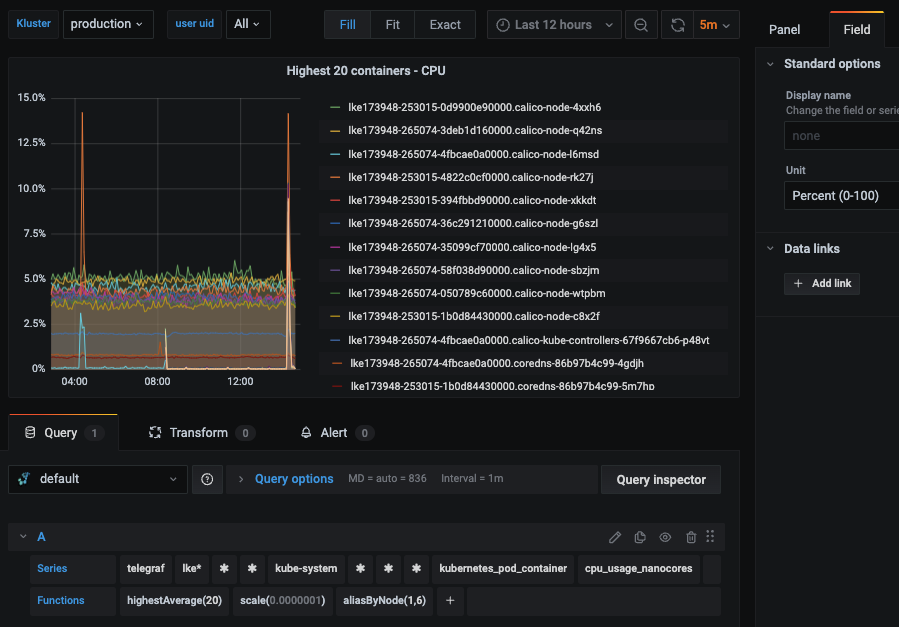
Hosted Grafana is a powerful visualization tool built on top of the open-source Grafana. It allows you to create your own visualizations and set up alerts whenever a metric value crosses a certain threshold.
Check out our article, Grafana Dashboards from Basic to Advanced, to learn how to set up Grafana alerts and build custom dashboards.
You can also create other types of visualizations based on the metrics exposed by Kubernetes. Look at the article Our Favorite Grafana Dashboards to make some of the more advanced dashboards.
Benefits of Monitoring Kubernetes Cluster with Hosted Graphite and Grafana
As we saw above, setting up a Snap daemon inside our Kubernetes cluster takes only a few minutes to get the Kubernetes monitoring up and running with Hosted Graphite and Hosted Grafana.
There are various advantages of using this solution over a custom monitoring solution:
- The data is securely transmitted and stored in Hosted Graphite, and every metric is securely stamped with a private API key.
- Hosted Grafana has an integration with Hosted Graphite under the hood. Thus, as soon as the Kubernetes cluster starts sending its metrics to Hosted Graphite, not much additional work needs to be done, as those metrics can be instantaneously visualized in Hosted Graphite due to the integration, which is already set up.
- Unless you know Graphite in and out, there are many hiccups to overcome in order to set up and maintain a scalable graphite infrastructure. Check out Klaviyo's struggle here. Whenever possible, it's best to leave this job to the experts.
Conclusion
This article looked at how Hosted Graphite and Hosted Grafana can help us monitor Kubernetes clusters without much setup using the Telegraf agent K8s Daemonset.
Sign up here for a free trial of our Hosted Graphite and Grafana. If you have any questions about our products or about how MetricFire can help your company, book a demo and talk to us directly.