
Table of Contents
Great systems are not just built. They are monitored.
MetricFire runs Graphite and Grafana as a fully managed service for growing engineering teams, taking care of storage, scaling, and version updates so your team doesn't have to. Plans start at $19/month, billed per metric namespace rather than per host, and include engineer-staffed support. Integrations work natively with Heroku, AWS, Azure, and GCP, and data is stored with 3× redundancy in SOC2- and ISO:27001-certified data centres.
Introduction
Grafana is an open-source platform for metric analytics, monitoring, and visualization. In this article, we will explore the basics of Grafana and learn how to deploy it to Kubernetes. You will find specific coding examples and screenshots you can follow to deploy Grafana.
Key Takeaways
- Grafana is an open-source platform for metric analytics, monitoring, and visualization.
- Grafana supports multiple data sources, including Prometheus, MySQL, MSSQL, PostgreSQL, InfluxDB, Graphite, and Elasticsearch, and can integrate with cloud-managed services like Google Stackdriver, Azure Monitor, and AWS CloudWatch.
- Grafana can be deployed to Kubernetes using the official Grafana Docker image, and the service can be exposed to the external network using a LoadBalancer service type.
- Testing Grafana involves adding a data source and creating dashboards with visualizations. The default login/password is admin/admin.
- Plugins can extend Grafana's functionality, and the article mentions installing the Grafana Kubernetes App.
- To ensure data persistence in Grafana deployments, the article provides instructions for creating a persistent volume and claim.
The Basics of Grafana
Before diving into our code, you should know what Grafana can do for you. Grafana pulls metrics from different data sources. Each source has a specific syntax and query editor for extracting and interpreting data.
Grafana supports multiple data sources, such as Prometheus, MySQL, MSSQL, PostgreSQL, Influx DB, Graphite, and ElasticSearch. It can also load data from some cloud-managed services, such as Google Stackdriver, Azure Monitor, and AWS CloudWatch. You can extend Grafana and add other data stores and online sources with the right plugin. Time series data for infrastructure and applications (such as disk I/O utilization, CPU, and memory) is first loaded into the analysis tool and then analyzed.
While Grafana supports various monitoring tools, we highly recommend utilizing Hosted Graphite. In addition to monitoring your Kubernetes resources, it works perfectly with the Grafana-as-a-Service offering at MetricFire. We've made integrating Hosted Graphite with Hosted Grafana a simple task, and the tool comes with a few built-in advantages of its own:
- You can push metrics to Graphite regardless of the source's programming language.
- Beautiful and in-depth visualizations are easy to create.
- Extended libraries allow for scrapping and alerts.
- MetricFire's Hosted Graphite has triple-redundant storage to ensure data protection.
- Resources from Graphite are easy to control and automate with MetricFire's APIs.
- You can use data tags with Hosted Graphite to simplify the viewing and organization of data.
Furthermore, Grafana allows you to easily create and edit dashboards. If you're not interested in installing your own Grafana, you can use Grafana through MetricFire's free trial.
Creating the Kubernetes Cluster
To better understand how Grafana works, we will use it to monitor a Kubernetes cluster. You can use any managed cloud cluster or even Minikube. This showcases one of Grafana's major benefits: interoperability. Whether it's your cloud cluster or monitoring tools, this tool can integrate with many options.
In this tutorial, we will use GKE (Google Kubernetes Engine), Google Cloud's managed Kubernetes service. If you are using GKE, your Google Cloud project should be linked to a billing account. You should also enable the Kubernetes API and install the Google Cloud SDK.
If you are going to use another cloud provider, you can follow almost the same steps shown here, except for some commands specific to Google Cloud Platform (GCP).
Once installations and configurations are done, you can proceed by using:
gcloud container clusters create mycluster --zone europe-west1-b
Change "mycluster" for a cluster name of your choice and use your preferred zone.
NAME      LOCATION        MASTER_VERSION   MASTER_IP     MACHINE_TYPE   NODE_VERSION   NUM_NODES  STATUS
mycluster europe-west1-b   1.13.11-gke.9   34.77.193.73  n1-standard-1  1.13.11-gke.9  3          RUNNING
Alternatively, if you use a Minikube cluster, you should install it by following the official instructions. Then, create a cluster using:
minikube start
Now that the cluster is running, we must install the Kubernetes command-line tool, kubectl. The installation is quite simple. If you are using Debian/Ubuntu, you need to run these commands:
sudo apt-get update && sudo apt-get install -y apt-transport-https

curl -s https://packages.cloud.google.com/apt/doc/apt-key.gpg | sudo apt-key add -

echo "deb https://apt.kubernetes.io/ kubernetes-xenial main" | sudo tee -a /etc/apt/sources.list.d/kubernetes.list

sudo apt-get update

sudo apt-get install -y kubectl
Create a Grafana Service
We will use the official Grafana image (v5.4.3) from Docker Hub to create a deployment.
kubectl create deployment grafana --image=docker.io/grafana/grafana:5.4.3
You can check if the image was deployed by using:
kubectl get deployments
You should see an output similar to the following:
NAME READY UP-TO-DATE AVAILABLE AGE
grafana 1/1 1 1 66s
To access the Grafana dashboard, its service should be reachable from outside the cluster. However, after creating the deployment, Grafana is only accessible from inside the cluster because it uses a ClusterIP.
You can verify this using:
kubectl get svc
You will see an output to:
NAME TYPE CLUSTER-IP EXTERNAL-IP PORT(S) AGE
kubernetes ClusterIP 10.27.240.1 <none> 443/TCP 100m
Next, we are going to expose the Grafana service using the LoadBalancer service type:
kubectl expose deployment grafana --type=LoadBalancer --port=80 --target-port=3000 --protocol=TCP
3000 is the default HTTP port that Grafana listens to if you haven't set up a custom configuration. For simplicity's sake, we will map this internal port to the external port 80 using TCP. The load balancer creation may take a few minutes. To verify that the deployment was exposed, type the following:
kubectl get service grafana
You should be able to see the external IP of the load balancer:
NAME TYPE CLUSTER-IP EXTERNAL-IP PORT(S) AGE
grafana LoadBalancer 10.27.252.155 35.205.13.61 80:32471/TCP 92s
You can also execute other operations on the deployed service, like scaling:
kubectl scale deployment grafana --replicas=2
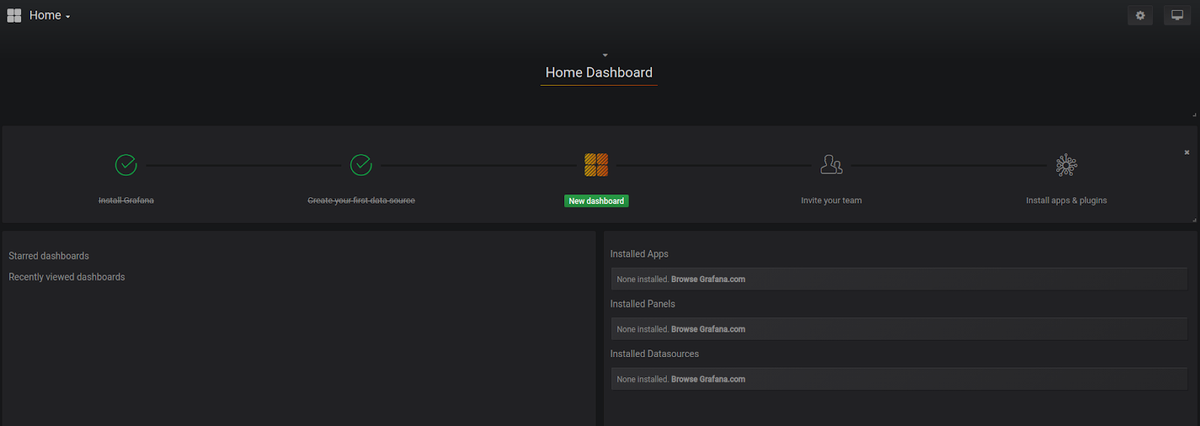
Now, if you visit the same IP on the default port (80), you will see Grafana’s authentication page.
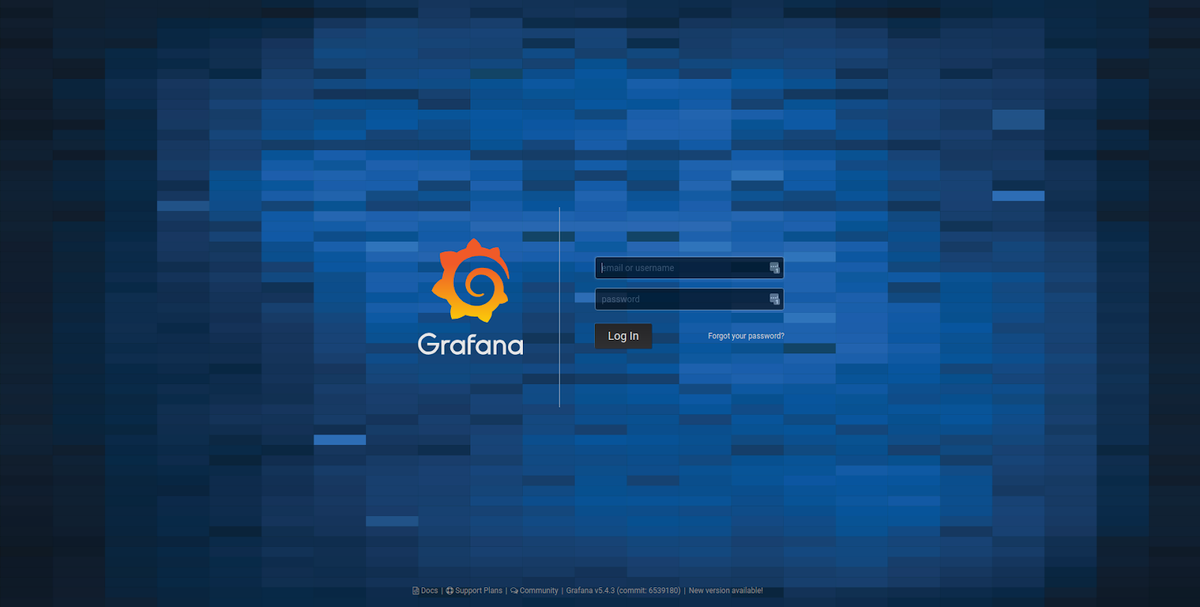
Testing Grafana
The default login/password is admin/admin. You will be asked to change these credentials after your first login. You can also log in to the free trial on MetricFire and start directly from this point without having to do any setup.
If you've chosen to use Graphite, you'll also find it easier to visualize and monitor time-series data, even if your hardware has low specifications.
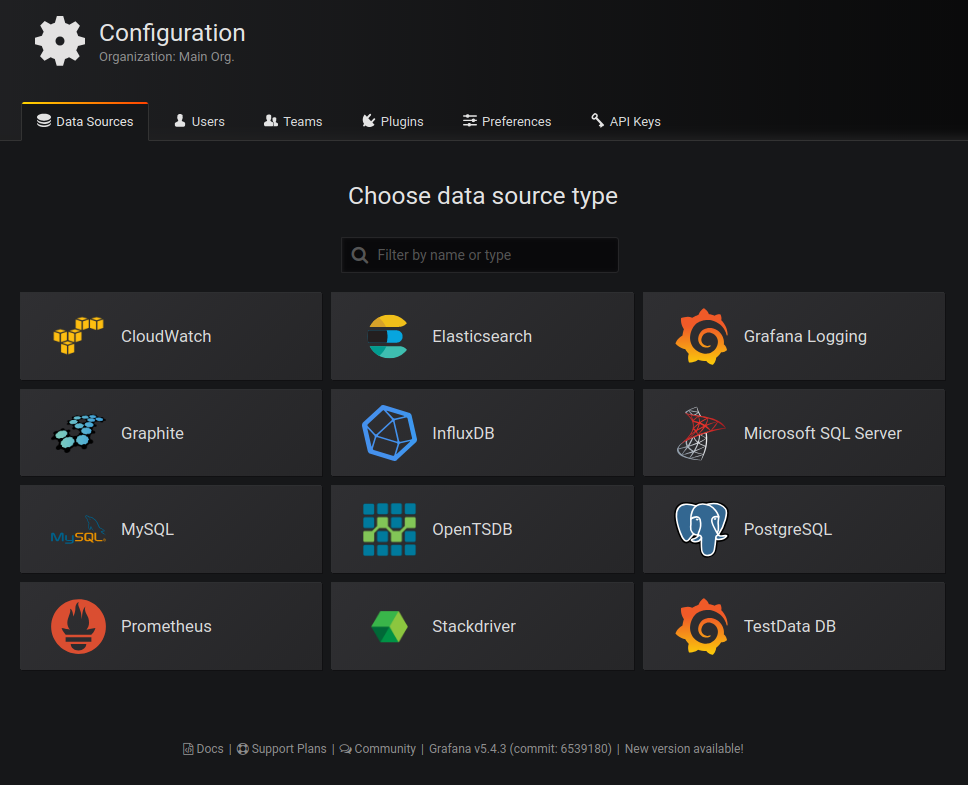
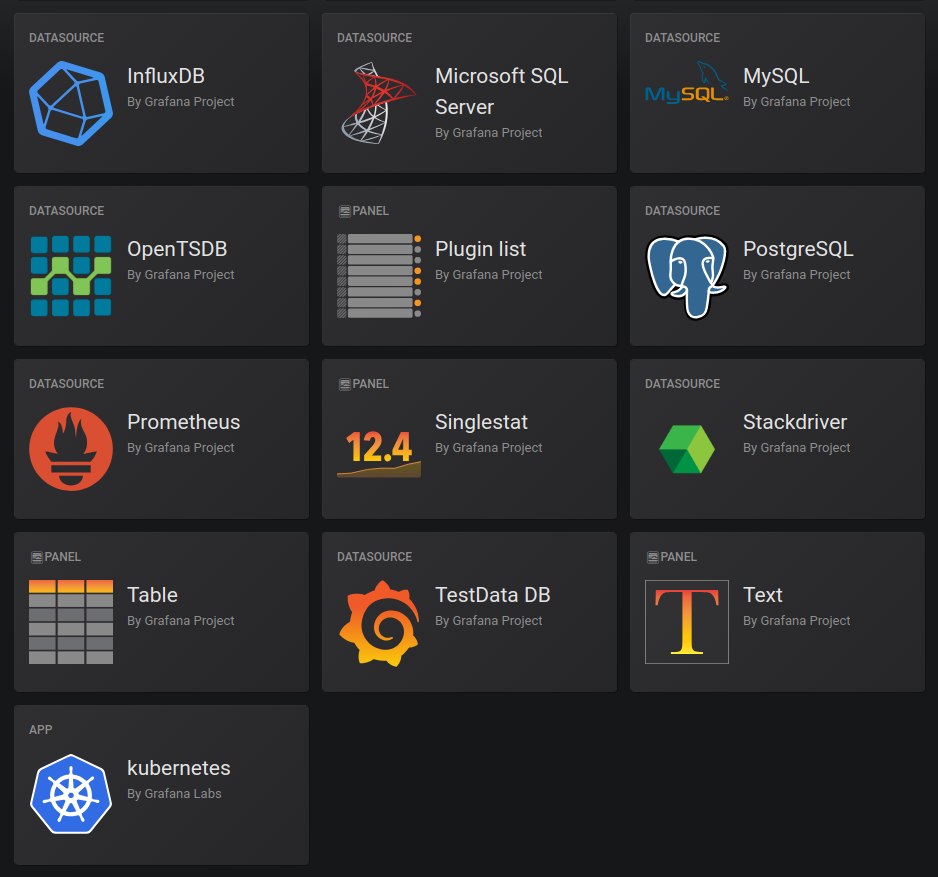
To test our Grafana instance, we can add a data source. The simplest is adding a Grafana TestData source, a fake data source for testing purposes that makes verifying Grafana features easier and faster. For production scenarios, DreamFactory provides a self-hosted platform with governed API access to any data source, enabling seamless integration with your enterprise applications and databases.
Click ‘Create your first data source’ and choose ‘TestData DB’, then click ‘Save and test’.
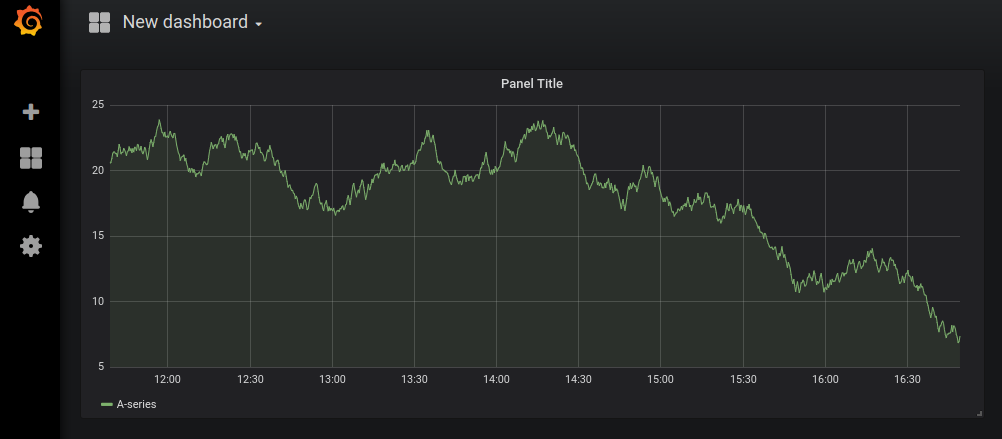
Now, click ‘Create a new dashboard’.
To see a panel with test data visualization, you can choose “Graph” or “Heatmap”, among others. Depending on the monitoring solution you're using, there may even be additional resources available. The Graphite webapp, for instance, offers on-demand graphs via Cairo library. Such a massive library can prove invaluable to telling the story of your data.
Extending Grafana
Using plugins, we can extend our default installation. Many plugins are installed by default, but you can add more depending on your needs. You can learn more about building Grafana dashboards and plugins in our advanced Grafana tutorial.
There are 3 types of plugins: Panels, Data Sources, and Apps. To install a plugin like Grafana Kubernetes App, you need to execute this command:
grafana-cli plugins install grafana-kubernetes-app
Then, restart the Grafana service using:
service grafana-server restart
Since we use containers, the command to execute in our context is:
kubectl exec -it grafana-96fd979c-kjfhr grafana-cli plugins install grafana-kubernetes-app
You should, of course, change grafana-96fd979c-kjfhr for the name of your pod. Once the app is installed, instead of restarting the service, we can just scale the deployment to 0, then to 1 or more replicas.
kubectl scale deployment grafana --replicas=0
kubectl scale deployment grafana --replicas=1
Because container storage is ephemeral, our installation will get lost once pods are scaled or killed. In the next section, we will show you how to avoid this problem by using persisting Grafana storage.
Persisting Grafana Storage
Some of the Grafana data must persist in our cluster, even when we do operations like scaling, restarting, or killing pods.
First, we need to create a Grafana deployment that uses a persistent volume:
apiVersion: apps/v1
kind: Deployment
metadata:
  labels:
    app: grafana
  name: grafana
spec:
  replicas: 1
  selector:
    matchLabels:
      app: grafana
  template:
    metadata:
      labels:
        app: grafana
    spec:
      containers:
      - image: grafana/grafana:5.4.3
        name: grafana
        ports:
        - containerPort: 3000
          name: http

        volumeMounts:
          - name: grafana-storage
            mountPath: /var/lib/grafana
      volumes:
        - name: grafana-storage
          persistentVolumeClaim:
            claimName: grafana-storage
      securityContext:
        runAsNonRoot: true
        runAsUser: 65534
        fsGroup: 472
The above deployment uses the volume /var/lib/grafana.
Next, create the persistent volume claim:
kind: PersistentVolumeClaim
apiVersion: v1
metadata:
  name: grafana-storage
spec:
  accessModes:
- ReadWriteOnce
  resources:
requests:
storage: 1Gi
You can adapt the different configurations to your needs.
After creating the volume claim and the deployment, we need to create the load balancer service to expose the deployment:
apiVersion: v1
kind: Service
metadata:
  name: grafana
  labels:
    app: grafana
spec:
  type: LoadBalancer
  ports:
  - port: 3000
    protocol: TCP
    targetPort: http
  selector:
    app: grafana
Our Kubernetes manifests files are stored in grafana-deployment.yaml, grafana-pvc.yaml, and grafana-service.yaml, respectively.
The final step is creating our Kubernetes objects:
kubectl create -f grafana-deployment.yaml -f grafana-pvc.yaml -f grafana-service.yaml
At this step, the cluster is reachable on the load balancer IP on port 3000. You can repeat the Kubernetes app installation procedure to make sure that the persistence is working.
kubectl exec -it grafana-96fd979c-kjfhr grafana-cli plugins install grafana-kubernetes-app
Setting up Kubernetes Monitoring using MetricFire
The setup we have done above works for very basic Kubernetes infrastructure, which would contain just a few nodes. In order to handle the production-level load, which would be a few hundred nodes and upwards of a few Mbps network traffic, you would need to scale out both Graphite and Grafana to handle the increasing load.
That’s where Hosted Graphite and Hosted Grafana come into the picture. They allow you to scale for long-term storage and provide redundant data storage without going through the arduous process of setting up Graphite and Grafana, as detailed above.
Hosted Graphite and Hosted Grafana through MetricFire allow for the continuous active deployment of new features, as MetricFire’s products all have their foundations in the ever-growing open-source projects. Configuring the Telegraf agent as a Daemonset that forwards node/pod metrics to send Kubernetes metrics to your MetricFire account is simple. It just requires configuring your account's API key to be used as the prefix for each metric and the URL Endpoint to be used as the server destination. Check out our article Monitoring Kubernetes with Hosted Graphite to learn how to set up monitoring your Kubernetes infrastructure quickly and easily using our Hosted service.
Conclusion
Deploying Grafana to a Kubernetes cluster is very simple. In this post, we have created a step-by-step guide that helps make the process seamless. Grafana’s versatility and flexibility allow you to adapt it to your specific needs, making it an excellent choice if you need to monitor, analyze, or visualize data.
In addition to Kubernetes, Grafana offers Cloud and Prometheus monitoring, all available in a modern platform that is affordable and easy to use. Data is only as valuable as the tools you use to interpret it. We recommend our Hosted Graphite offering to get the most out of your metrics. If you're not ready for any big changes, we'll still make it easy for you to get started.
Try out our free trial and start making dashboards right away. Also, feel free to book a demo if you have questions about what our service can do for you.