Explore insightful articles, tutorials, and updates on MetricFire’s blog. Stay informed about the latest trends in monitoring, cloud services, and best practices for optimizing your infrastructure and applications.
A whole industry of cloud providers has sprung up to offer management of the... Continue Reading

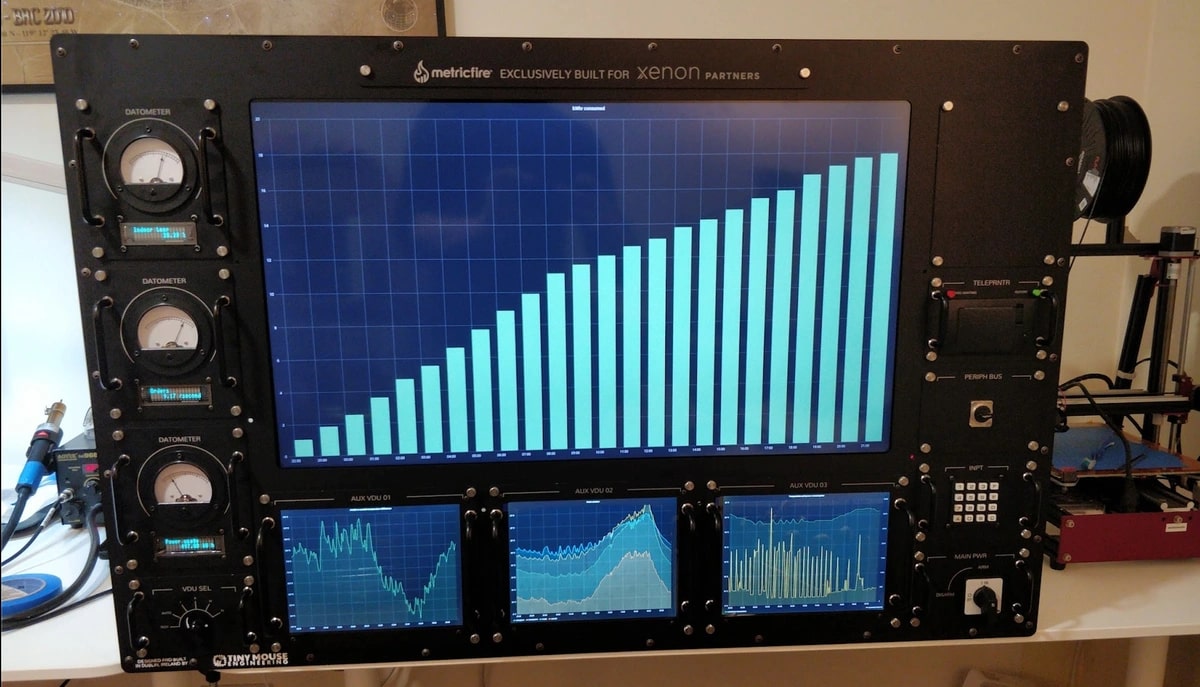
Use MetricFire as your network monitoring tool in 2020. Cost effective and built on... Continue Reading

In this article, we will explore the basics of Grafana and learn how to... Continue Reading
Take a look at the differences between open-source Redis and Redis Enterprise. Get oriented... Continue Reading

AWS KMS is a comprehensive solution to manage cryptographic keys used across not only... Continue Reading
Discover why MetricFire outperforms Nagios as a monitoring tool. Learn about the key advantages... Continue Reading
Compare AWS CloudWatch and Prometheus custom metrics, and look at which tool will be... Continue Reading
Microservices and microapps are both core components of today's application development. Learn what makes... Continue Reading
MetricFire is now offering a free 50” Vizio 4K TV with built-in Chrome Cast... Continue Reading

Take a look at the difference between webhooks and API. Continue Reading
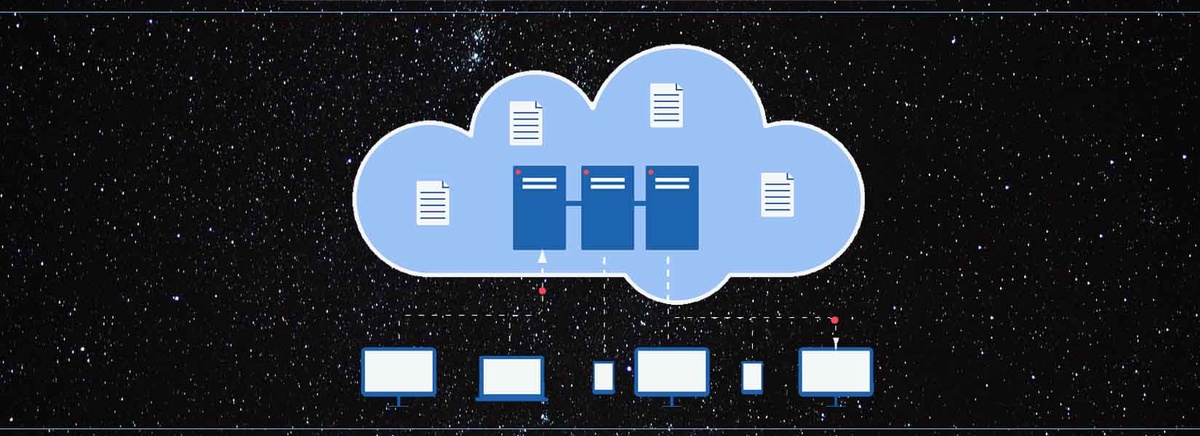
MetricFire can help you design a cloud data warehouse for your big data to... Continue Reading
Step by step tutorial on how to set up Prometheus and Grafana in MetricFire.... Continue Reading
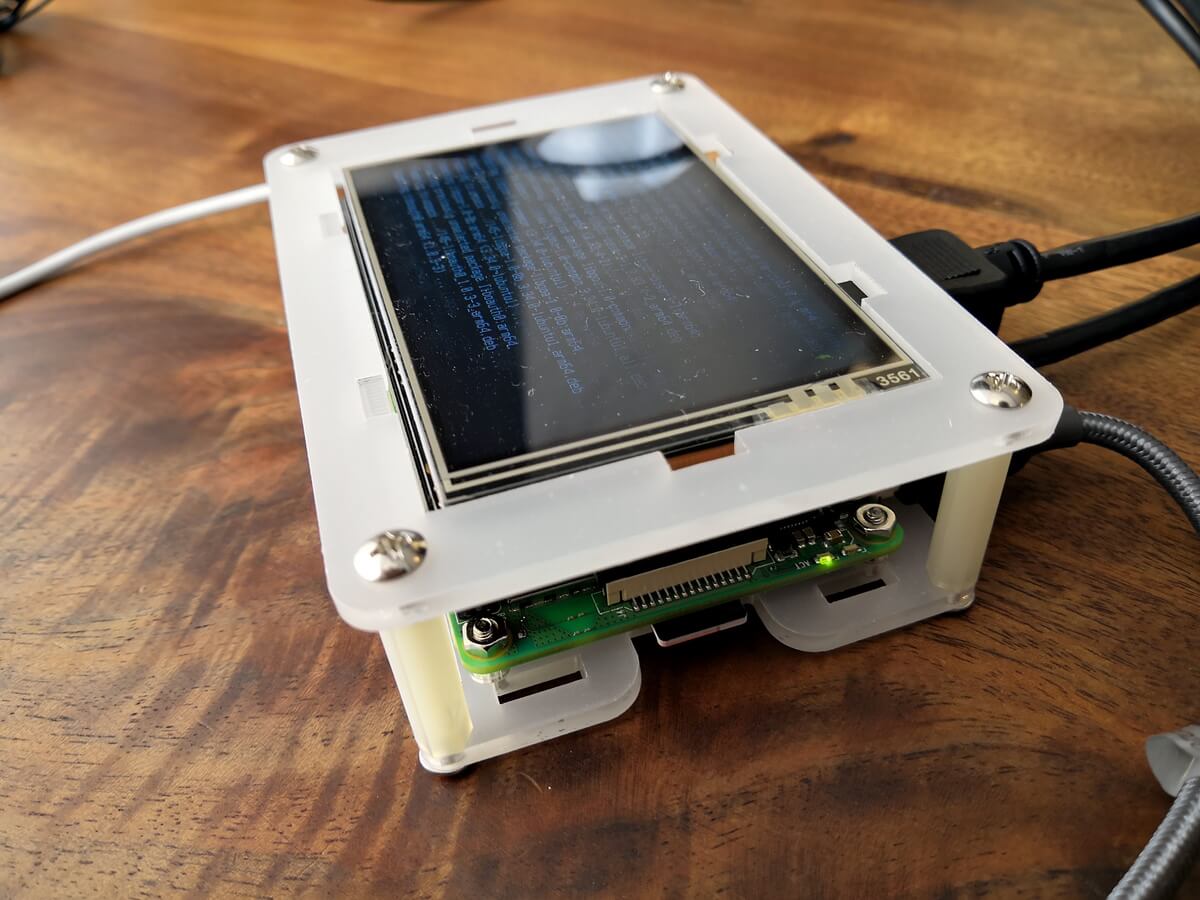
Monitor IoT with Prometheus, Grafana and Graphite. This article is a tutorial on how... Continue Reading
Understand the benefits of using Kubernetes or AWS ECS. Understand how they're different, and... Continue Reading
Use webhooks to set up an alert notification channel on Slack. Continue Reading


