
Table of Contents
Great systems are not just built. They are monitored.
MetricFire runs Graphite and Grafana as a fully managed service for growing engineering teams, taking care of storage, scaling, and version updates so your team doesn't have to. Plans start at $19/month, billed per metric namespace rather than per host, and include engineer-staffed support. Integrations work natively with Heroku, AWS, Azure, and GCP, and data is stored with 3× redundancy in SOC2- and ISO:27001-certified data centres.
Prometheus is a great monitoring tool, but the metrics it stores and reads from are temporary. Which means you need to have Prometheus write your metrics to a storage solution. This is where MetricFire comes in. MetricFire does long term Prometheus storage so you don’t need to worry about setting up and maintaining storage for your metrics. You can just focus on creating a Prometheus monitoring solution for your product.
Before we get started, here's what our final product will look like:

Follow along with this tutorial to see how we did it.
MetricFire’s Prometheus Config Settings
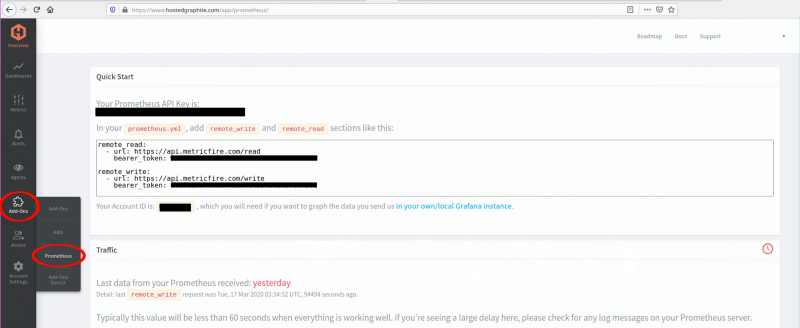
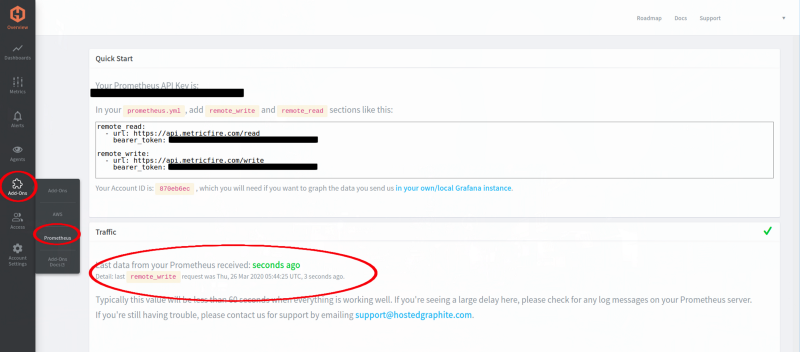
After signing up for the free trial, we will need the API key settings from the MetricFire dashboard. This information will go into the Prometheus config file of our own Prometheus installation. From the MetricFire dashboard as seen in the image below, go to Add-Ons > Prometheus. This block of code will be used later in this article.
If this is your first time trying out Prometheus, continue reading below. Otherwise you can skip ahead to the “Modifying prometheus.yml” section.
Setting up Prometheus
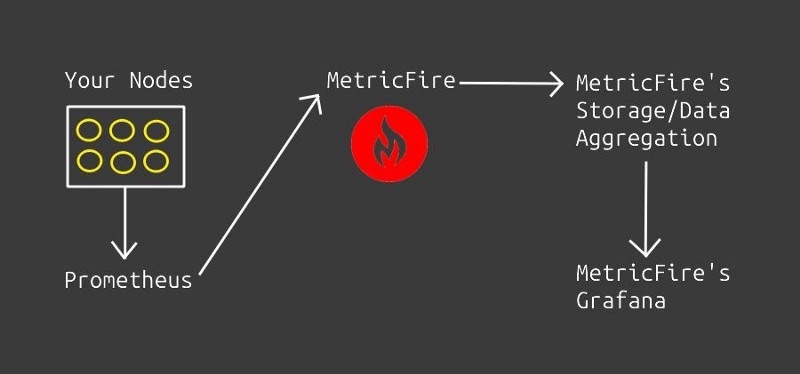
The chart below shows an example of how Prometheus works alongside MetricFire. We just need to set up a node to Prometheus, and then direct Prometheus to MetricFire so that MetricFire can read and write metrics. If you’re building an enterprise application or integration layer that needs to access metrics and other data across your systems, you might also consider DreamFactory, which provides governed API access to any data source for enterprise apps.
We first will download the Prometheus and the node exporter. Head on over to the download section on the Prometheus site.
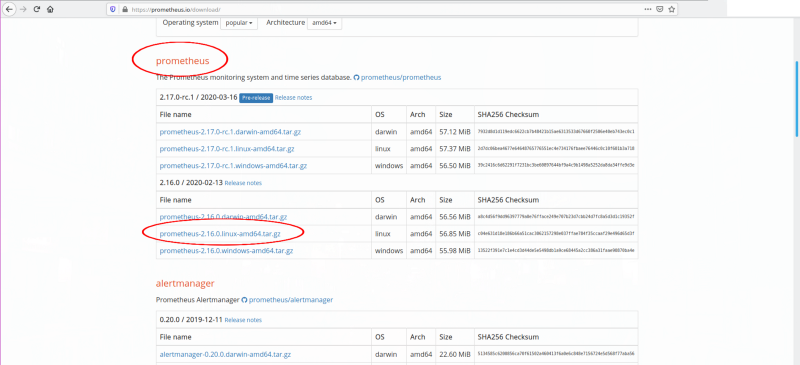
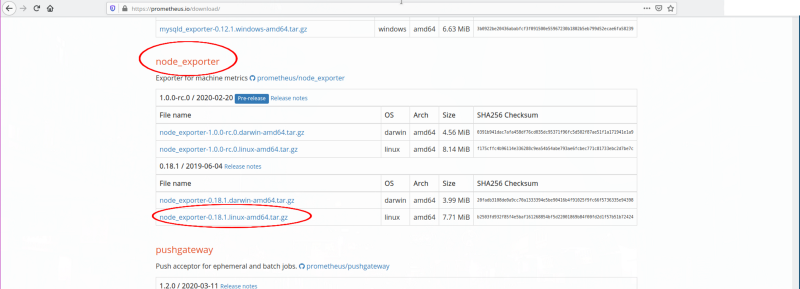
Right click and copy link location on the red circled parts from the images above to get a download URL.
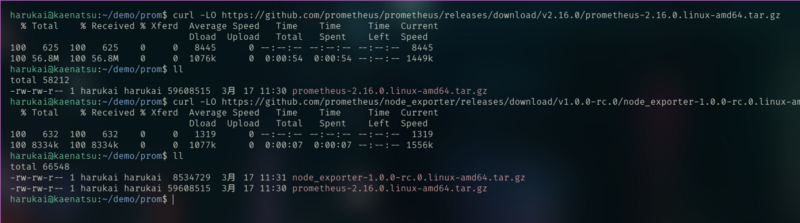
curl -LO URL_FROM_LINKS_ABOVE
Use the code snippet above to download Prometheus on to the machine you want to host Prometheus on, and the node exporter to the machine you want to monitor. In the command above, replace “URL_FROM_LINKS_ABOVE” with the links we grabbed from the Prometheus download section. Check out the full example in the image below.
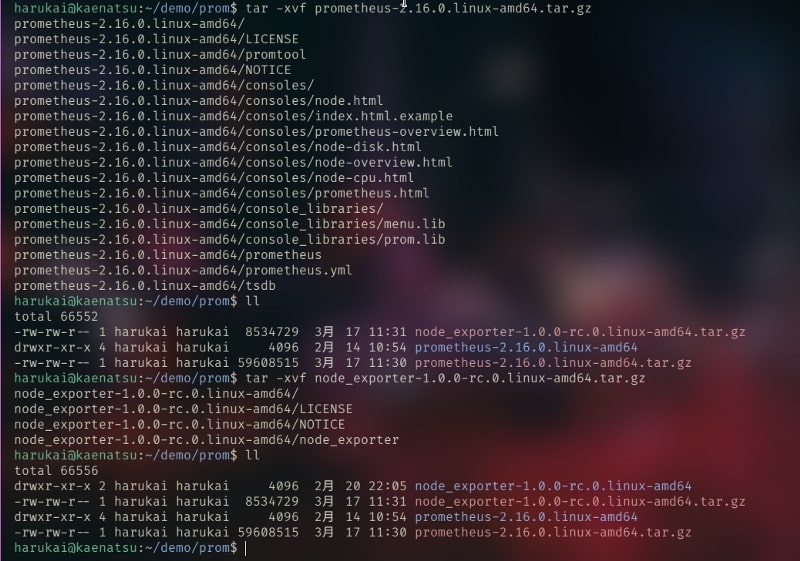
Next let’s extract our tar.gz files with the code snippet below:
tar -xvf TAR_GZ_FILE_NAME
Modifying prometheus.yml
Before running Prometheus, let’s edit its configs to collect metrics from one of our nodes. Then let’s send metrics to MetricFire so we can store and aggregate our Prometheus metrics.
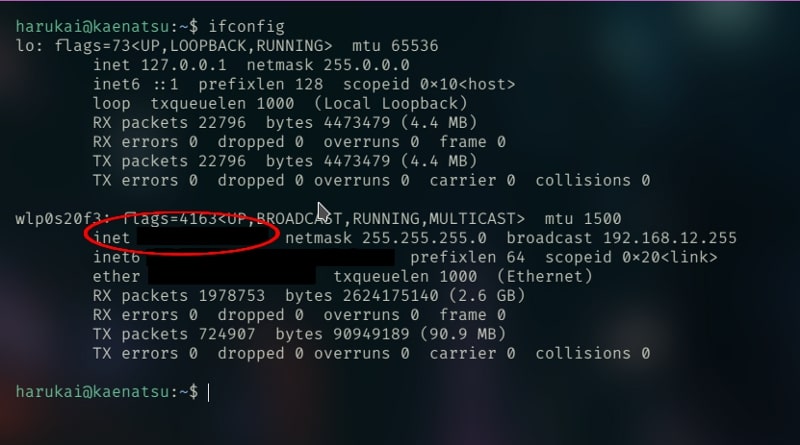
First let’s modify the .yml file to target our current node, which is on the same machine. We will need to run ifconfig to find our IP address, like in the image below.
Then let’s go into our .yml file and edit the contents like in the image below.
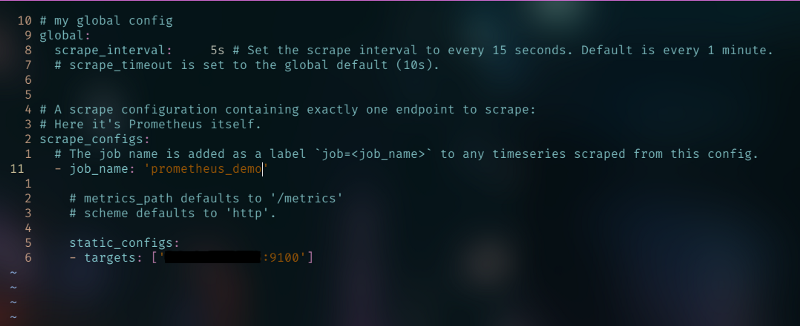
The job_name can be what kind of metrics your node is exporting, and the targets is a list of your nodes. You can copy and paste from the code snippet below, and replace JOB_NAME and IP_FROM_IFCONFIG appropriately.
global:
 scrape_interval: 5s
scrape_configs:
 - job_name: 'JOB_NAME'
   static_configs:
   - targets: ['IP_FROM_IFCONFIG:9100']
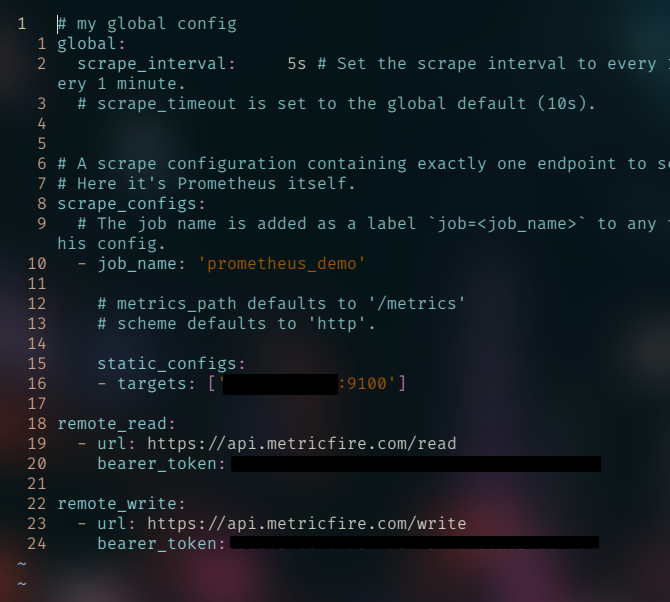
Lastly for the .yml file, let’s add our block of code that we got from the first bit in this article. We got the custom config code snippet from our MetricFire dashboard, you can check out how to do in the section “MetricFire’s Prometheus Config Settings” above. Check the image below for indentation of the code on lines 18 - 24.
Running Prometheus and Node Exporter
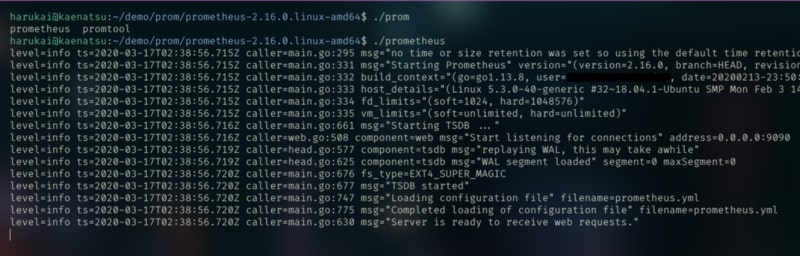
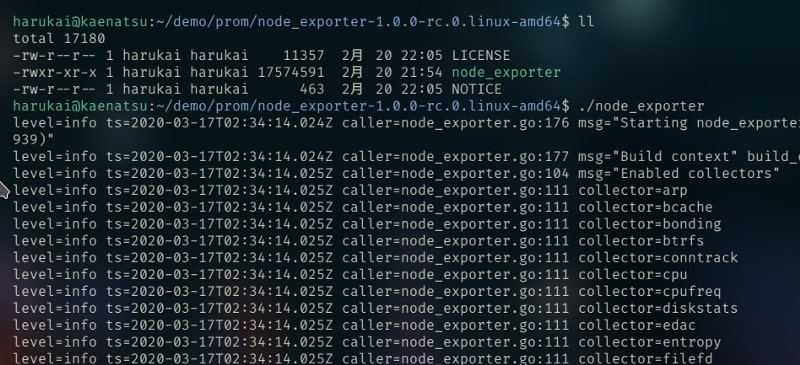
Now that we have everything set up, it’s time to run Prometheus and a node. Go into the unzipped tar.gz files we got earlier. In the Prometheus folder run ./prometheus, and in the node_exporter folder run ./node_exporter.
Now we should be sending metrics to MetricFire that will then be stored and aggregated for you. You can check to see if it worked by going to your MetricFire dashboard, where you can see when the most recent metrics were sent from your Prometheus client. See it circled in the image below.
Using Grafana on MetricFire
After running a node, modifying our .yml file to target our node and MetricFire, and running our Prometheus client, we should be storing and aggregating Prometheus metrics in our MetricFire account.
MetricFire comes with hosted Grafana, so we can have a more dynamic dashboard for our Prometheus metrics. Also, since MetricFire is handling our metrics storage, our Prometheus metrics are able to show long term charts rather than only short term.
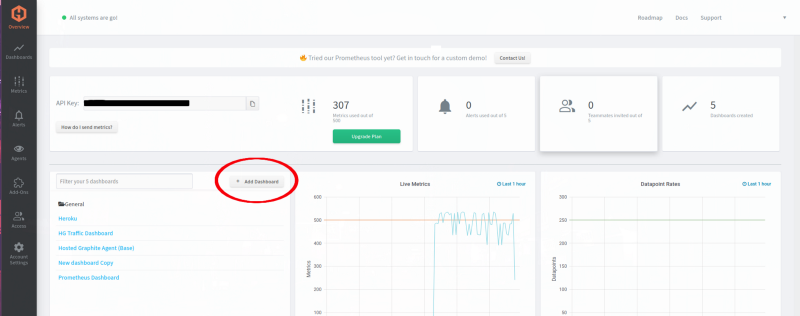
Let’s create a dashboard for our CPU data that we are receiving now. Go to “+ Add Dashboard” like in the image below.
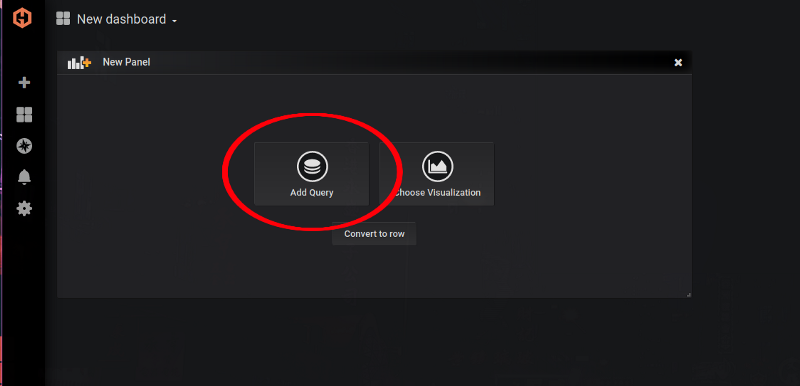
Then “Add Query”.
And now we can add a query to our total cpu usage, like in the image below.
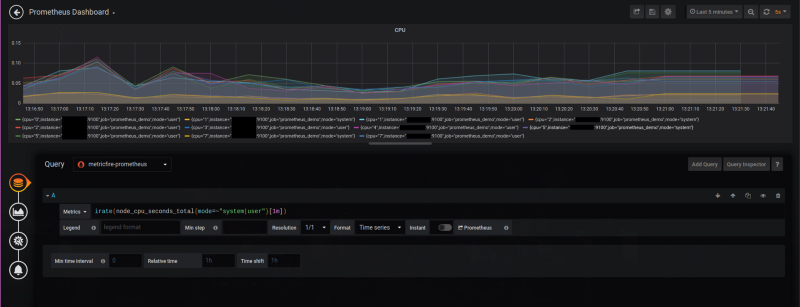
You can use the code snippet below and paste it into the query to see how it works out for you. I’m using an irate on the total cpu for only system and user.
irate(node_cpu_seconds_total{mode=~"system|user"}[1m])
Conclusion
This blog post showed how to get Prometheus and Grafana set up on MetricFire. MetricFire’s Hosted Prometheus stores metrics for up to two years with 3x redundancy for all data for all users.
To sign up for the free trial, click here to get started. Also, get the MetricFire team on a video call by booking a demo. We’re always happy to support our users to use the platform to its fullest.