

Table of Contents
- Display Your Dashboards on a TV using MetricFire and Chromecast
- Take Your Team’s Monitoring to The Next Level With a Custom MetricFire Physical Dashboard!
- How Our Physical Dashboard Works
- What Can Our Physical Dashboard Prototype Do?
- Configurable Display
- Alert Reporting Built-In
- Get Your Physical Dashboard Today!
- Get Started With Taking the Hassle Out Of Monitoring Your Infrastructure Today!
Great systems are not just built. They are monitored.
MetricFire runs Graphite and Grafana as a fully managed service for growing engineering teams, taking care of storage, scaling, and version updates so your team doesn't have to. Plans start at $19/month, billed per metric namespace rather than per host, and include engineer-staffed support. Integrations work natively with Heroku, AWS, Azure, and GCP, and data is stored with 3× redundancy in SOC2- and ISO:27001-certified data centres.
Here at MetricFire, our mission is to make great, fully-featured monitoring accessible to teams of any size and scale. We are committed to making the transition back to a shared working space as easy as possible for DevOps teams and helping our customers kick-start building a Data-Driven engineering culture.
To aid in this MetricFire is now putting into action special offers to make your dashboards even more accessible to your team:
- MetricFire is now offering a free 50” Vizio 4K TV with built-in Chrome Cast when you sign up for any MetricFire plan with 50,000 metrics and above.
- A custom-made MetricFire Physical Dashboard Kit for Enterprise users
One of the best ways to ensure your whole team knows what your technology is doing is to ensure everyone has quick and easy access to your dashboards. We’ve heard this loud and clear from our customers who value having a single point of truth within a shared working space broadcasting their dashboards to screens in their workspaces for their team to get real-time updates on key metrics they are monitoring.
Display Your Dashboards on a TV using MetricFire and Chromecast
To ensure your team is always aware of what is happening within your infrastructure, MetricFire is now offering a free 50” Vizio 4K TV with built-in Chrome Cast when you sign up for any MetricFire plan with 50,000 metrics and above.
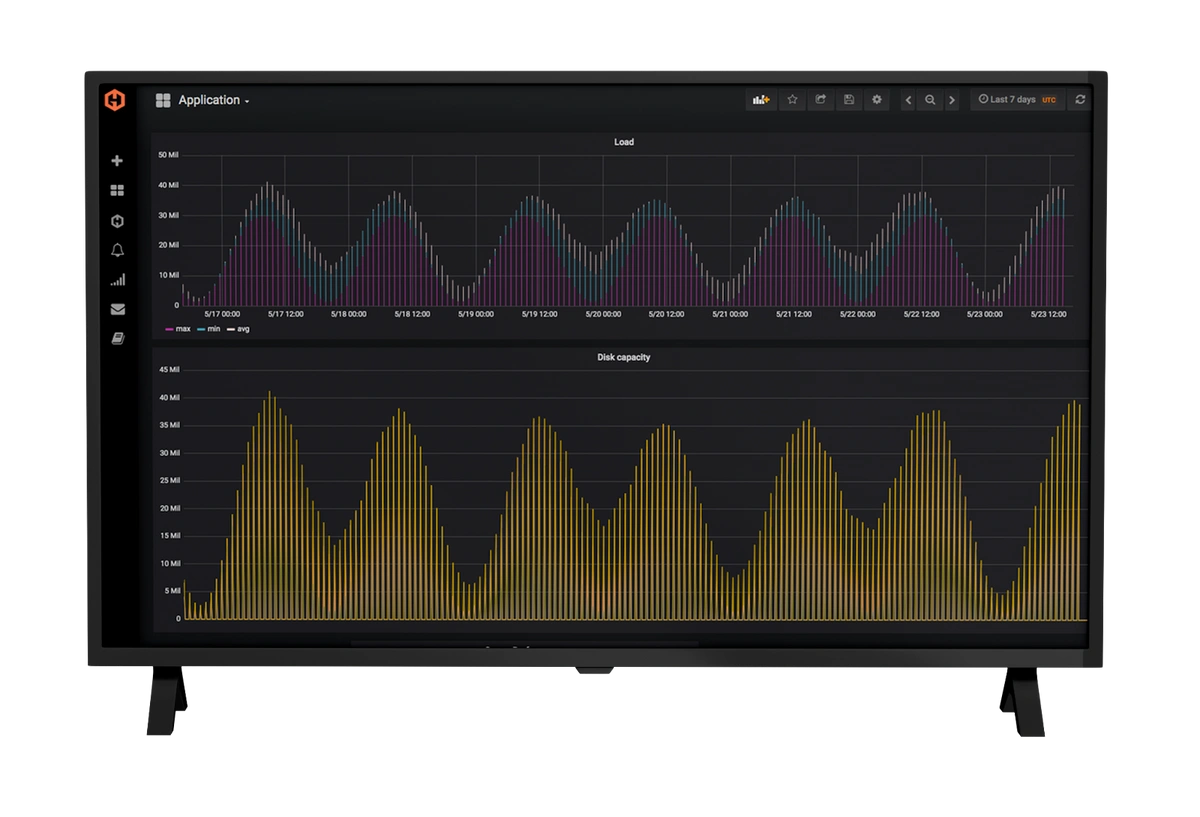
The free Vizio 4K TV that MetricFire offers when signing up for an account with us comes with a built-in Chrome Cast meaning half the set-up process is ready out of the box so setting up your office dashboards can be configured in minutes.
Next, you will need to install Chromecast-Kiosk. This is a tool to create a digital signage system with Google Chromecast allowing you to create a playlist of dashboards of your choosing to display. The Kiosk program can be run on a Ubuntu VM where you can also choose to have multiple different feeds running to different TVs.
Then all you need to do is add a Chromecast, by IP and Name then set the target Chromecast via the URL, and specify the refresh rate of the website you want your dashboards to be displayed.
Take Your Team’s Monitoring to The Next Level With a Custom MetricFire Physical Dashboard!
We’ve also recently embarked on a special experimental project to create a prototype of what we believe is a unique innovation in empowering teams to have greater observability in their infrastructure.
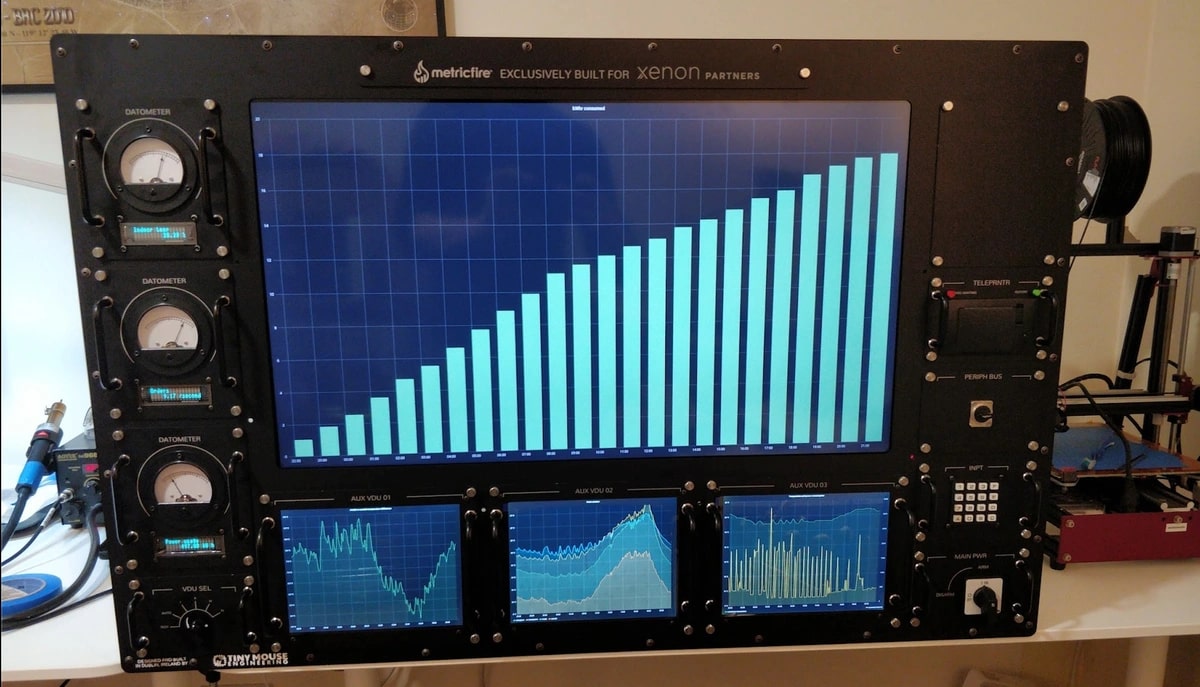
In collaboration with Tiny Mouse Engineering, we are developing a physical dashboard capable of displaying any dashboard configured to it and compatible with Hosted Graphite alerting systems.
MetricFire is happy to work with providing one of our physical dashboards to any team that signs up for an Enterprise-level plan with us. You can find our complete plans and pricing here and book a demo with our team to find out more!
How Our Physical Dashboard Works
The dashboard itself runs from a machine running Linux linked to the display screens via HDMI and the display switch via custom electronics communicating over a CANBUS interface.
What Can Our Physical Dashboard Prototype Do?
Now we know what’s under the hood of our dashboard, let’s look at some of the features and how your team can use this as a central hub for your observability.
Configurable Display
With a main 32” screen and three additional display screens built-in, you can choose what dashboards to display and configure these on specific pre-sets. Then, with just a turn of the big chunky dial, you can quickly cycle between your dashboards on the four main dashboard screens for an easy up-close view of your data. The dial is tough and satisfying to use - big ‘click’ noises from the rugged hardware, and it brings a pleasing feel and interactivity to what was previously just a dashboard on a screen.
The dashboard has been purposely designed and built to be an engaging piece of art and machinery that enhances the experience of interacting with a dashboard. On top of this, the MetricFire customer success team will create custom dashboards tailor-made for the screens based on the monitoring criteria that matter most for your business.
Click here to see our dashboard in action!
Alert Reporting Built-In
Our dashboard has full integration with Hosted Graphite’s alerting system. This means that at the push of a button with the built-in receipt printer, you can generate a detailed report of the status of your configured alerts.
Click here to see our altering receipt printer in action!
Get Your Physical Dashboard Today!
The above is our prototype version and we have been proud to execute this project (as well as the dashboard being enjoyable to create too). We want to get one of these custom dashboards in your hands so that other teams can benefit from its capabilities to keep you informed of your key dashboards in a unique way that can encourage your team to transition back to a shared working space. Not just practical, we consider these dashboards to be a piece of interactive art.
If dashboards are mission-critical to your organization and you need eyeballs on your data every few seconds then having a central office dashboard hub transmitting the status of your infrastructure to your team can make a big difference to the observability of your systems.
Register your interest by reaching out to Elliot Langston on our sales team who is coordinating the dashboard project at sales@metricfire.com. Also to discuss your monitoring use case and how we can take the burden of running monitoring infrastructure away from your team and increase the reliability of your metric tooling book a demo with our team to find out more. Then sign up for a free 14-day trial to test out Hosted Graphite, our dashboards, integrations, and more.
Get Started With Taking the Hassle Out Of Monitoring Your Infrastructure Today!
Running server, application, and infrastructure monitoring is a full-time job. MetricFire is committed to running your whole monitoring stack for you so you never have to worry about setup, server costs, troubleshooting, security updates, and server management. At MetricFire, we handle those issues so you can focus your time, resources, and money on your business’s revenue-generating projects. and the common theme is that they all have teams of technical people relying on our service every day
This now includes providing your team with a beautiful, big-screen in-office monitoring set-up and as always, our support folks will guide your team on configuring your dashboards and sharing your data across your organisation Find full details on our plans and pricing here.
We offer a free 14-day trial which gives you a full taste of Hosted Graphite, our dashboards, integrations, and more! If you’re not sure where to begin, our support team can help you figure out how to achieve your monitoring use case by booking a demo.

