
Table of Contents
Great systems are not just built. They are monitored.
MetricFire runs Graphite and Grafana as a fully managed service for growing engineering teams, taking care of storage, scaling, and version updates so your team doesn't have to. Plans start at $19/month, billed per metric namespace rather than per host, and include engineer-staffed support. Integrations work natively with Heroku, AWS, Azure, and GCP, and data is stored with 3× redundancy in SOC2- and ISO:27001-certified data centres.
Introduction
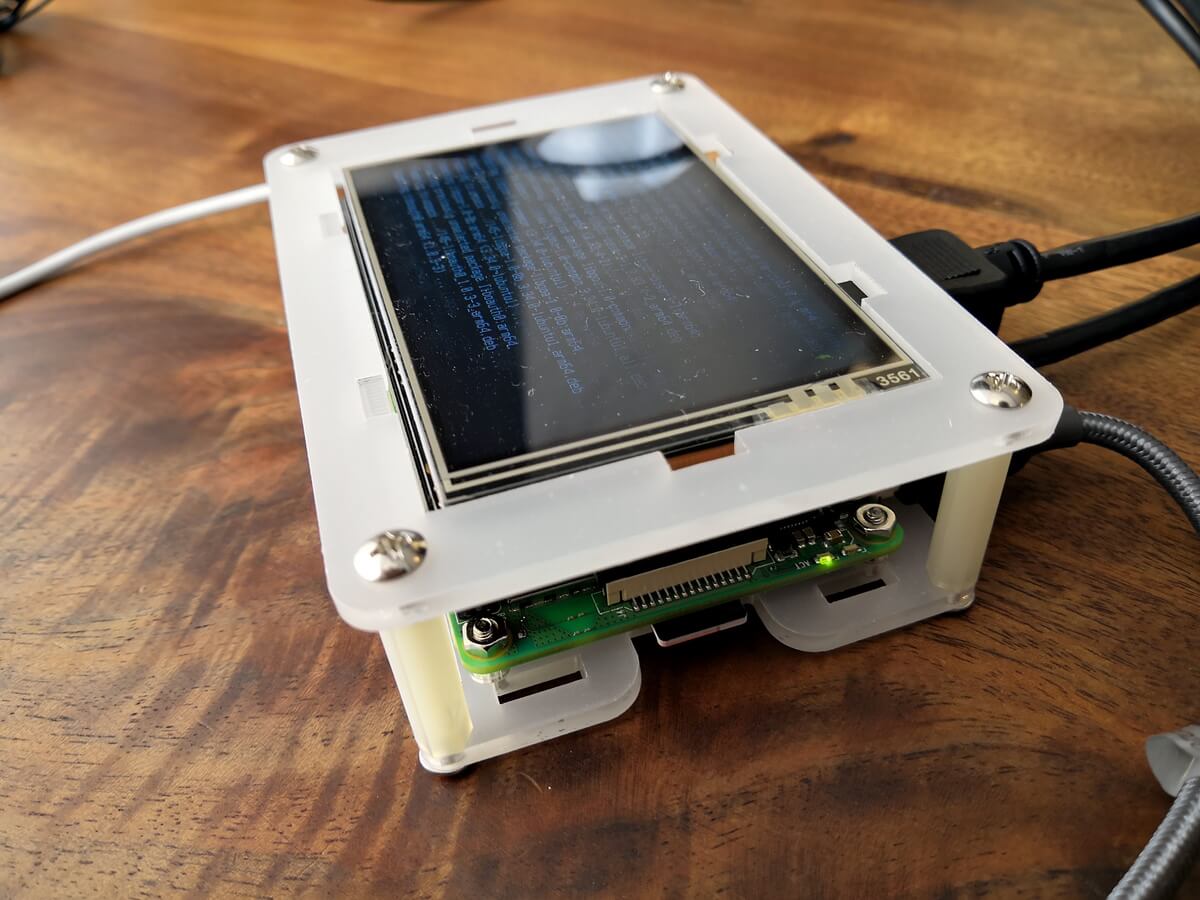
In this blog post, we'll show you how to set up a Raspberry Pi 4 to be monitored by Graphite and Grafana. We'll start by setting up the device to send metrics, then we'll send the metrics over to MetricFire via StatsD and Collectd, and then we'll display the information on a Grafana dashboard. If your IoT device is running on Raspberry Pi, or if it is using Linux, you can follow this article step by step. Even if you're using different equipment, this article will apply to all IoT devices using Linux.
Key Takeaways
-
Raspberry Pi monitoring setup: Learn how to set up Raspberry Pi 4 for monitoring with Graphite and Grafana. Follow the guide for booting, configuring WiFi, and updating the system.
-
MetricFire for easy monitoring: Sign up for MetricFire's free trial to efficiently send and visualize metrics from Raspberry Pi using Prometheus, Graphite, and Grafana.
-
Collect CPU metrics with Collectd: Install Collectd and use custom config files from MetricFire to send CPU metrics from Raspberry Pi to the monitoring platform.
-
Track button presses with StatsD: Use StatsD and Python to monitor button presses on Raspberry Pi and send the data to MetricFire for analysis.
-
Housekeeping tips for Ubuntu Server on Raspberry Pi: Get useful tips on safely shutting down or rebooting the device and navigating the terminal for smooth management.
How To Monitor Raspberry Pi 4
Get started by signing up for the MetricFire free trial, where you can send metrics and visualize them in the platform within minutes. MetricFire is a service that hosts Graphite, and Grafana, and we'll be using it throughout this tutorial. Setting up the monitoring system with MetricFire will help save tons of setup and maintenance time.
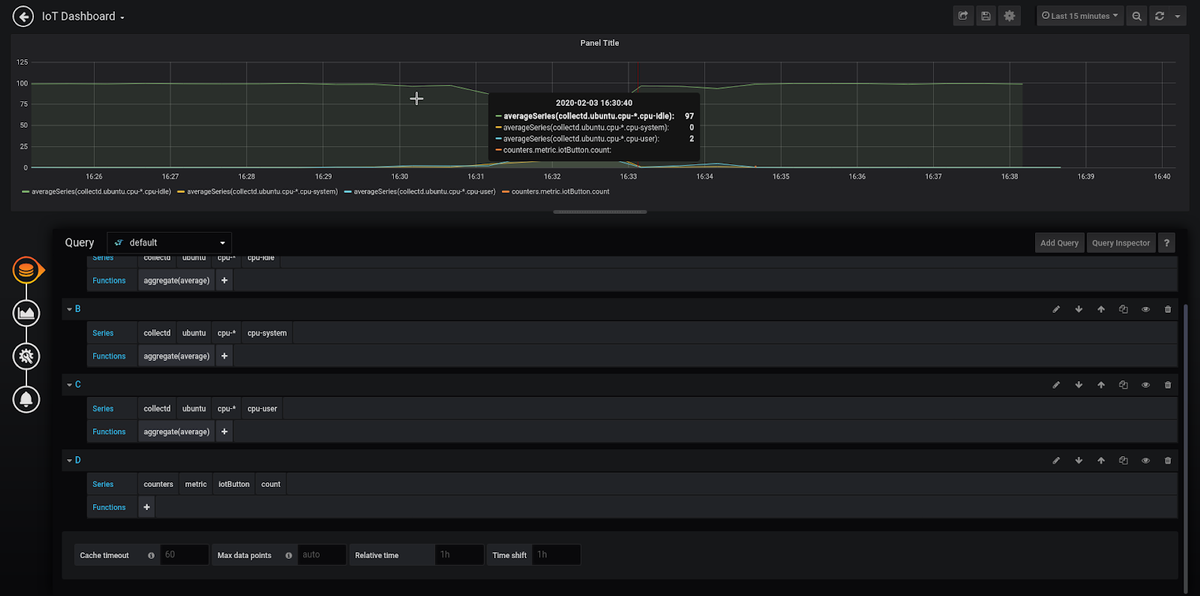
The graph below is our final product: this panel shows the CPU usage/idle of our Raspberry Pi 4, and how many times a button has been pressed. Let's check out how we did it.
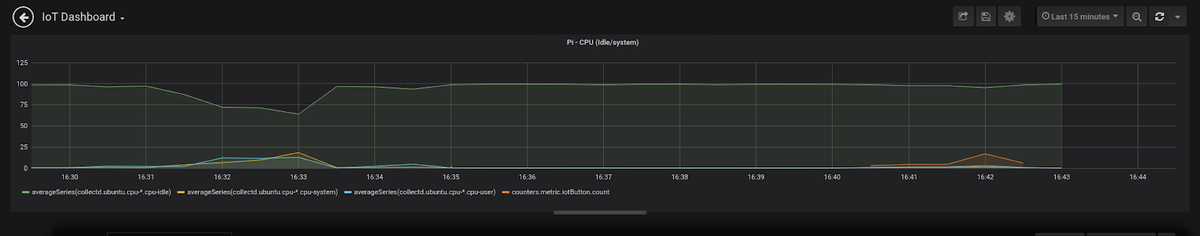
First, we will use Collectd to send CPU metrics from the Raspberry Pi to MetricFire. Then, we will use StatsD on the Raspberry Pi to send data about how many times a button is pushed to MetricFire. Once we have the information in MetricFire, we will visualize it on MetricFire’s Hosted Grafana dashboards.
In order to follow this tutorial, we will be using Collectd installed from the Linux package manager, the Python library for StatsD, and config files downloaded from the MetricFire platform. Custom config files for Collectd need to be used so that Collectd can easily connect to the MetricFire platform.
Setting up the Raspberry Pi for Monitoring
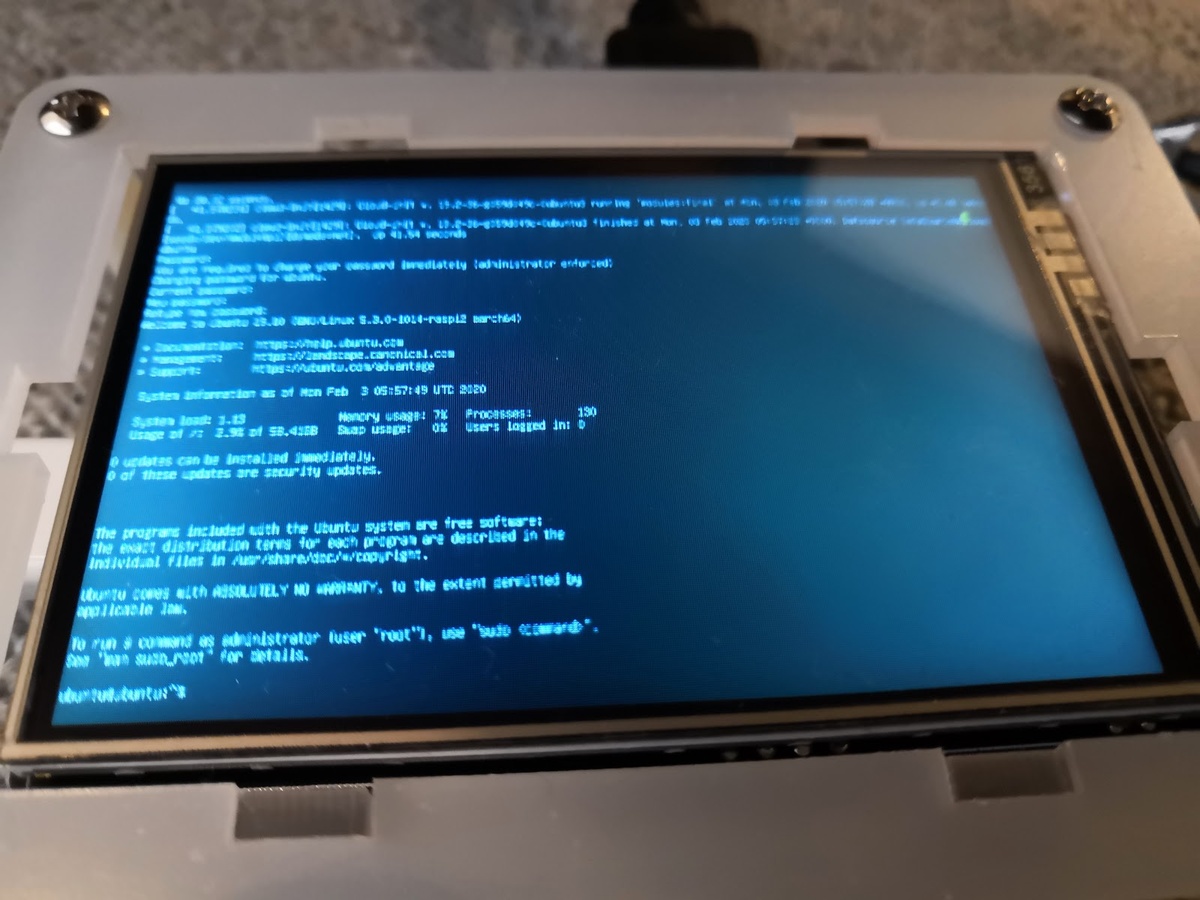
Boot the device with an Ubuntu Server
First, we need to flash the micro SD card to have a bootable OS. Today we will be going with Ubuntu Server 19.10. For Windows, use Rufus (recommended). For Linux or Mac, try Etcher. Once your micro USB is flashed, plug it into your Raspberry Pi 4 and plug in the power. It will take a while to boot into the login prompt, but when you see it type in Ubuntu for both the user and the password. If you are successful, it should prompt you again to change the default password.
Set up the WiFi network
Make sure to connect the device to the WiFi using the following commands:
sudo cp
/usr/share/doc/netplan/examples/wireless.yaml /etc/netplan/
network:
  version: 2
  renderer: networkd
  wifis:
    wlan0:
      dhcp4: yes
      dhcp6: no
      access-points:
        "WIFI_SSID":
          password: "WIFI_PASSWORD"
Configure font size
If you are using one of the small screens with a case add-on, initially the font size of your terminal will be pretty small. To change that, we can run the following command:
sudo dpkg-reconfigure console-setup
Leave everything on default until we get to the font size page. Put the font size on the highest setting.
Update and Upgrade
Once the wifi is working, run the following command:
sudo apt update && sudo apt upgrade
Upgrading is important, as it’ll set up the device as a server. If you get a lock file error, either wait for that process to finish or kill the process number that is displayed in the error if it doesn’t go away. This error occurs when you are simultaneously installing or uninstalling something, as that process will put a lock on the upgrade if it is already doing something.
Setting the Raspberry Pi up for Monitoring
Sending files from your PC to the Raspberry Pi
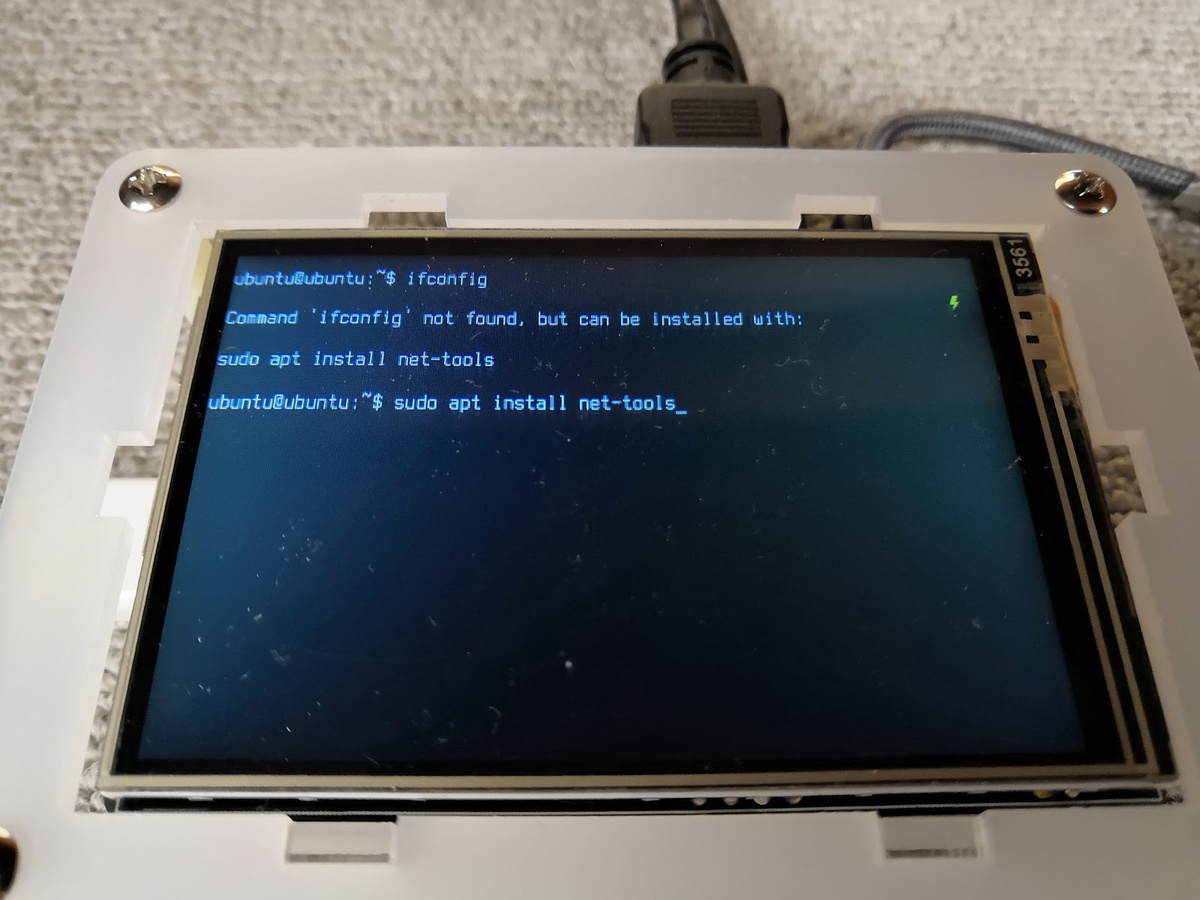
We will be sending files to our Raspberry Pi by SCP and by being on the same wifi network. First, let’s get our wifi’s IP address with ifconfig.
If you don’t have ifconfig, use:
sudo apt install net-tools
Once you run ifconfig, remember the IP address of wlan0. Check the image below and see the red circle as a reference. We will use this IP address to send files via SCP.
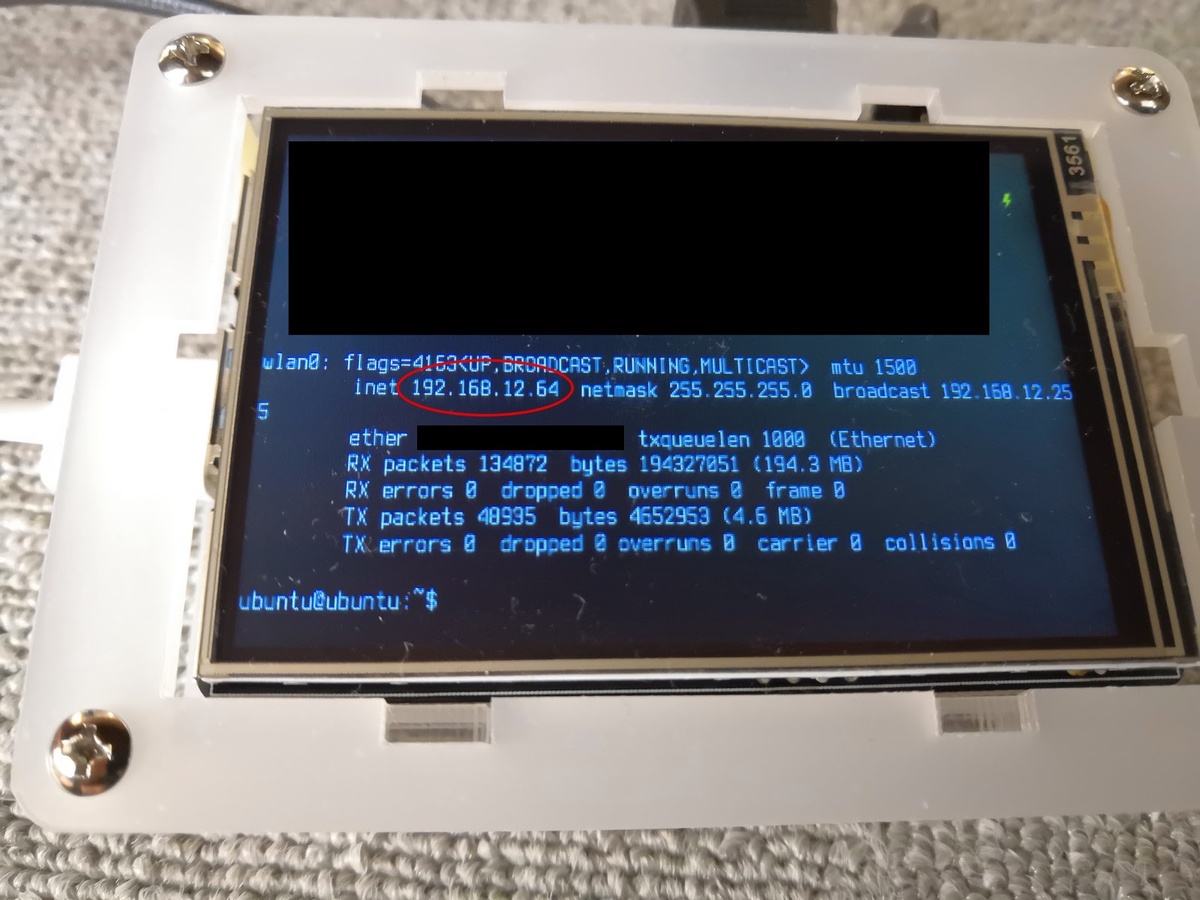
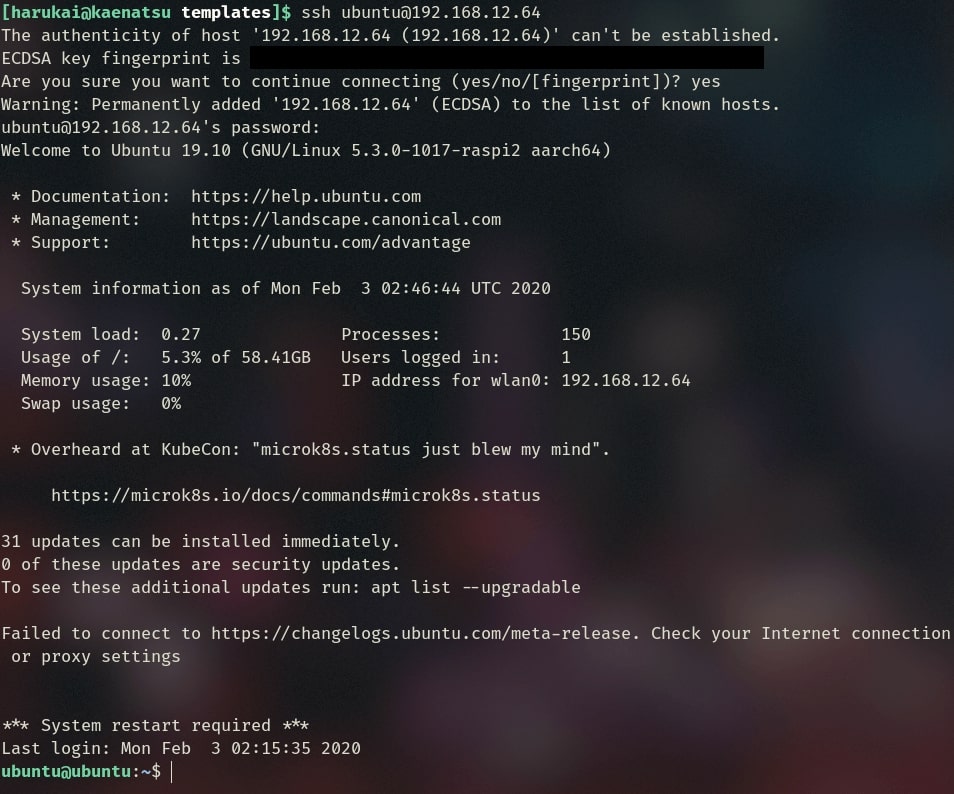
Let’s SSH into our Raspberry Pi from our main PC, so that it’s easier to work with. Run SSH ubuntu@IP_FROM_IFCONFIG and it should ask us for the Raspberry Pi’s password.
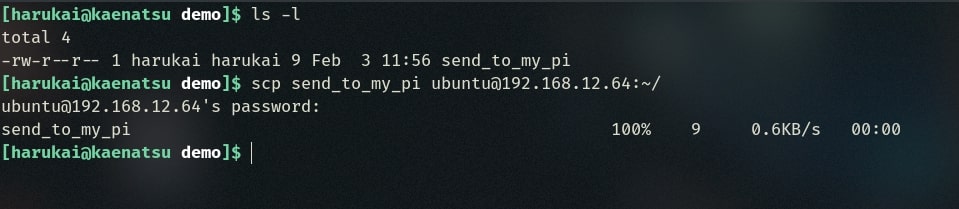
Now let’s try to SCP a file over to our Raspberry Pi 4 from our PC.
scp TESTFILE ubuntu@IP_FROM_IFCONFIG:~/
Sending the Custom Config File from MetricFire
The easiest way to use MetricFire with Collectd is to install MetricFire’s Custom Config file onto the device you’re monitoring. The Config file can be found on the Hosted Graphite platform under the addons section. Go to the Hosted Graphite platform, click addons, click Collectd, and you will see the spot to download the custom config file.
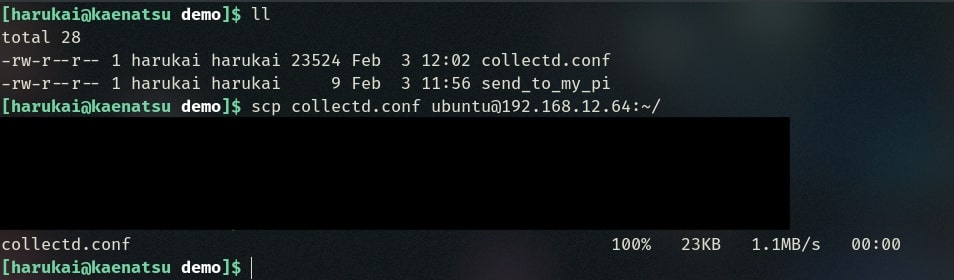
Send your custom collectd 5.4 conf file that you download from your MetricFire account with:
scp collectd.conf ubuntu@IP_FROM_IFCONFIG:~/
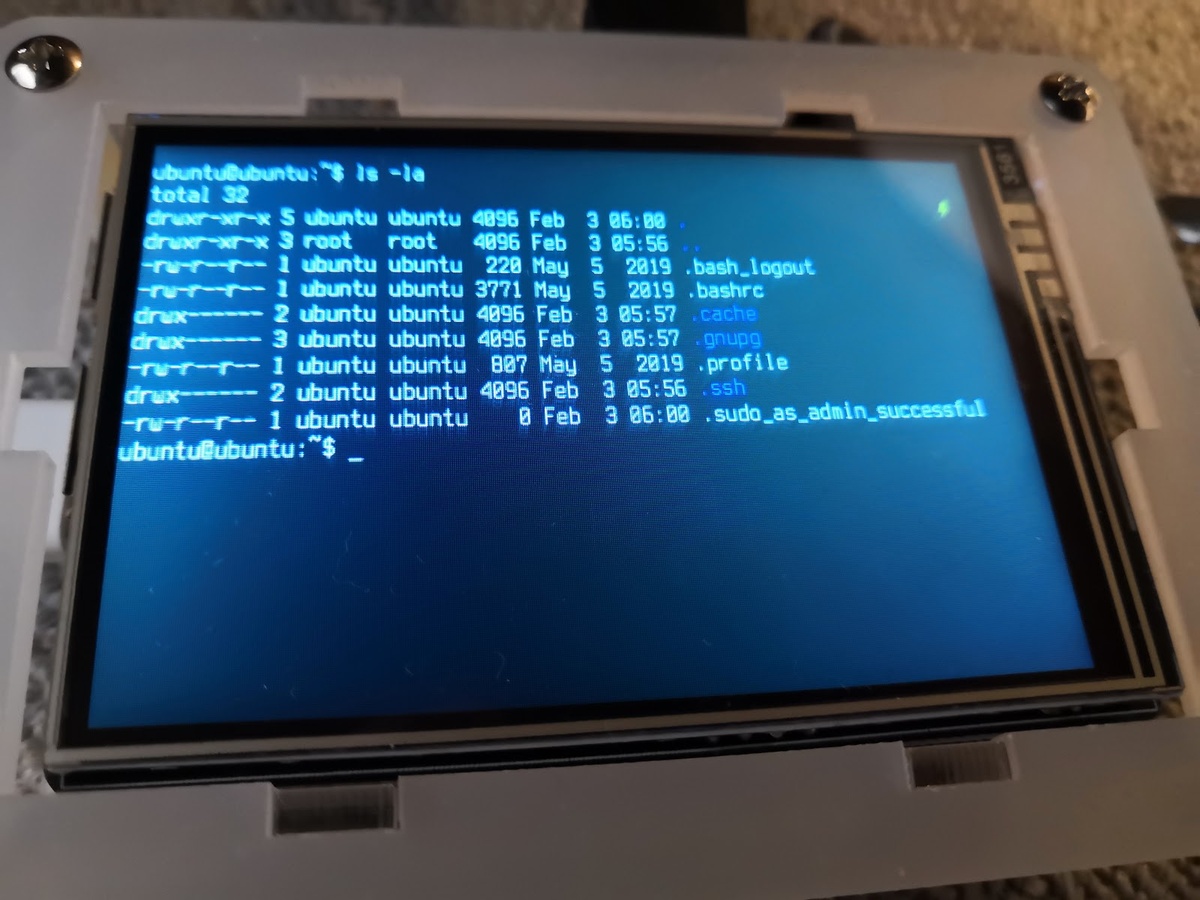
Then confirm on your Raspberry Pi 4 that the file you sent is there, like in the image below.
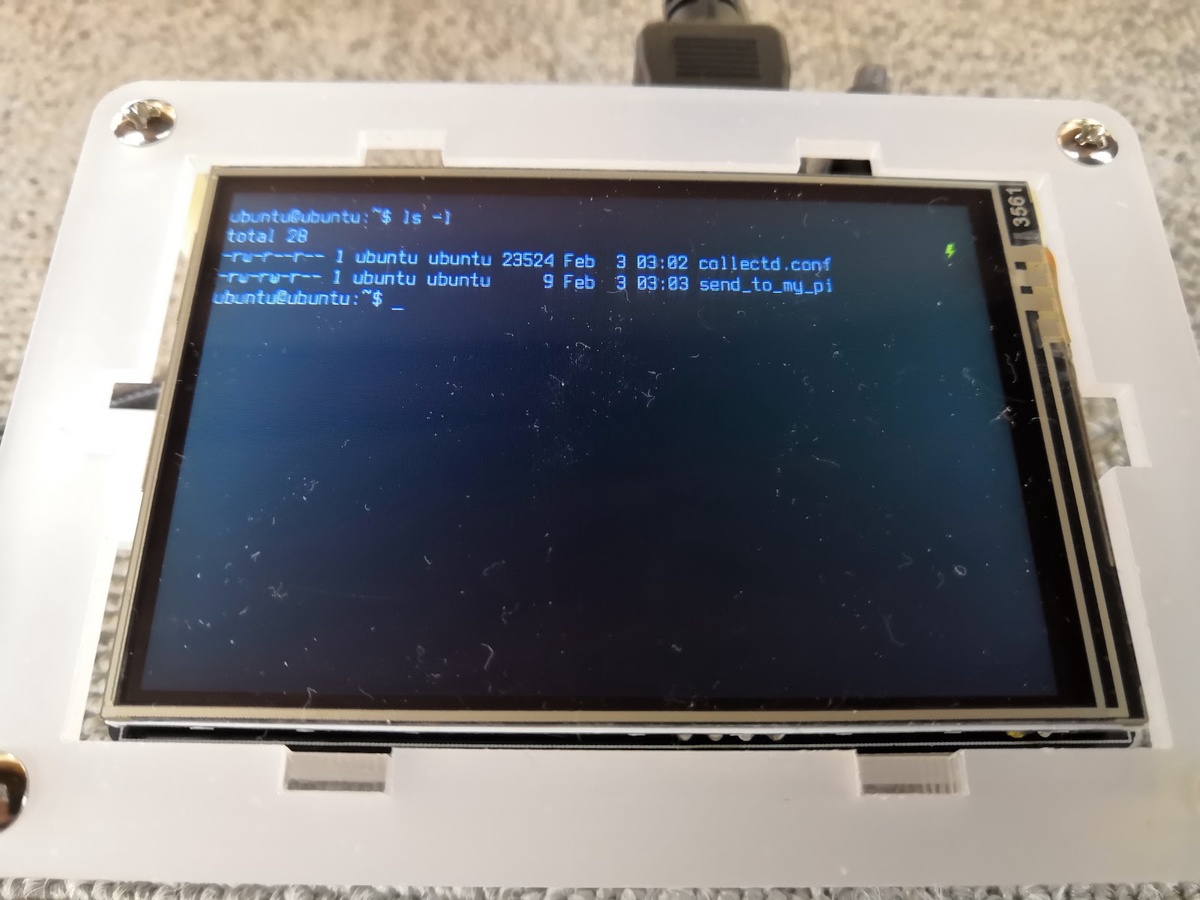
Again, make sure your PC and Raspberry Pi are on the same wifi network in order for SSH and SCP to work.
Setting up Collectd on Raspberry Pi
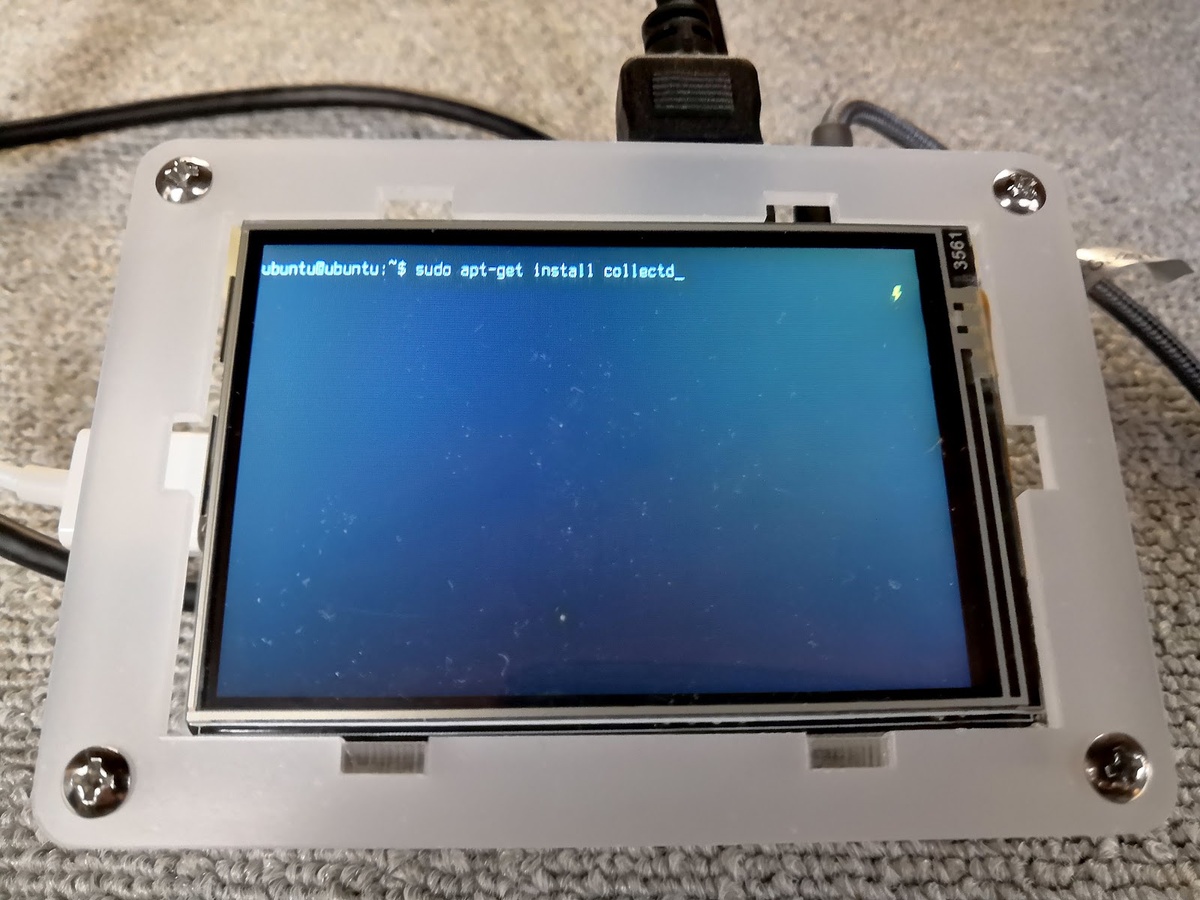
We will now set up a system monitor with collectd and MetricFire. Install collectd with:
sudo apt install collectd
If you haven’t checked out our video tutorial on Collectd, I suggest reading it before continuing to set up MetricFire’s Collectd on your Raspberry Pi.
After Collectd is installed, we will enable Collectd as a daemon, and then start it with:
sudo systemctl enable collectd
sudo systemctl start collectd
You can check the status of collectd with:
sudo systemctl status collectd
Now let’s insert our Collectd config file with the custom one from MetricFire that we sent via SCP. You can overwrite the config file with the command below:
cp collectd.conf /etc/
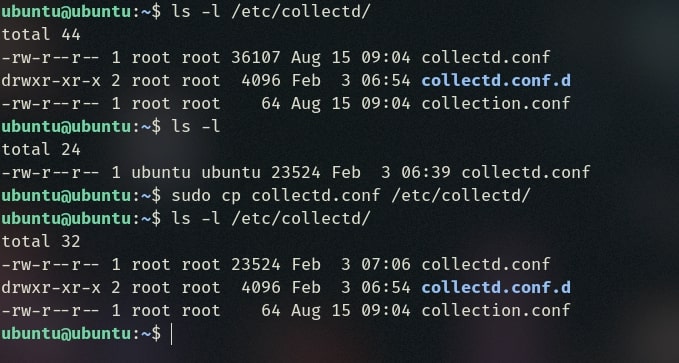
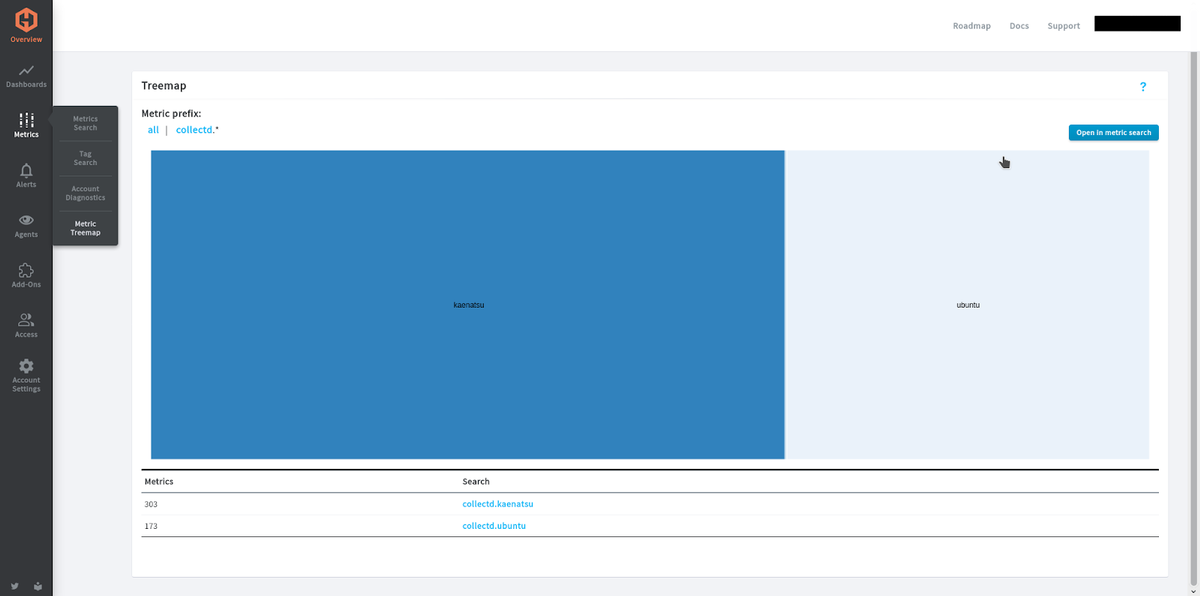
Once the config file is in the correct place like in the image above (refer to the collectd docs to find the default directory for your own OS), the system metrics should start sending to MetricFire. Wait a bit, and then confirm on your MetricFire dashboard that the metrics are being sent. You can confirm by checking your Metric Treemap under the Metrics tab in your dashboard.
Then quickly create a dashboard for your metrics. I made a dashboard that tracks CPU idle, system, and user usage.
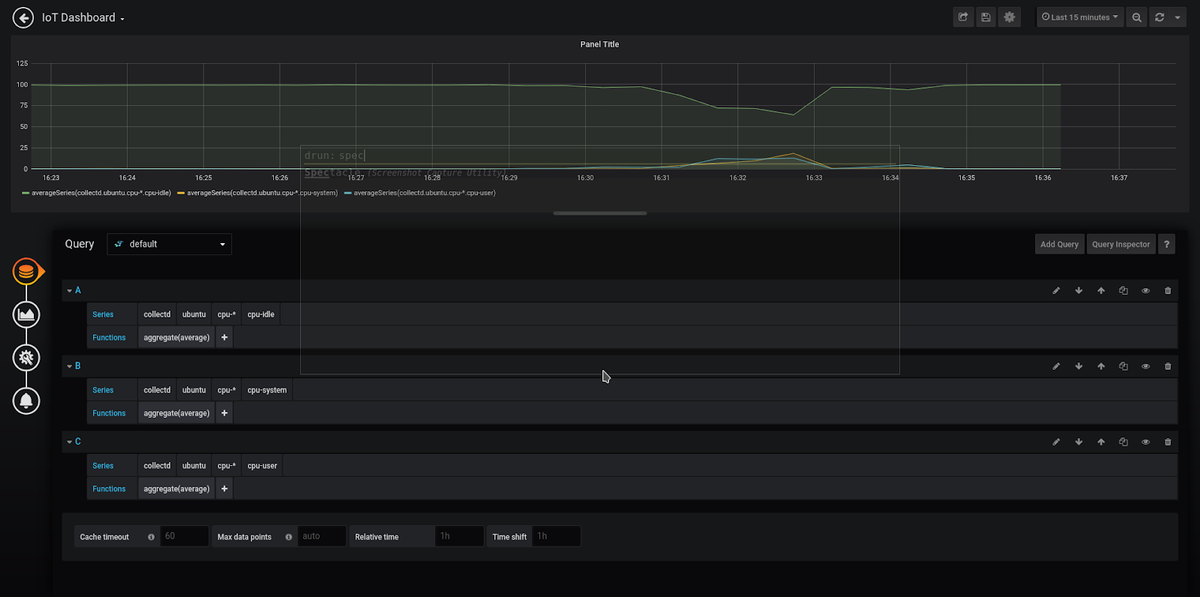
Now we have a system monitor of our Raspberry Pi 4 running Ubuntu Server!
Setting up StatsD on Raspberry Pi
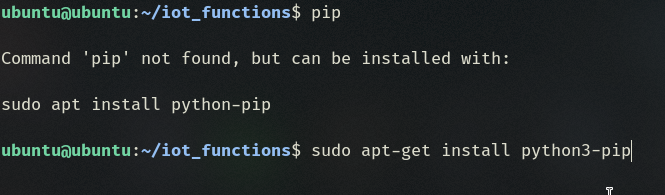
Lastly, every IoT device needs some kind of stats tracker for user usage data, we will use StatsD to do that. In this section, we’ll collect stats on how many times a button is pressed by our Raspberry Pi, and send the stats to MetricFire. Check out our article on setting up StatsD for a more detailed look at how to get StatsD running. For this example I will be using Python, so let’s install pip for Python 3 with:
sudo apt-get install python3-pip
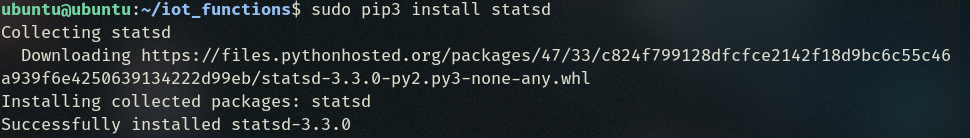
Next, let’s install the statsd package for Python with:
sudo pip3 install statsd
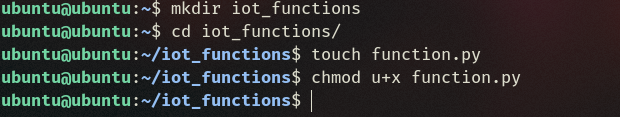
Next, let’s make a directory for our IoT functions and create function.py with executable permissions with:
touch function.py
chmod u+x function.py
We’ll make a simple print function to represent a button being pressed on this Raspberry Pi. Each time we execute the button function, it will indicate the button has been pressed five times. Copy and paste the code into function.py like in the image below, or from the code snippet. This button will have StatsD tracking how many times the button has been pressed.
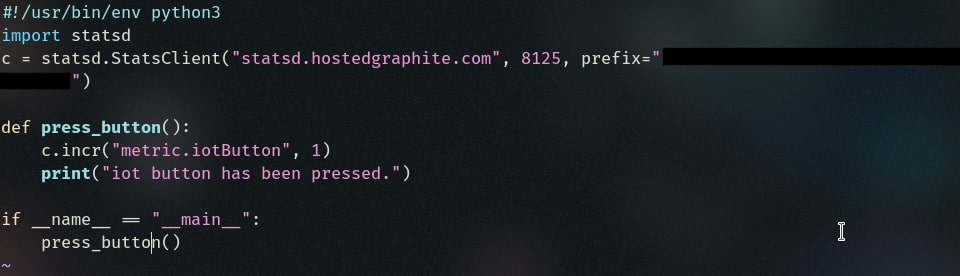
#!/usr/bin/env python3
import statsd
c = statsd.StatsClient("statsd.hostedgraphite.com", PORT_NUMBER, prefix="YOUR_STATSD_KEY")
def press_button():
   c.incr("metric.iotButton", 1)
   print("iot button has been pressed.")
if __name__ == "__main__":
   press_button()
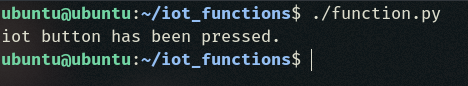
Let’s press that button we just made once.
Wait a bit, and then confirm in your Metric Treemap to see if you see any new counter metrics coming from StatsD.
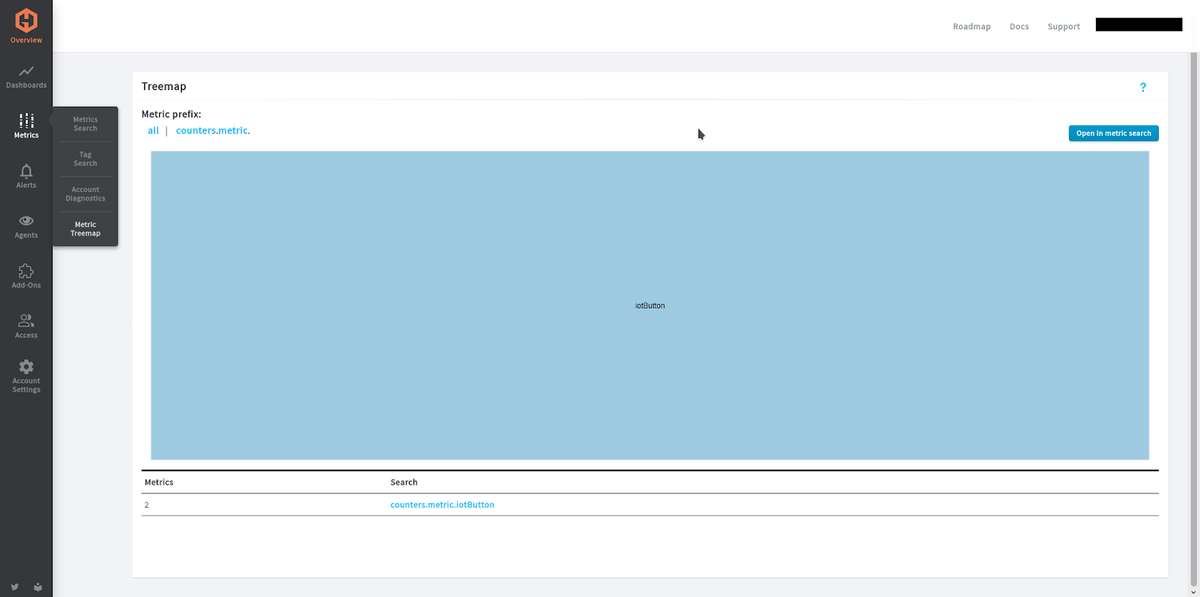
I spammed the button 30+ times to produce the example graph in the image below.

Now we have StatsD set up to track counters, rates, and gauges on any functions that the device has!
Ubuntu Server 19.10 on Raspberry Pi 4 — Housekeeping Tips
If you restart or shut down and there is a desktop environment instead of the terminal, press ctrl-alt-f2 to get back into the terminal. This shouldn’t happen if you have properly updated and upgraded the system.
To safely shutdown, type:
sudo shutdown -h now
To reboot, type:
sudo reboot
To scroll, use:
shift-pageup/pagedown
I hope this guide helps you set up Ubuntu Server (IoT) 19.10 and MetricFire on your Raspberry Pi 4 without much trouble. Having monitoring on your device can greatly help improve your product more efficiently.
If you're interested in trying it out on your own, sign up for the MetricFire free trial. You can monitor your Raspberry Pi without doing any installation for Graphite, Prometheus or Grafana. If you're interested in doing large scale IoT monitoring, book a demo and talk to us directly. We're always happy to get on a call and see how MetricFire can help your company.
Conclusion
In conclusion, we showed how to set up a Raspberry Pi 4 for monitoring using Graphite and Grafana. The tutorial covered the step-by-step process of configuring the device to send metrics, sending metrics to MetricFire through StatsD and Collectd, and visualizing the data on a Grafana dashboard. The article emphasized that the instructions are applicable not only to Raspberry Pi but also to any IoT device running Linux.
The post recommended signing up for the MetricFire free trial to simplify metric visualization and monitoring. MetricFire, a service hosting Graphite and Grafana, was used throughout the tutorial. It highlighted the time-saving benefits of utilizing MetricFire's monitoring system setup and maintenance.
The article showcased the final product, a Grafana dashboard displaying CPU usage/idle metrics and button press counts. It proceeded to explain the process of setting up Collectd to send CPU metrics and StatsD to track button presses. Custom config files from MetricFire were utilized to facilitate the connection between Collectd and MetricFire.
Additional sections provided guidance on setting up the Raspberry Pi for monitoring, including instructions for booting the device with Ubuntu Server, configuring the WiFi network, adjusting the font size, and performing system updates and upgrades.
The tutorial also covered the steps for sending files, specifically the custom Collectd config file from MetricFire, to the Raspberry Pi using SCP. It detailed the installation of Collectd on the Raspberry Pi, enabling it as a daemon, and configuring it with the custom config file.
Lastly, the article explained how to set up StatsD on the Raspberry Pi to track button presses. It demonstrated the installation of Python's pip and the statsd package and provided a sample code snippet for tracking button presses and sending the data to MetricFire.
The blog post concluded with housekeeping tips for managing Ubuntu Server 19.10 on Raspberry Pi 4, such as safely shutting down or rebooting the device and navigating the terminal.
Overall, the guide aimed to assist readers in effectively setting up monitoring for their IoT devices using Raspberry Pi and Linux, while highlighting the convenience and benefits of utilizing MetricFire's monitoring platform.