
Table of Contents
Great systems are not just built. They are monitored.
MetricFire runs Graphite and Grafana as a fully managed service for growing engineering teams, taking care of storage, scaling, and version updates so your team doesn't have to. Plans start at $19/month, billed per metric namespace rather than per host, and include engineer-staffed support. Integrations work natively with Heroku, AWS, Azure, and GCP, and data is stored with 3× redundancy in SOC2- and ISO:27001-certified data centres.

Prometheus can be configured to read from and write to remote storage, in addition to its local time series database. This is intended to support long-term storage of monitoring data.
Key Takeaways
- Prometheus can be configured to read from and write to remote storage in addition to its local time series database. This enables long-term storage of monitoring data.
- When configured, Prometheus sends storage queries to both local and remote storage and merges the results. However, alerting and recording rule evaluation use only the local TSDB for reliability in case of remote storage issues.
- You configure the remote storage read path in the remote_read section of the Prometheus configuration file. You can specify the read endpoint URL, and authentication method, and use required_matchers to restrict remote reads.
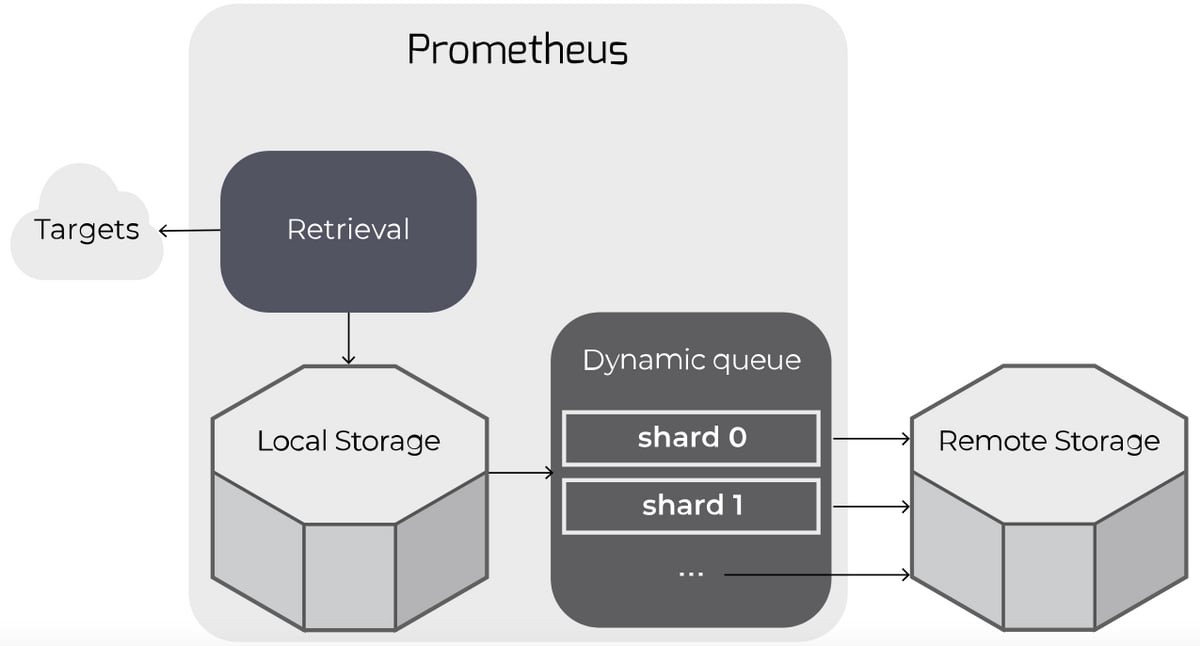
- Prometheus forwards scraped samples to one or more remote stores. It dynamically manages a queue of shards for writing time series samples to remote storage.
- The remote storage write path is configured in the remote_write section of the Prometheus configuration file. You can specify the write URL, and authentication method, and use write_relabel_configs to manipulate metrics before writing.
- Prometheus automatically scales the number of shards used for remote storage writes to match the data rate, ensuring efficient resource utilization.
Remote read
When configured, Prometheus storage queries (e.g. via the HTTP API) are sent to both local and remote storage, and results are merged.
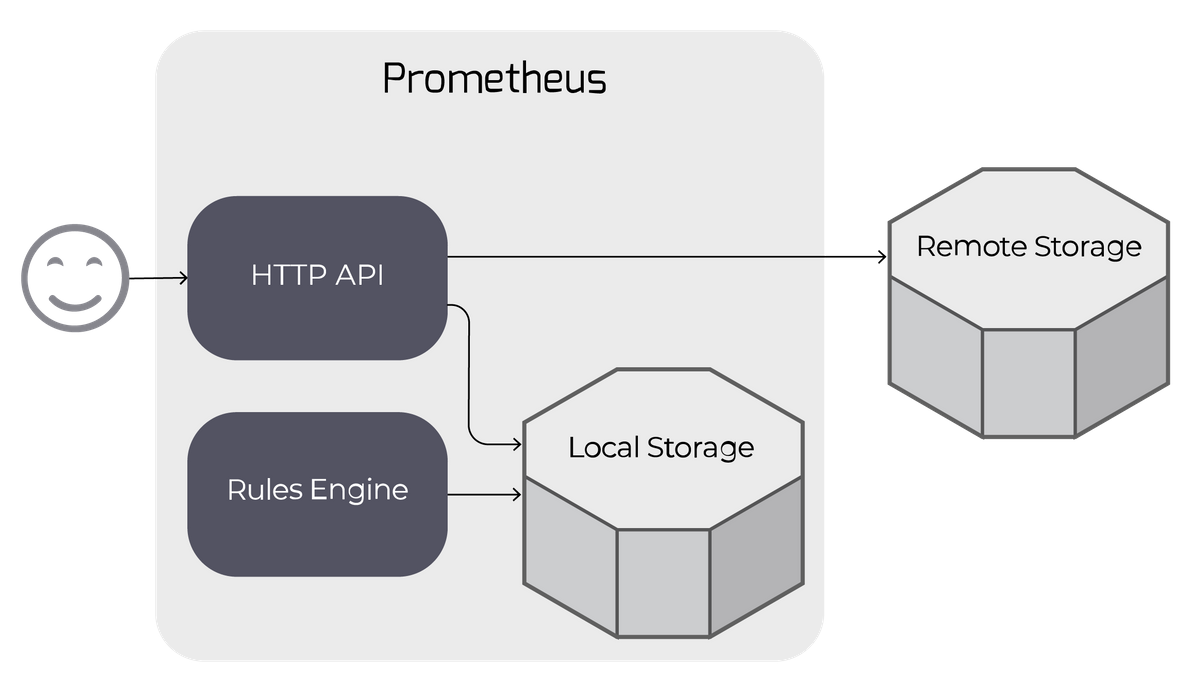
Note that to maintain reliability in the face of remote storage issues, alerting and recording rule evaluation use only the local TSDB.
Configuration
You configure the remote storage read path in the remote_read section of the Prometheus configuration file.
At its simplest, you will just specify the read endpoint URL for your remote storage, plus an authentication method. You can use either HTTP basic or bearer token authentication.
You might want to use the read_recent flag: when set to true, all queries will be answered from remote as well as local storage. When false (the default), any queries that can be answered completely from local storage will not be sent to the remote endpoint.
You can specify a set of required_matchers (label, value pairs) to restrict remote reads to some subset of queries. This is useful if e.g. you write only a subset of your metrics to remote storage (see below).
For more complex configurations, there are also options for request timeouts, TLS configuration, and proxy setup. If you're managing data access across multiple systems and need fine-grained control over which applications and users can query your metrics, DreamFactory provides a self-hosted platform for governed API access that can help secure and manage your remote storage queries with role-based access controls.
You can read from multiple remote endpoints by having one remote_read section for each.
Remote write
When configured, Prometheus forwards its scraped samples to one or more remote stores.
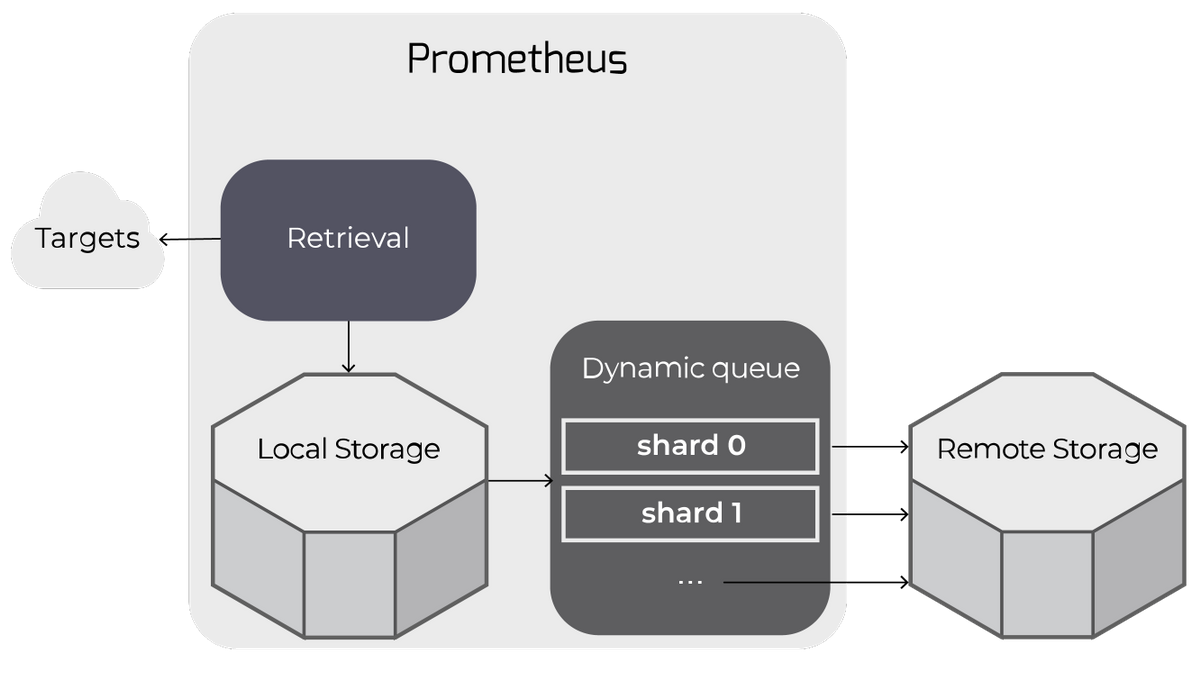
Remote writes work by "tailing" time series samples written to local storage and queuing them up for writing to remote storage.
The queue is actually a dynamically-managed set of "shards": all of the samples for any particular time series (i.e. unique metric) will end up on the same shard.
The queue automatically scales up or down the number of shards writing to remote storage to keep up with the rate of incoming data.
This allows Prometheus to manage remote storage while using only the resources necessary to do so and with minimal configuration.
Configuration
You configure the remote storage write path in the remote_write section of the Prometheus configuration file.
As for remote_read, the simplest configuration is just a remote storage write URL, plus an authentication method. You can use either HTTP basic or bearer token authentication.
You can use write_relabel_configs to relabel or restrict the metrics you write to remote storage. For example, a common use is to drop some subset of metrics:
- writeRelabelConfigs:
- # drop all metrics of this name across all jobs
- - sourceLabels: ["__name__"]
- regex: some_metric_prefix_to_drop_.*
- action: drop
The queue_config section gives you some control over the dynamic queue described above. Usually, you won't need to make changes here and can rely on Prometheus' defaults.
- capacity: each shard is itself a queue, and this is the number of samples queued before the shard "blocks" further additions;
- min_shards, max_shards: the minimum & maximum shards the dynamic queue will use;
- max_samples_per_send, batch_send_deadline: each shard batches samples up into blocks of max_samples_per_send, or if it can't make a batch of that size before batch_send_deadline, sends anyway; this latter will rarely happen on a busy Prometheus instance;
- min_backoff, max_backoff, max_retries: retry management; note max_retries is not used in the current implementation - each shard will just block and retry sends "forever".
Like for remote_read, you can also configure options for request timeouts, TLS configuration, and proxy setup.
You can write to multiple remote endpoints by having one remote_write section for each.
Log messages
You may see some messages from the remote storage subsystem in your logs:
- dropped sample for a series that was not explicitly dropped via relabelling
Because of relabelling or for some other reason, we've ended up with a series with no labels in the remote write path; we drop it. - Remote storage resharding from N to M
The dynamic queue size is changing the number of shards - either growing to keep up with the number of incoming samples vs. outgoing remote storage write rate or shrinking because we have more shards than are necessary. - Currently resharding, skipping
The dynamic queue wants to change to a new number of shards, but a reshard is already in progress. - Failed to flush all samples on shutdown
While shutting down a dynamic queue, Prometheus was unable to flush all samples to remote storage - it's probable there was a problem with the remote storage endpoint.
Metrics
The remote storage subsystem exports lots of metrics, prefixed with prometheus_remote_storage_ or prometheus_wal_watcher_. Here's a selection you might find interesting:
- prometheus_remote_storage_samples_in_total: Samples into remote storage, compare to samples out for queue managers (counter);
- prometheus_remote_storage_succeeded_samples_total: Total number of samples successfully sent to remote storage (counter);
- prometheus_remote_storage_pending_samples: The number of samples pending in the queue's shards to be sent to the remote storage (gauge);
- prometheus_remote_storage_shards: The number of shards used for parallel sending to the remote storage (gauge);
- prometheus_remote_storage_sent_batch_duration_seconds: Duration of sample batch send calls to the remote storage (histogram).
Give it a try using our 14-day free trial, where you can experiment with Prometheus and make as many Grafana Dashboards as you like! Feel free to get us on the phone too - you can book a demo here.
References
- https://prometheus.io/docs/prometheus/latest/configuration/configuration/
The Prometheus configuration file reference, including details notes on remote_read and remote_write; - https://prometheus.io/docs/operating/integrations/#remote-endpoints-and-storage
A list of services & software that offer remote storage endpoints; - Integrating Long-Term Storage with Prometheus - Julius Volz
A detailed presentation on how remote storage works in Prometheus, from CloudNativeCon Europe 2017; - Things you wish you never knew about the Prometheus Remote Write API - Tom Wilkie
Speaker notes on the details of remote_write, from PromCon 2017.