
Great systems are not just built. They are monitored.
MetricFire runs Graphite and Grafana as a fully managed service for growing engineering teams, taking care of storage, scaling, and version updates so your team doesn't have to. Plans start at $19/month, billed per metric namespace rather than per host, and include engineer-staffed support. Integrations work natively with Heroku, AWS, Azure, and GCP, and data is stored with 3× redundancy in SOC2- and ISO:27001-certified data centres.
MetricFireのHostedGraphite(通称HG)は、一連のオープンソース監視ツールから完全なインフラストラクチャおよびアプリケーション監視プラットフォームを提供します。 設定に応じて、Hosted Graphiteをセットアップし、必要なすべてのメトリックを美しいGrafanaダッシュボードにリアルタイムで表示できます。
HostedGraphiteは、アプリケーションに関する大量のデータを簡単に測定、分析、および視覚化できるようにするさまざまなツール、アドオン、およびプラグインを提供します。
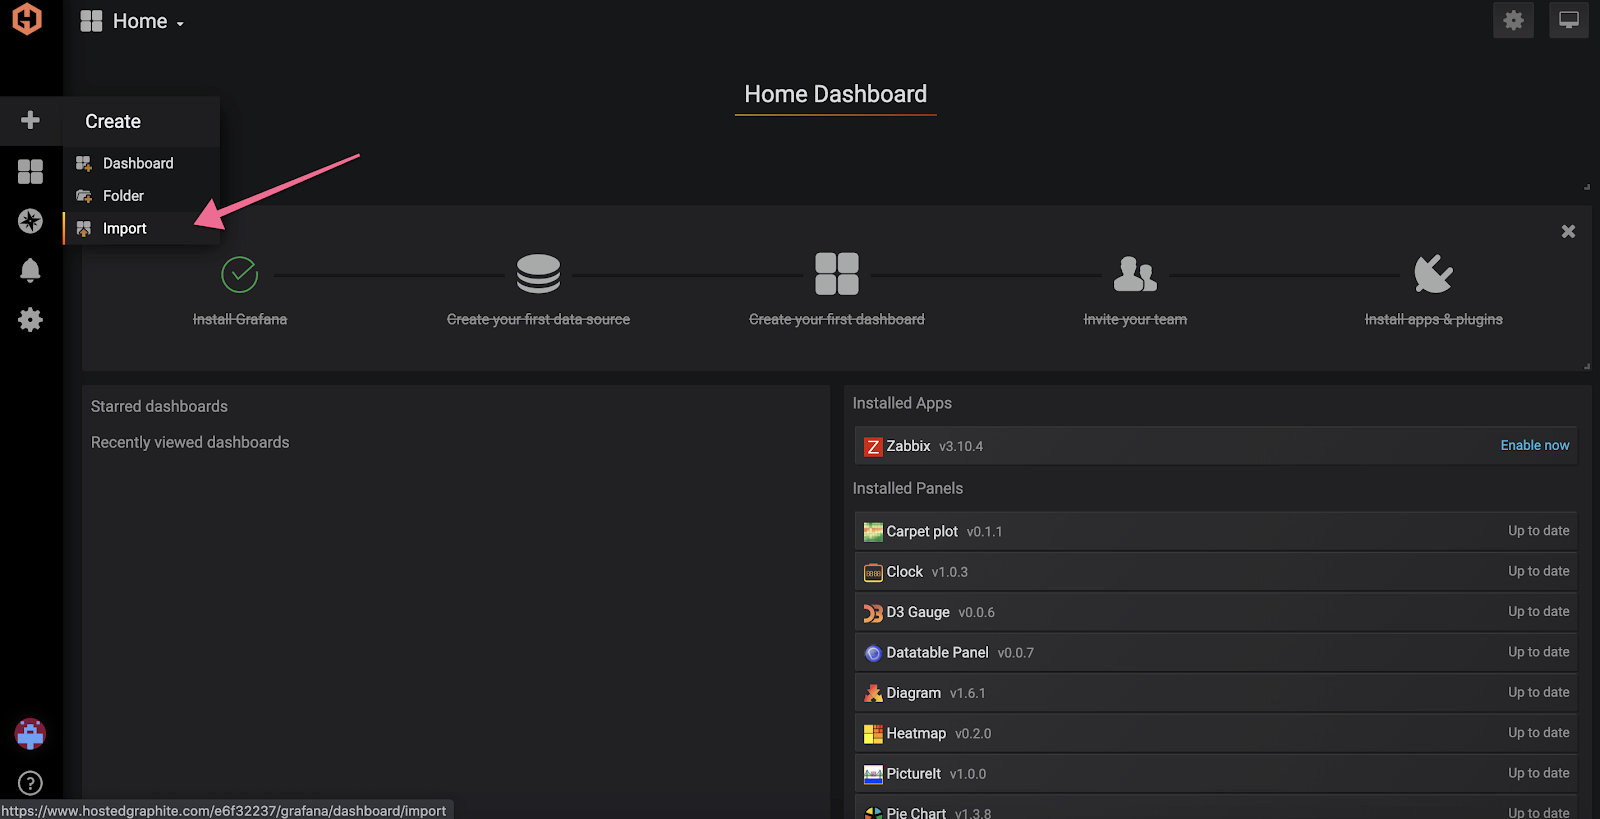
HG Heroku Monitoring&DashboardsアドオンをHerokuアプリにインストールし、プラットフォームアドオンヘッド内でダッシュボードに移動して、[Import Dashboard]を選択します。
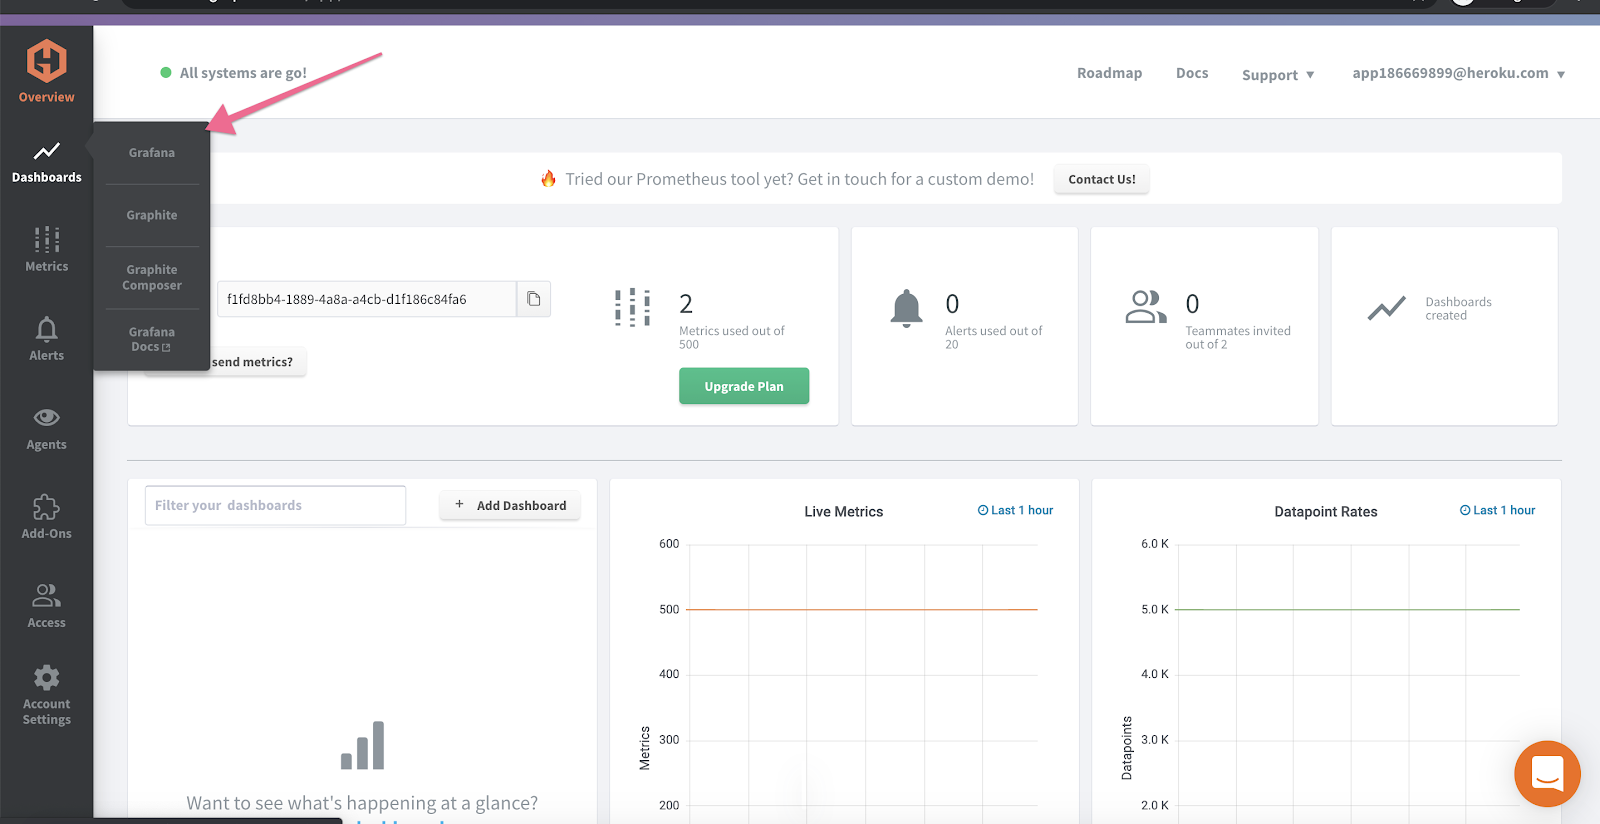
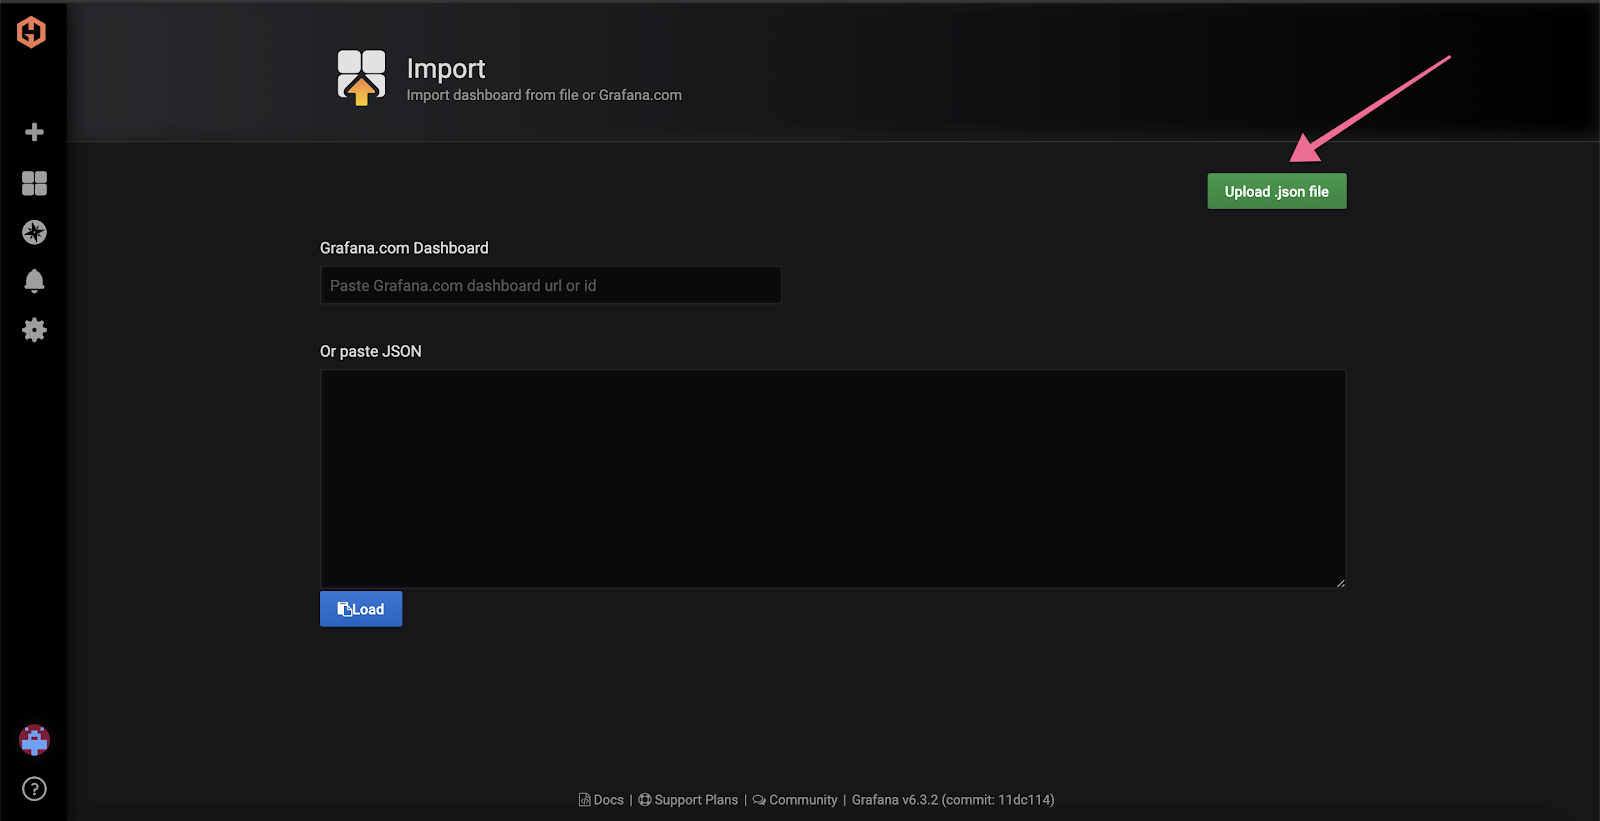
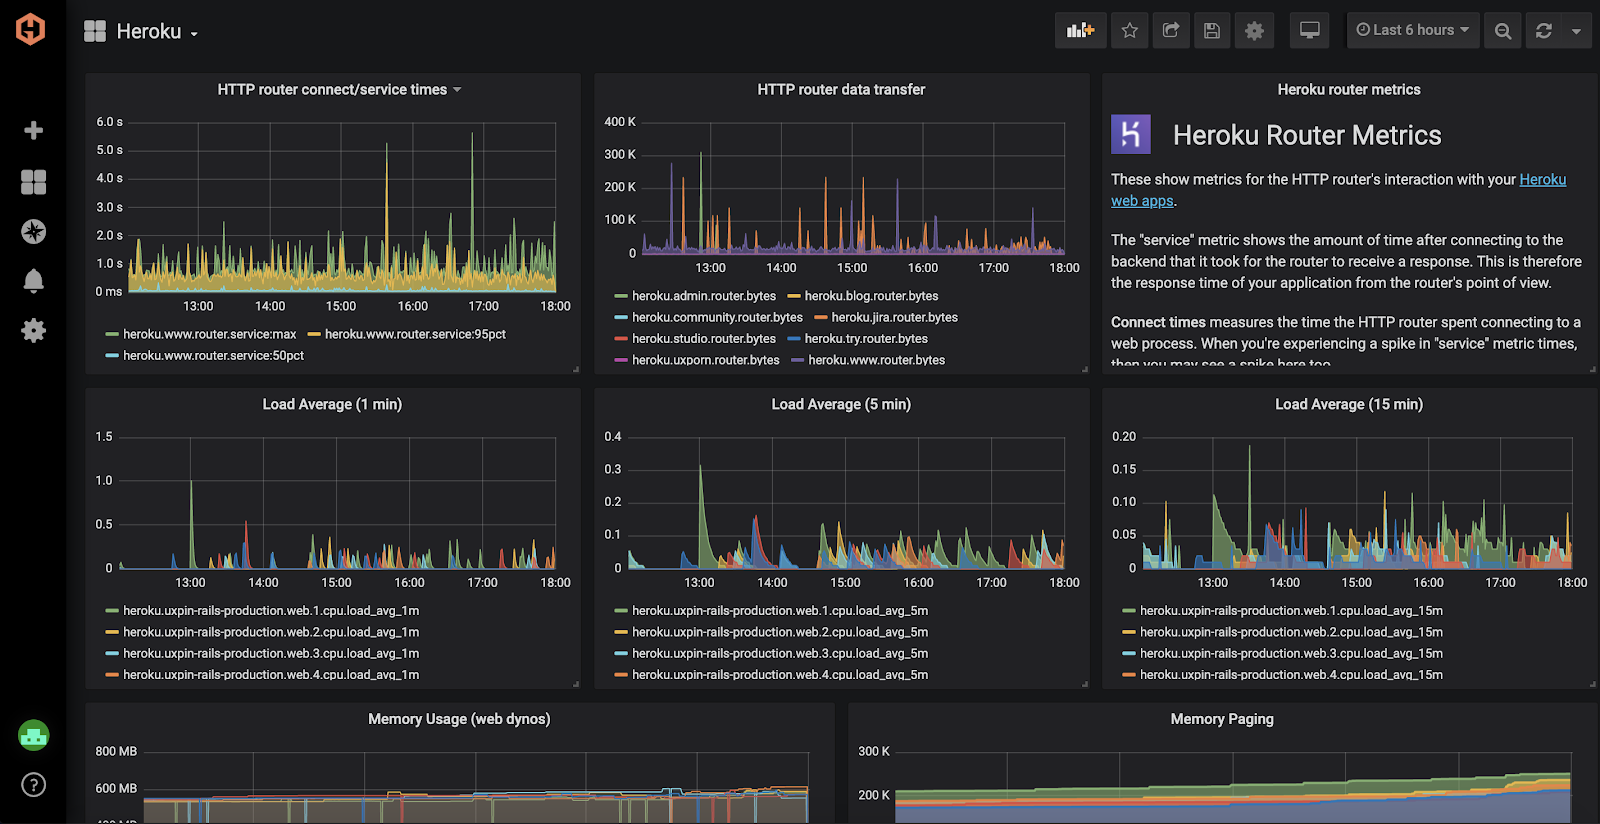
次に、このjsonファイルをダウンロードして、ダッシュボードにインポートします。 Herokuモニタリングダッシュボードがすぐに読み込まれるはずです。
このアドオンをHerokuアプリで使用する方法について詳しく知りたい場合は、エンジニアの1人と一緒にデモを予約してください。