
Table of Contents
Great systems are not just built. They are monitored.
MetricFire runs Graphite and Grafana as a fully managed service for growing engineering teams, taking care of storage, scaling, and version updates so your team doesn't have to. Plans start at $19/month, billed per metric namespace rather than per host, and include engineer-staffed support. Integrations work natively with Heroku, AWS, Azure, and GCP, and data is stored with 3× redundancy in SOC2- and ISO:27001-certified data centres.
Introduction
Your website is the face of your business - it should urge the customer to buy your product.
Knowing this, you spend weeks on a great web design and user experience. But that’s only the visible part, what about your site’s infrastructure?
In order to make your website as optimized as possible, you need metrics about everything such as customer behavior, load speeds, proxy request counts, load balancers, and more. You even need to know how your site is working in different parts of the world.
Traefik is becoming a very popular reverse proxy and load balancer, and developers are commonly deploying Traefik alongside Kubernetes and Docker. When it comes to metrics monitoring, most are opting to do it with Prometheus.
This article will show an example of how to monitor your Traefik installation with Prometheus, and we'll use a simple flask app to demonstrate metrics monitoring from Taefik in Prometheus.
MetricFire is a Hosted Graphite service, and you can use MetricFire’s free trial to try out your Traefik monitoring right away. If you would like to talk to us directly about monitoring at your organization, please book a demo and we’ll get on a call with you ASAP!
The main software used in this article
In order to understand the material more quickly, let's look at tools:
- Grafana allows users to create dashboards with panels displaying certain indicators over a set period of time. Each dashboard is quite versatile, so you can customize it for a specific project.
- Prometheus is a free software application that extracts and stores metrics for a specified time period.
- Traefik is a proxy server that takes all requests from a web server and forwards them to another resource.
- Docker is a software to automate the deployment and management of applications in containerized environments. It is used to manage the individual containers (services) that an application is composed of.
Environment adjustments
All installations and configurations were produced on Ubuntu 18.04 LTS.
First of all, we have to update the local database of software to make sure we have access to the latest revisions.
Open a terminal window by typing the following command:
sudo apt-get update
Make sure the package is installed. The package manager apt might ask you to confirm the installation of packages, in some cases.
Setup Docker and Docker Compose
Write in the terminal the following command to set up Docker:
sudo apt-get install docker.io
To check a successful installation of Docker:
docker --version
Docker compose is used to manage multiple containers that are part of an application. Below, you can see a command to install docker-compose.
sudo apt-get install docker-compose
To check a successful installation of docker-compose:
docker-compose -version
Setup and configure Traefik proxy
The role of a Traefik is to analyze applications (containers). It collects information about incoming and outgoing application requests. To be able to do that, we have to install and configure this tool.
After installation, there will be a file called docker-compose.yml on our working directory, and you can see the set instructions displayed in figure 3.1 below.
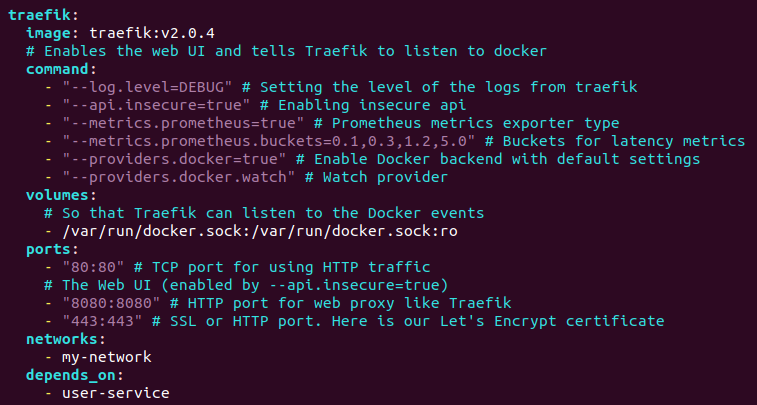
Figure 3.1 一 Traefik configurations
The configurations in the image above allow us to gather metrics from the application user service. The User-service is a simple Flask-based application that serves as an example in this article and is where we collect the metrics from. This application is located at port 5000. To build and run our containers, we have to write in CLI the following command:
sudo docker-compose up -d
Open up the Traefik dashboard and have a look at http://0.0.0.0:8080. The Traefik dashboard represents info statistics about routes and services. You can see the Traefik dashboard in Figure 3.3 below.

Figure 3.3 一 Traefik dashboard
If we go to routes in the HTTP menu, we will see the status of our containers. See detailed info in Figure 3.4.

Figure 3.4 一 Containers information
Our containers are deployed and the next step is to deploy a pull-model monitoring tool to serve and analyze our metrics. One of the most well-known tools is Prometheus.
Configure Prometheus
To install Prometheus you need to follow several steps that are listed here, or in the Prometheus docs.
Before Prometheus starts pulling the data, it is necessary to indicate where it will be pulled from. So we need to specify a target. A target is an endpoint that Prometheus listens to for metrics.
So let’s configure a target for listening. All necessary settings for the endpoint can be seen in figure 3.5 below.
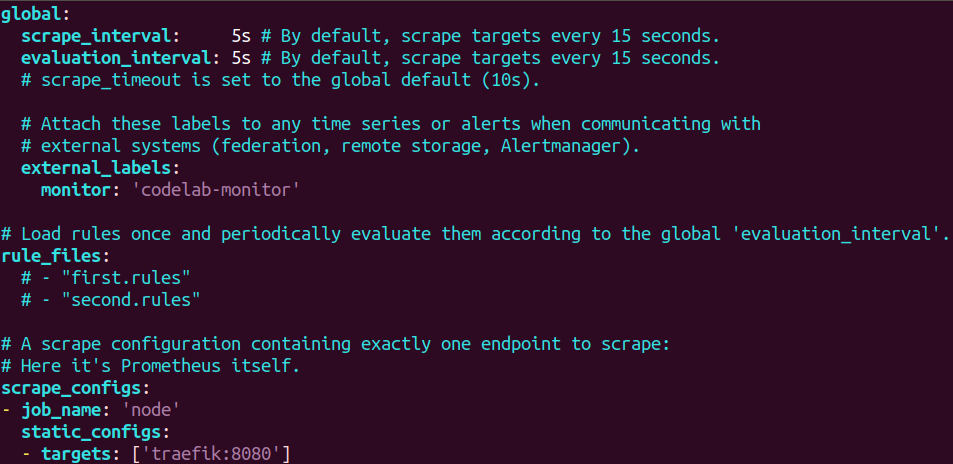
Figure 3.5 一 Endpoint configuration
As you can see, the main target to listen to is a Traefik, which is located at 8080 port. The next step is to set the configuration for Prometheus inside a docker-compose file, which you can see in the image below.

Figure 3.6 一 Prometheus settings
And now we have all the necessary configurations. Let’s try to rebuild and up docker-compose to run all containers. Write in CLI the following command:
docker-compose up -d
After the successful deployment of our containers let’s see what happens. Open up a Prometheus dashboard http://0.0.0.0:9090/targets. In figure 3.7 we can see a dashboard, which tells us that Prometheus is scraping Traefik.
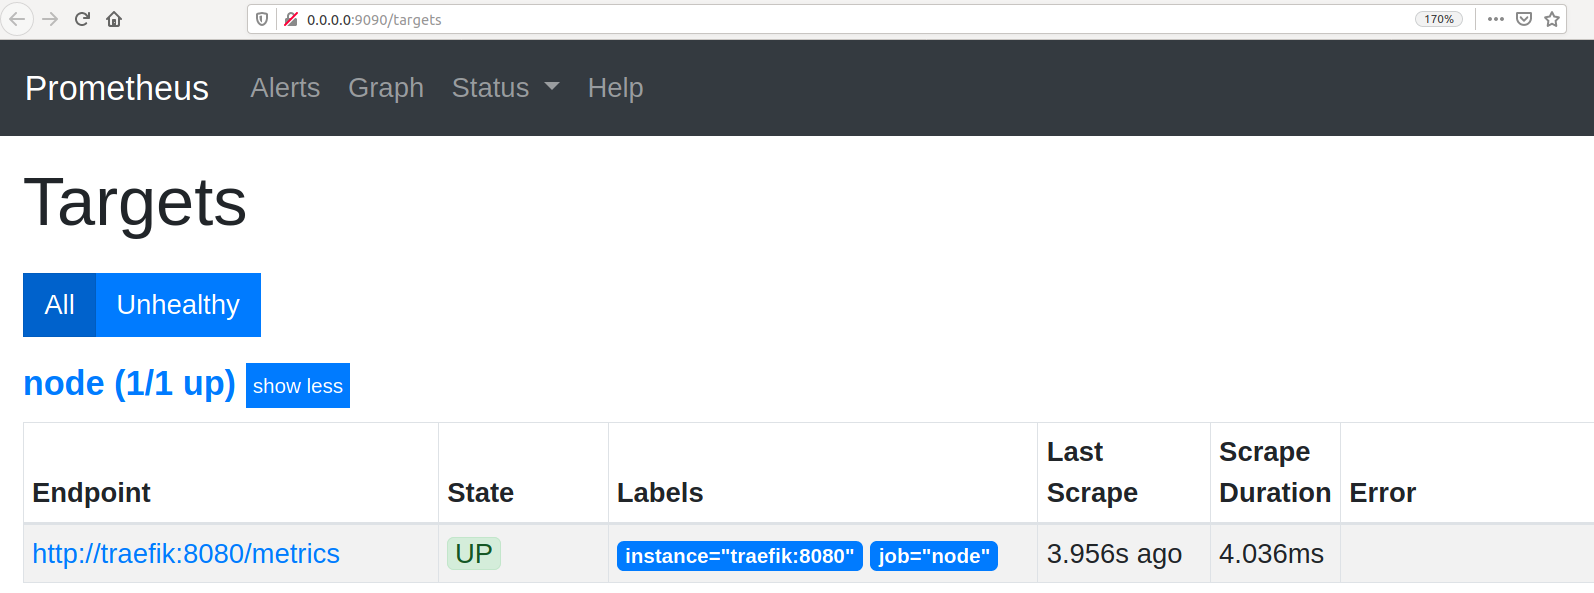
Figure 3.7 一 Status Traefik in Prometheus dashboard
Finally, take a look at what is going on on the Traefik dashboard.
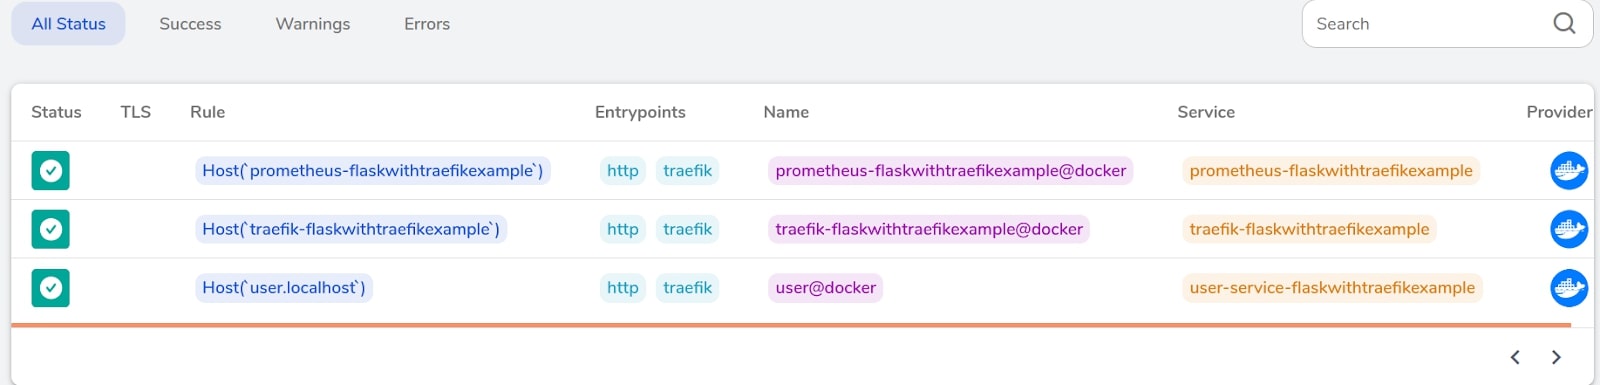
Figure 3.8 一 Status of all deployed containers on Traefik dashboard
As we can see all containers have a positive status. Traefik analyzes data from a test application and Prometheus checks and pulls those data from Traefik.
Site monitoring metrics
Of course, there is always a long list of all metrics which we want to monitor. Here are some of the key ones:
- Total requests
- Average response time
- Total memory
Queries per second is a common measure of the amount of search traffic that an information retrieval system, such as a search engine or a database, receives in one second.
The average response time directly depends on several factors. This metric allows you to see connection times in different regions or countries of the world. Tracking this metric is relevant under heavy loads.
Total memory allows us to monitor the memory of the operating system allocated for code execution. In this way, we can track code optimization on the server side.
And now, we have a Traefik proxy to analyze and intercept all information from the test application. Speaking with Docker API, Traefik takes information from available containers and prepares data for Prometheus in a friendly format.
Then, the Prometheus server queries the list of data sources from Traefik, scrapes the data, and stores the metrics in its own database. Ultimately, Prometheus is not intended as a dashboarding solution - it is a great and sophisticated time-series database.
Prometheus needs to be hooked up with Grafana to generate dashboards. And finally, Grafana takes metrics from Prometheus and displays them on the dashboard in real time.
At MetricFire, Prometheus and Grafana always come together in one packaged service. Use Grafana dashboards with Prometheus directly on our platform! You should book a demo to get a free trial.
Example of Grafana dashboards
Grafana is a universal visualization tool since it is compatible with hundreds of other tools, data sources, databases, or notification systems. One such tool is Prometheus.
Grafana can take all metrics that are stored in Prometheus. Using the following metrics we built a dashboard, which you can see below in Figure 5.1.:
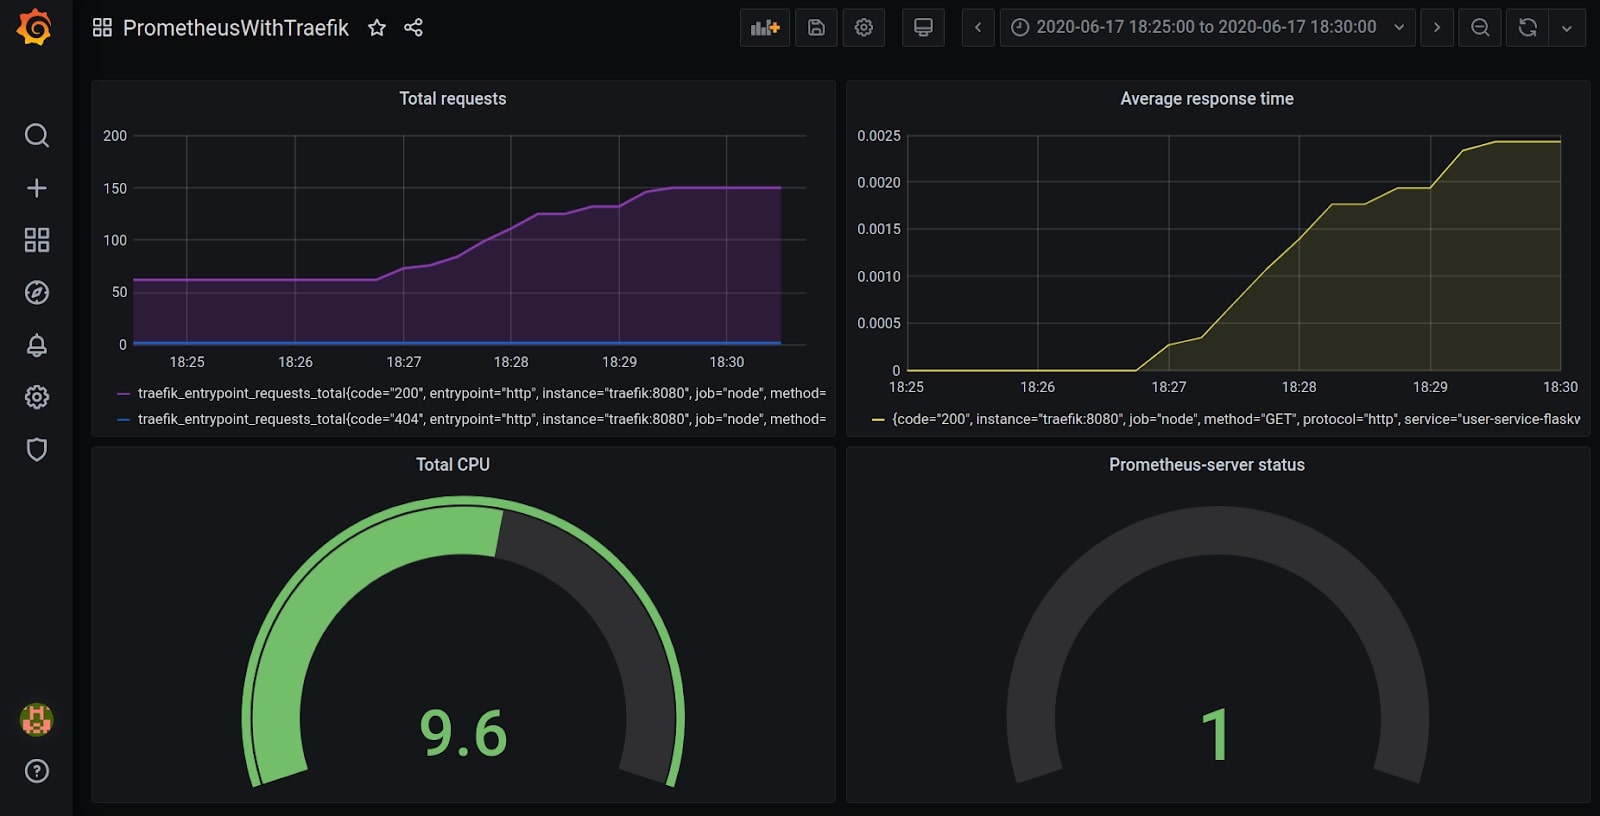
Figure 5.1 一 Example of grafana dashboard
traefik_entrypoint_requests_total - it’s a metric for monitoring total requests
traefik_service_request_duration_seconds_sum - it’s a metric to see time request, which depends on total CPU and total requests per second
process_cpu_seconds_total - it’s a metric to see the amount of memory that has been used from the moment the server is up and running
As you can see in the figure above, we have ensured the communication of Grafana and Prometheus with each other. After making a couple of requests to test the application, Prometheus immediately picks up data from Traefik and sends it to Grafana. This data is visualized above in the Grafana dashboard.
Grafana also has built-in support for cloud monitoring vendors like Google Stackdriver, Amazon Cloudwatch, Microsoft Azure, and SQL databases like MySQL and Postgres. MetricFire runs a Hosted Grafana service as well that serves customers looking to pull in metrics from other data sources.
Conclusion
Monitoring site metrics is a necessary task. We can use these metrics to make data-drive decisions about the site and our business. Nowadays, the Internet is constantly changing. We have to be prepared for those changes. Thanks to these indicators we can improve the stability and performance of our sites.
MetricFire specializes in monitoring systems and you can use MetricFire with minimal configuration to gain in-depth insight into your environments. If you would like to learn more about it please book a demo with us, or sign on to the free trial today.


