
Table of Contents
Great systems are not just built. They are monitored.
MetricFire runs Graphite and Grafana as a fully managed service for growing engineering teams, taking care of storage, scaling, and version updates so your team doesn't have to. Plans start at $19/month, billed per metric namespace rather than per host, and include engineer-staffed support. Integrations work natively with Heroku, AWS, Azure, and GCP, and data is stored with 3× redundancy in SOC2- and ISO:27001-certified data centres.
Introduction
Loki is a powerful, scalable log aggregation system designed by Grafana to efficiently collect, store, and query logs. It’s often deployed alongside Prometheus as part of modern observability stacks. Loki’s design emphasizes cost-effective storage by indexing only metadata, which makes it a great choice for high-volume environments.
But while Loki excels at log ingestion and indexing, many teams overlook the critical task of monitoring Loki itself. Without visibility into Loki’s own performance, things like ingestion rate, query latency, cache efficiency, and resource utilization, make it difficult to detect bottlenecks or prevent outages before they impact users.
In this article, we'll detail how to use the Telegraf agent to collect, convert, and forward Loki performance metrics to a FREE data source.
Getting Started with the Telegraf Agent
Telegraf is a plugin-driven server agent built on InfluxDB that collects and sends metrics/events from databases, systems, processes, devices, and applications. It is written in Go, compiles into a single binary with no external dependencies, and requires a minimal memory footprint. Telegraf is compatible with many operating systems and has many helpful output plugins and input plugins for collecting and forwarding a wide variety of system performance metrics.
Installing and configuring Telegraf is easy, but we simplified this process further with our HG-CLI tool. Install the tool on any OS, run it in TUI mode, and enter your Hosted Graphite API key to get Telegraf up and running quickly!
- Install the HG-CLI tool:
curl -s "https://www.hostedgraphite.com/scripts/hg-cli/installer/" | sudo sh
- Run it in TUI mode:
hg-cli tui
Otherwise, you can configure a different telegraf output to forward metrics to another data source.
Install and Configure Loki (Linux)
Download Loki version 2.9.4, which is a recent and stable release:
sudo wget https://github.com/grafana/loki/releases/download/v2.9.4/loki-linux-amd64.zip -O /usr/local/bin/loki.zip
Extract the package using the unzip utility, and prepare the binary:
cd /usr/local/bin

sudo unzip loki.zip
sudo mv loki-linux-amd64 loki
sudo chmod +x loki
Configure Loki with basic settings to tell Loki how to ingest, store, and serve logs. Just create a new file for this at /etc/loki/loki-config.yaml:
auth_enabled: false

server:
  http_listen_port: 3100

ingester:
  lifecycler:
    ring:
      kvstore:
        store: inmemory
      replication_factor: 1

schema_config:
  configs:
    - from: 2024-01-01
      store: boltdb-shipper
      object_store: filesystem
      schema: v13
      index:
        prefix: index_
        period: 24h

storage_config:
  boltdb_shipper:
    active_index_directory: /tmp/loki/index
    cache_location: /tmp/loki/cache
    cache_ttl: 24h
  filesystem:
    directory: /tmp/loki/chunks

limits_config:
  max_entries_limit_per_query: 5000

table_manager:
  retention_deletes_enabled: true
  retention_period: 24h

compactor:
  working_directory: /tmp/loki/compactor
Save the config file and create the following data directories. These directories match the paths in the config and Loki won’t create missing directories on startup, so this is a required step:
sudo mkdir -p /tmp/loki/index /tmp/loki/cache /tmp/loki/chunks /tmp/loki/compactor
sudo chown -R root:root /tmp/loki
Run and Test Loki
Run Loki manually and inspect the output for any errors:
sudo /usr/local/bin/loki -config.file=/etc/loki/loki-config.yaml
In another terminal window, confirm that Loki is healthy:
curl -s http://localhost:3100/ready
Confirm that the /metrics endpoint is returning metrics:
curl -s http://localhost:3100/metrics | head -n 25
Alternatively, you can create a systemd config for Loki, so it always runs in the background on startup. But for this example, you can just leave it running and continue with the next steps in another terminal window.
Test Loki by running this ingestor stress loop in your terminal:
while true; do
  ts=$(($(date +%s%N)))
  log="Stress log $(date) $(shuf -i 1-1000000 -n 1)"
  curl -s -XPOST "http://localhost:3100/loki/api/v1/push" -H "Content-Type: application/json" \
    -d '{"streams":[{"stream":{"job":"loki","level":"info"},"values":[["'"$ts"'", "'"$log"'"]]}]}' > /dev/null
  sleep 0.005
done
Configure Telegraf's Prometheus Input Plugin
Telegraf has many input plugins that can collect a wide range of data from many popular technologies and 3rd party sources. For this example, Loki is publishing metrics to http://localhost:3100/metrics. These hold a Prometheus format and must be converted to a Graphite format as they are forwarded to the Hosted Graphite datasource (which was configured in the earlier steps).
First, open your Telegraf configuration file (generally located at /etc/telegraf/telegraf.conf), and add the following section:
[[inputs.prometheus]]
  urls = ["http://localhost:3100/metrics"]
  metric_version = 2
  name_prefix = "loki-performance."
Then save your changes and run the telegraf daemon using the below command. This will help you see if there are any configuration errors in the output:
telegraf --config /etc/telegraf/telegraf.conf
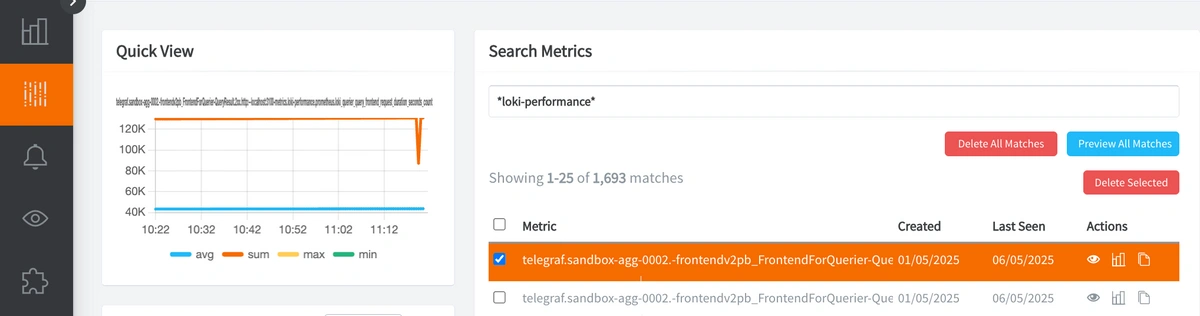
Now, Telegraf will be scraping the local /metrics endpoint and forwarding these metrics to your Hosted Graphite account. You can locate these metrics in the app Metrics UI (with the *loki-performance* prefix):
See the official GitHub repository for additional details and configuration options for the Prometheus input plugin.
Use MetricFire to Create Custom Dashboards and Alerts
MetricFire is a monitoring platform that enables you to gather, visualize and analyze metrics and data from servers, databases, networks, processes, devices, and applications. Using MetricFire, you can effortlessly identify problems and optimize resources within your infrastructure. Hosted Graphite by MetricFire removes the burden of self-hosting your monitoring solution, allowing you more time and freedom to work on your most important tasks.
Once you have signed up for a Hosted Graphite account and used the above steps to configure your server(s) with the Telegraf Agent, metrics will be forwarded, timestamped, and aggregated into the Hosted Graphite backend.
-
Metrics will be sent and stored in the Graphite format of: metric.name.path <numeric-value> <unix-timestamp>
-
The dot notation format provides a tree-like data structure, making it efficient to query
-
Metrics are stored in your Hosted Graphite account for two years, and you can use them to create custom Alerts and Grafana dashboards.
Build Custom Dashboards in Hosted Grafana
In the Hosted Graphite UI, navigate to Dashboards and select + New Dashboard to create a new visualization.
Then go into Edit mode and use the Query UI to select a graphite metric path (the default data source will be the HostedGraphite backend if you are accessing Grafana via your HG account).
The HG datasource also supports wildcard (*) searching to grab all metrics that match a specified path.
Now you can apply Graphite functions to these metrics like aliasByNode() to clean up the metric names, and exclude() to omit specified patterns:
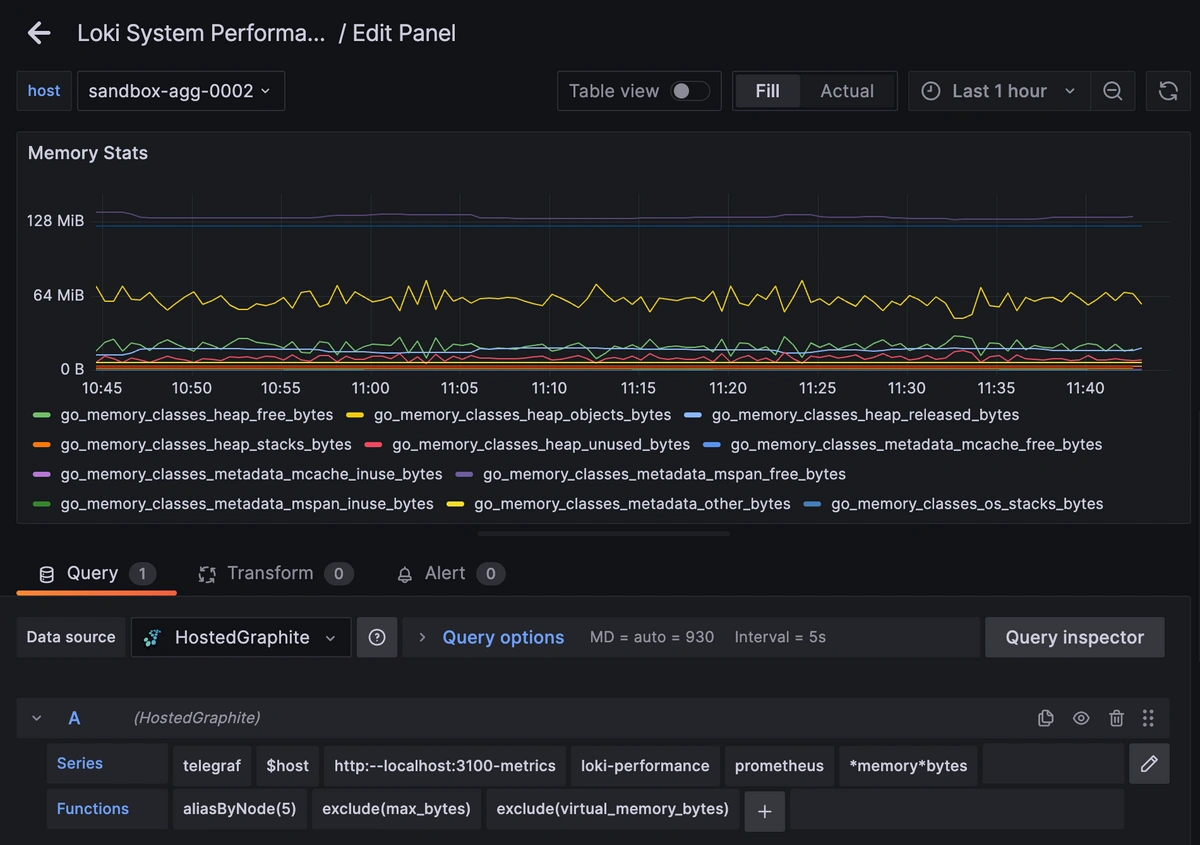
Grafana has many additional options to apply different visualizations, modify the display, set units of measurement, and some more advanced features like configuring dashboard variables and event annotations.
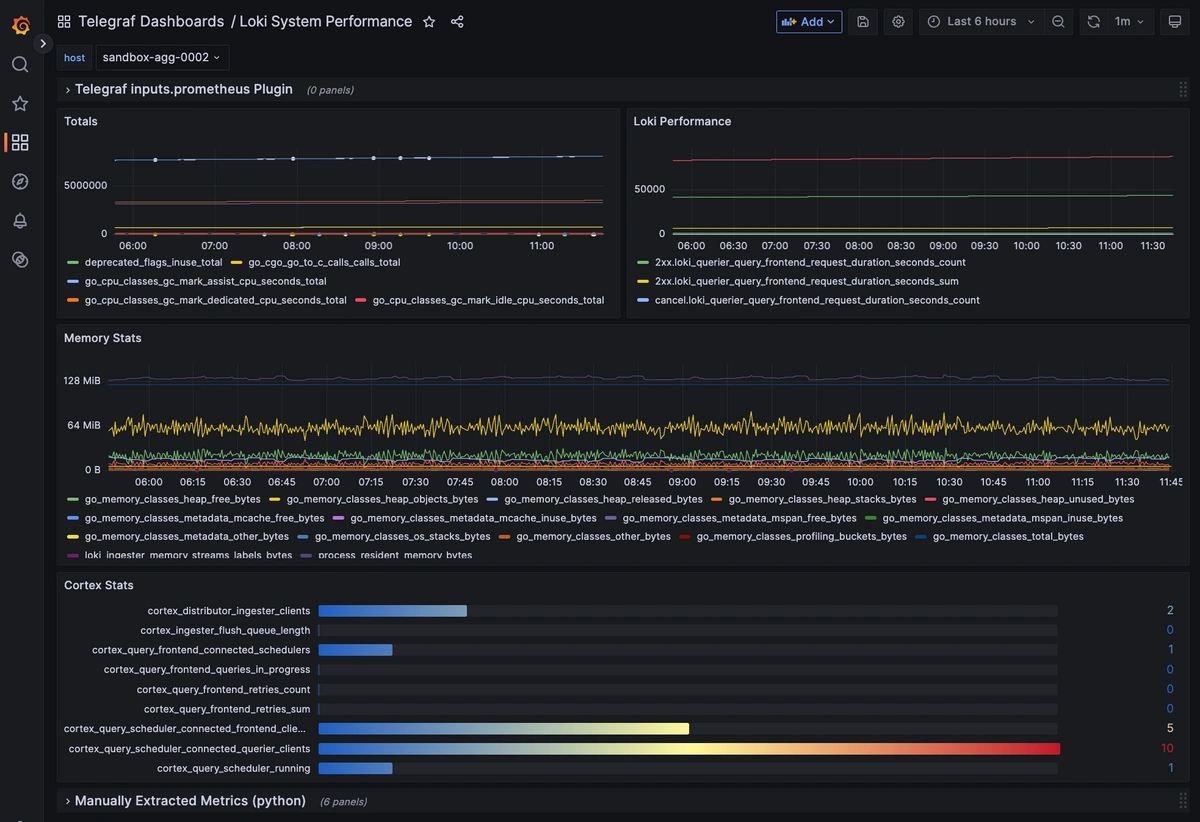
This is what a production-level Loki Performance dashboard might look like:
Create Graphite Alerts
In the Hosted Graphite UI, navigate to Alerts => Graphite Alerts to create a new alert. Name the alert, add a query to the alerting metric field, and add an description of what this alert is (optional).
Then, select the Alert Criteria tab to set a value threshold and select a notification channel. The default notification channel will be the email you used to sign up for the Hosted Graphite account. However, you can easily configure channels for Slack, PagerDuty, Microsoft Teams, OpsGenie, custom webhooks, and more. This way you can receive a notification any time your metric values are outside of their expected bounds.
Please see the Hosted Graphite docs for more details on Alerts and Notification Channels.
Conclusion
By combining Loki’s native /metrics endpoint with Telegraf’s Prometheus input plugin, you can build a complete Loki monitoring solution without needing a complicated Prometheus setup. This will give you real-time visibility into Loki’s ingestion rate, query latency, cache efficiency, and memory usage. This approach also scales well from development environments to production, and can be easily extended using Hosted Graphite's built-in alerting and visualization tools.
Sign up for the free trial and begin monitoring your infrastructure today. You can also book a demo and talk to the MetricFire team directly about your monitoring needs.

