
Table of Contents
Great systems are not just built. They are monitored.
MetricFire runs Graphite and Grafana as a fully managed service for growing engineering teams, taking care of storage, scaling, and version updates so your team doesn't have to. Plans start at $19/month, billed per metric namespace rather than per host, and include engineer-staffed support. Integrations work natively with Heroku, AWS, Azure, and GCP, and data is stored with 3× redundancy in SOC2- and ISO:27001-certified data centres.

What is Grafana?
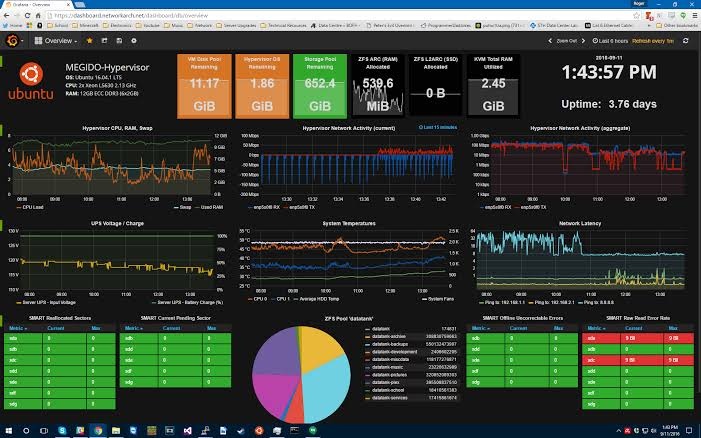
Grafana is a visualization tool that allows you to see and analyze all your metrics in one unified dashboard. Grafana can pull metrics from any source, such as Graphite and Prometheus, display that data, and then enable you to annotate and understand the data directly in the dashboard. Grafana dashboards are designed to allow you to visualize information in a ton of ways, from histograms and heatmaps to world maps. Grafana also has an alerting feature that can communicate with you through Slack, PagerDuty, and more. Dashboards can be shared, downloaded, or expanded with hundreds of plugins that make analysis easier. For teams managing multiple data sources and requiring governed API access to backend systems, DreamFactory provides a self-hosted platform that can complement your Grafana setup by offering secure, role-based data access to any enterprise data source. Grafana is open source, and Grafana as a Service is available through MetricFire.
Get on our free trial and start to make Grafana dashboards in minutes. You can see if Grafana is the right fit for you. If you have any questions you can book a demo and talk to us directly.
Key Takeaways
- Grafana is a versatile visualization tool for metrics, supporting various sources and alerting via Slack and PagerDuty. It's open source and available through MetricFire.
- AppDynamics is an app performance monitoring tool with features like Business iQ, end-user monitoring, and infrastructure monitoring. It's priced starting at $3,300 USD per year.
- Use Grafana when you need customizable dashboards, multiple data source consolidation, easy queries, or alerts.
- Choose AppDynamics for app performance monitoring, optimization, anomaly detection, and cost analysis.
- Grafana is open source and free, while AppDynamics has a cost associated with it.
What is AppDynamics?
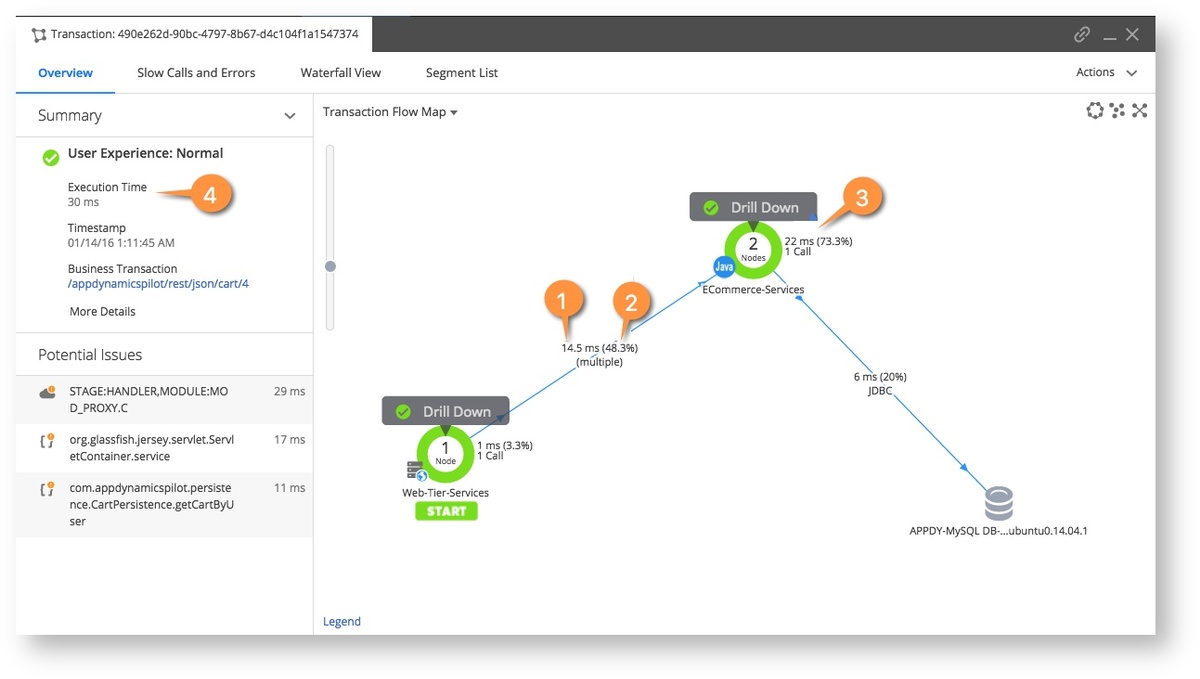
AppDynamics is an application performance monitoring tool designed to provide real-time detection of anomalies. It can be applied for both cloud or server-based apps, and can also be used to see how an app’s performance affects business metrics. AppDynamic’s feature called Business iQ allows you to correlate app performance, user experience, and business outcomes. AppDynamic’s end-user monitoring tool allows teams to see a connection between front-end and back-end performance monitoring. Infrastructure Monitoring allows for visibility into how the infrastructure impacts the app performance. AppDynamic is a proprietary service with three stages of pricing. The first stage is only app performance monitoring, the second stage is full-stack visibility, and the third stage brings in Business iQ.
When to use Grafana?
Use Grafana when you …
- need beautiful, simple, annotated graphs.
- have multiple sources of metrics or logs and need to see them in one place.
- need to share your dashboards across the organization.
- need to reorganize information based on specific team needs.
- need an easy-to-use query builder.
- need alerting for events.
When to use AppDynamics?
Use AppDynamics when you …
- have an app that needs to be monitored.
- are looking for ways to optimize your app.
- want to know where the anomalies in your app are.
- want to identify which anomalies affect user experience.
- want to be able to trace how much anomalies are costing.
Pricing comparison
- Grafana is open source, and free.
- Business-ready Grafana as a Service by MetricFire, including hosted Graphite and Graphite, starts at 99 USD a month.
- AppDynamics has a starting price of 3300 USD per year.
Key Insights
- Grafana can integrate with a huge range of collectors, agents, and storage engines.
- Grafana is open source, and free.
- AppDynamics is meant for businesses that are defined by their app services.
Get to know our Hosted Graphite better, and check out how Metricfire can fit into your monitoring environment! Get a free trial and start making Grafana dashboards right away. Feel free to book a demo if you have questions about what Grafana can do for you.


