
Table of Contents
Great systems are not just built. They are monitored.
MetricFire runs Graphite and Grafana as a fully managed service for growing engineering teams, taking care of storage, scaling, and version updates so your team doesn't have to. Plans start at $19/month, billed per metric namespace rather than per host, and include engineer-staffed support. Integrations work natively with Heroku, AWS, Azure, and GCP, and data is stored with 3× redundancy in SOC2- and ISO:27001-certified data centres.
What is Grafana?
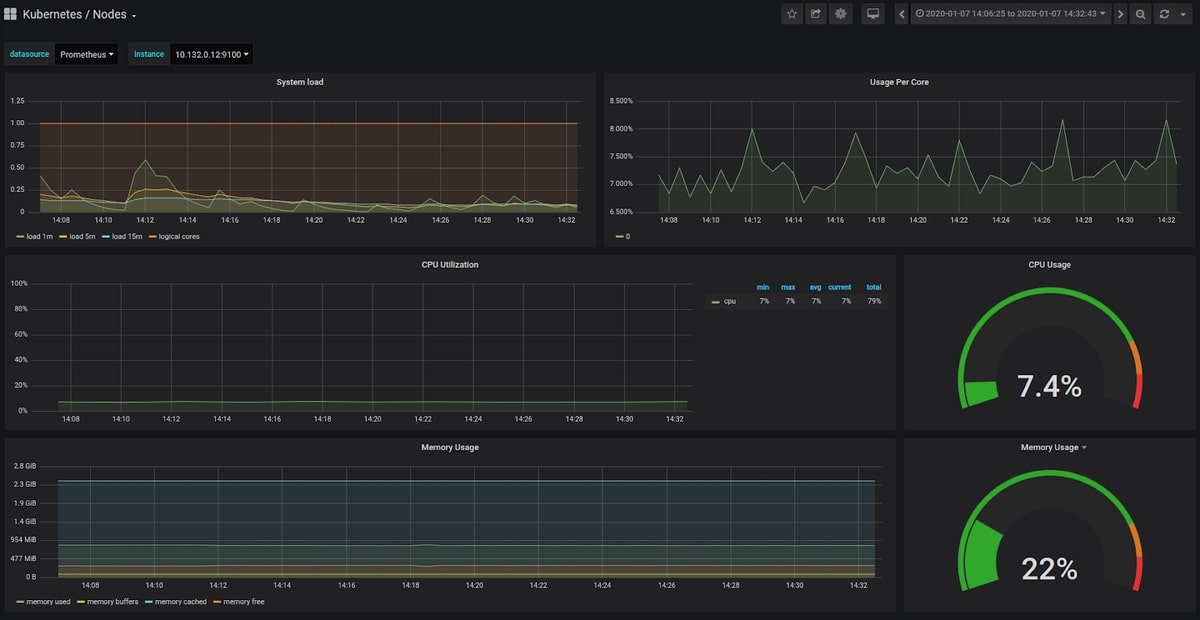
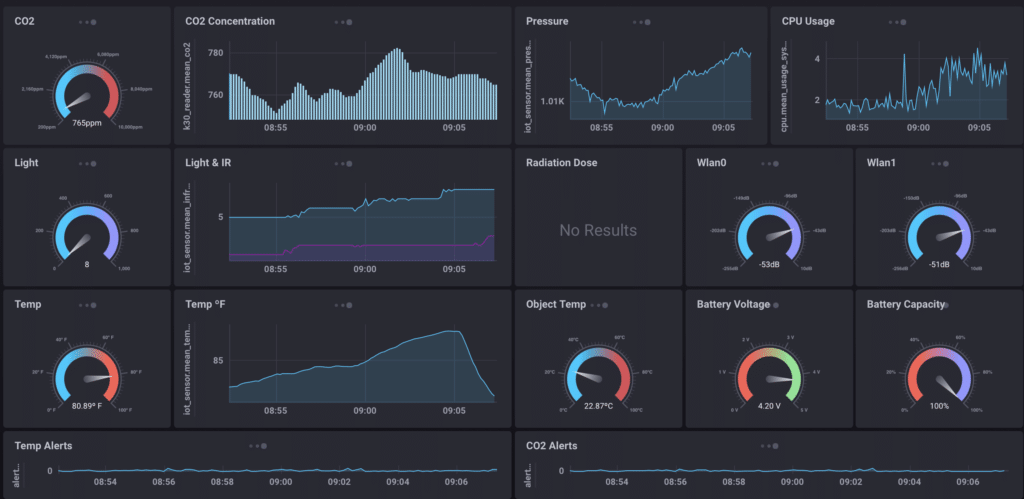
Grafana is a visualization tool that allows you to see and analyze all of your metrics in one unified dashboard. Grafana can pull metrics from any source, such as Graphite and Prometheus, display that data, then enable you to annotate and understand the data directly in the dashboard. Grafana dashboards are designed to allow you to visualize information in a ton of ways, from histograms and heatmaps, to world maps. Grafana also has an alerting feature that can communicate with you through Slack, PagerDuty and more. Dashboards can be shared, downloaded or expanded with hundreds of plugins that make analysis easier. Grafana is open source, and Grafana is available through MetricFire.
We have a lot resources on Grafana in the MetricFire blog. Our most popular articles are Our Favorite Grafana Dashboards, Using Grafana with Elasticsearch, and Datasources in Grafana.
Check out our free trial and start to make Grafana dashboards in minutes. You can see if Grafana is the right fit for you - if you have any questions you can book a demo and talk to us directly.
What is Chronograf?
Chronograf is the user interface and complete dashboarding tool for InfluxDB 1.x. InfluxDB is an open source time series database written in Go. InfluxDB is optimized for operations monitoring, application monitoring, IOT and other real-time analytics. Chronograf is almost always used as apart of Influx’s TICK stack (Telegraf, InfluxDB, Chronograf, Kapacitor). Chronograf allows you to query, and visualize data with dashboards. Chronograf is also the administration tool for the InfluxDB deployments, as well as the interface for Kapacitor. All alerting process are facilitated through Chronograf, but processed by Kapacitor. Chronograf comes with 22 ready-made dashboards to make sure you can set up fast. Chronograf is offered as open source, as well as a hosted version through InfluxDB cloud.
When to use Grafana?
Use Grafana when you …
- need beautiful, simple, annotated graphs.
- have multiple sources of metrics or logs and need to see them in one place.
- need to share your dashboards across the organization.
- need to reorganize information based on specific team needs.
- need an easy to use query builder.
- need alerting for events.
MetricFire offers a complete infrastructure and application monitoring platform which helps customers collect, store and visualize time series data from any source - including Grafana. Explore the MetricFire free trial or book a demo today.
When to use Chronograf?
Use Chronograf when you …
- you have an InfluxDB database.
- you are using a TICK stack by InfluxData.
- you are working in Go and React.
Pricing comparison
- Grafana is open source, and free.
- Business-ready Grafana by Metricfire, including hosted Graphite and Prometheus services, starts at 99 USD a month. Take a look at the MetricFire free trial or book a demo.
- Chronograf is open source, and free.
- You can get a hosted version of Chronograf through InfluxDB Cloud. InfluxDB Cloud has a usage-based plan, starting at 50 USD per month for a single user monitoring a few machines.
Key takeaways
- Grafana is used with a huge range of collectors, agents and storage engines.
- Chronograf is used with only InfluxData products.
- Both Grafana and Chronograf are open source with comparably priced hosted products.
Get to know our Grafana as a Service better, and check out how MetricFire can fit into your monitoring environment! Book a free trial and start making Grafana dashboards right away. Feel free to book a demo if you have questions about what Grafana can do for you!


