
Table of Contents
Great systems are not just built. They are monitored.
MetricFire runs Graphite and Grafana as a fully managed service for growing engineering teams, taking care of storage, scaling, and version updates so your team doesn't have to. Plans start at $19/month, billed per metric namespace rather than per host, and include engineer-staffed support. Integrations work natively with Heroku, AWS, Azure, and GCP, and data is stored with 3× redundancy in SOC2- and ISO:27001-certified data centres.
Introduction
The Graphite graphing and monitoring tool is open-source software for monitoring time-series data, and it can be installed on any system, from cheap hardware to the cloud. Graphite collects time series data from infrastructure, servers, networks, and applications, and then provides the Graphite graphing UI for analyzing the data. Graphite has been around since 2008, and it has been continuously developing over the past 12 years.
Graphite’s open-source community has 5000 Stargazers and 300 contributors. Graphite is also used as a part of the famous Grafana lab’s enterprise offering as the key data source for their Grafana dashboards.
MetricFire is a Hosted Graphite service that allows users to use Graphite without any of the installation and setup. At MetricFire, Graphite is hosted in a web app, so all users need to do is send metrics, then the metrics are visualized directly in Graphite and Grafana. MetricFire’s users can query, visualize, and alert all directly in the platform with both Grafana and Graphite.
Try out Graphite with MetricFire’s free trial and start monitoring your time-series information. You can also book a demo and talk to the MetricFire team directly about how to best apply Graphite at your company.
Key Takeaways
- Graphite is an open-source tool for monitoring time-series data.
- Graphite collects and analyzes data from infrastructure, servers, networks, and applications.
- The Graphite monitoring stack includes components like Carbon, Whisper, and the Graphite Web UI.
- While the Graphite Web UI is useful for graphing metrics, many users prefer combining Graphite with Grafana for better long-term monitoring.
- Graphite monitoring is versatile and can be used for server, network, and application monitoring, among other purposes.
What is Graphite graphing and monitoring?
Graphite is an open-source monitoring tool made up of several components that need to be installed and configured separately. Each plays a specific role and can be interchanged with other technology if the developer prefers a different tool.
The typical Graphite monitoring stack is set up with these components:
- Carbon: This is a service that receives time-series data and relays it to Whisper and the Graphite Web UI.
- Whisper: a simple database for storing time-series data.
- Graphite Web UI: the interface that graphs the time-series data and interacts with the metrics in the system.
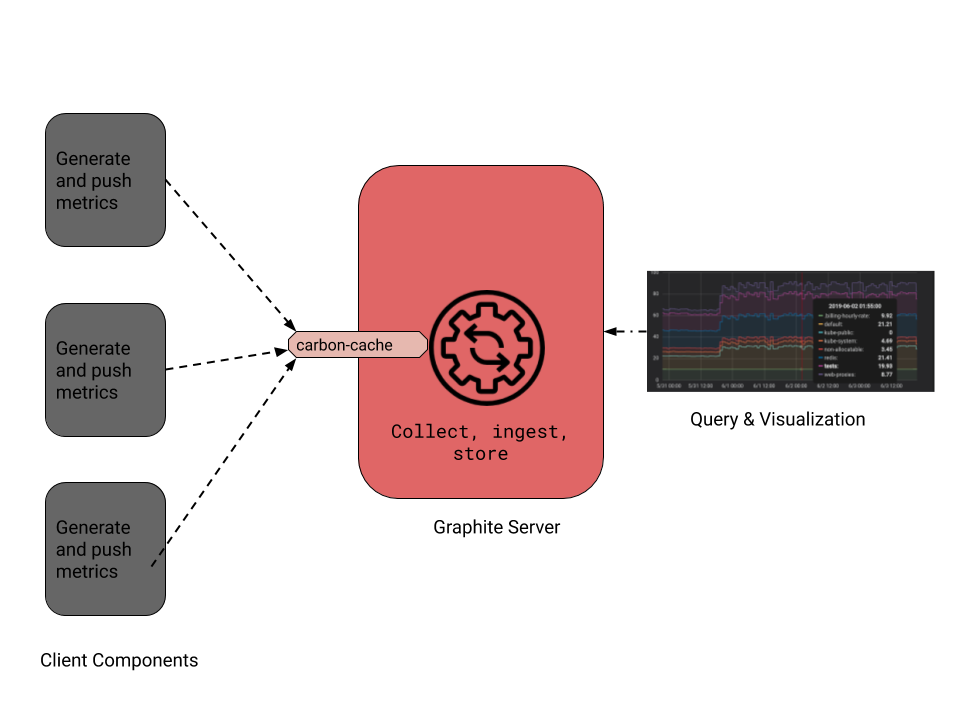
Below is a basic diagram showing how the Graphite architecture is laid out. You can see at the heart of the diagram the Graphite Server, which refers to Carbon, Whisper, Carbon Relay, Carbon Cache, Carbonate, and other components that can be installed from the Graphite-project on Github. Then on the left, are the clients pushing metrics to Carbon, and on the right is the visualization tool.
Graphite requires that the clients being monitored push metrics to the Carbon relay. This means that you have to configure your system to send metrics to Graphite in order for it to collect the information. This is usually done with either StatsD or collectd. These tools collect data and send it over to Graphite, but they each do it in a different way. Check out our resource on comparing StatsD and collectd for further information on how they’re used. For organizations managing complex data flows, Integrate.io offers low-code data integration and transformation pipelines that can complement your Graphite setup by ensuring your time-series data flows smoothly across your infrastructure.
For a more in-depth analysis of Graphite architecture, take a look at our article called Graphite: Architecture and Concepts. There is also a great resource on the installation and Setup of Graphite on the MetricFire blog.
The Graphite Web UI
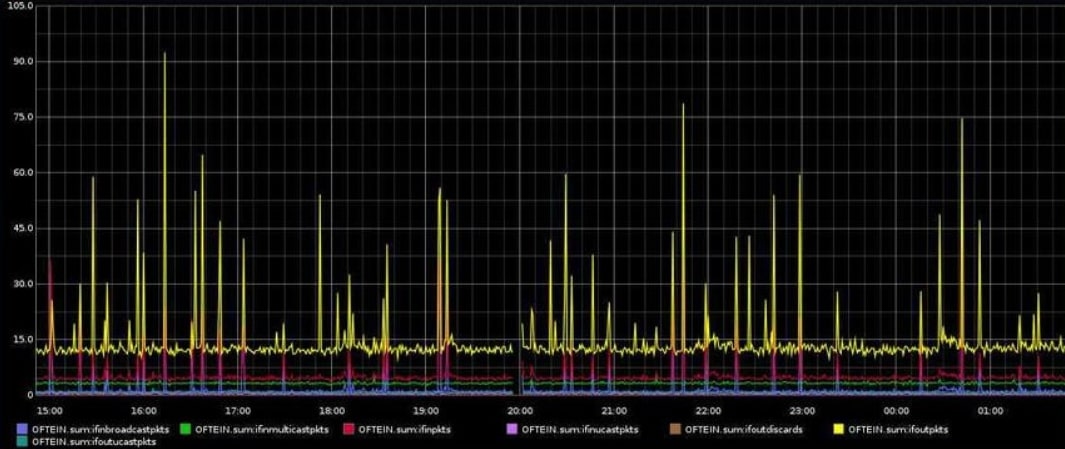
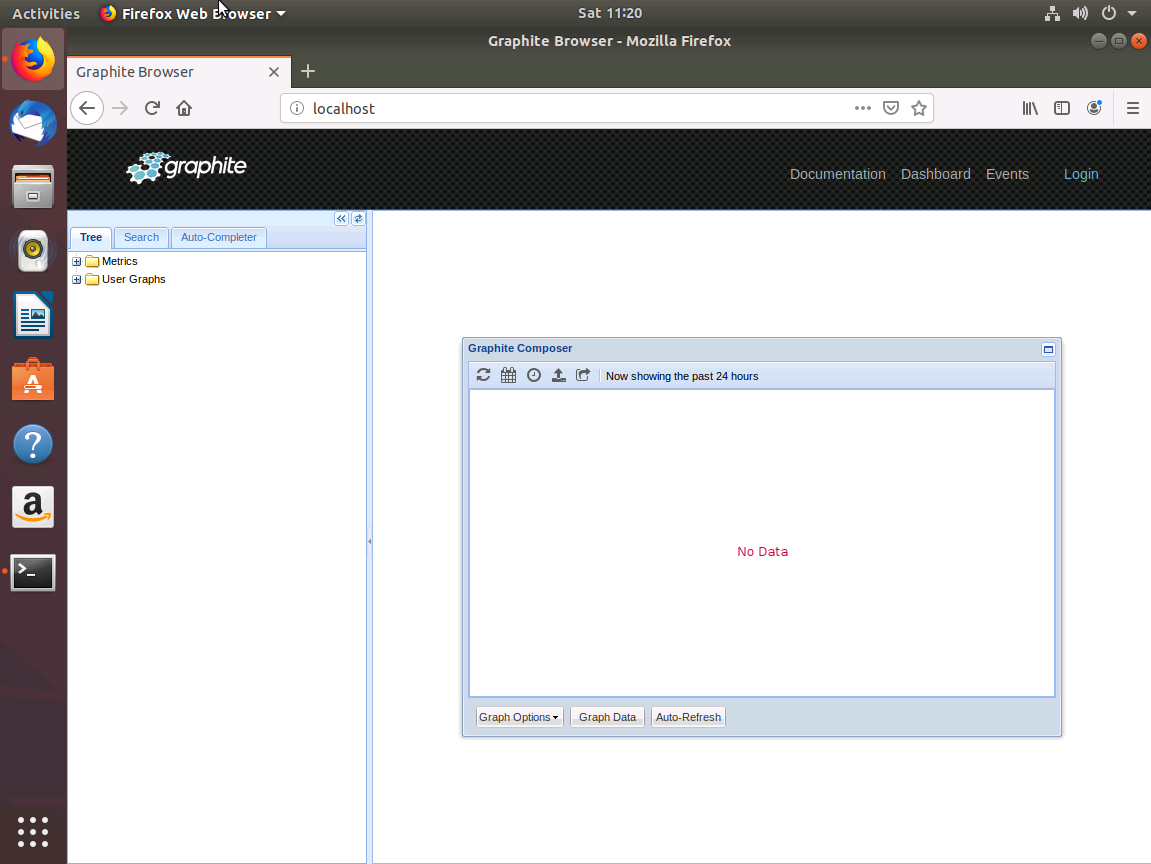
The Graphite Web UI is the tool that serves as the interface for your Graphite installation and is also where all of the graphing takes place. Below are some examples of what the Graphite Web UI looks like.
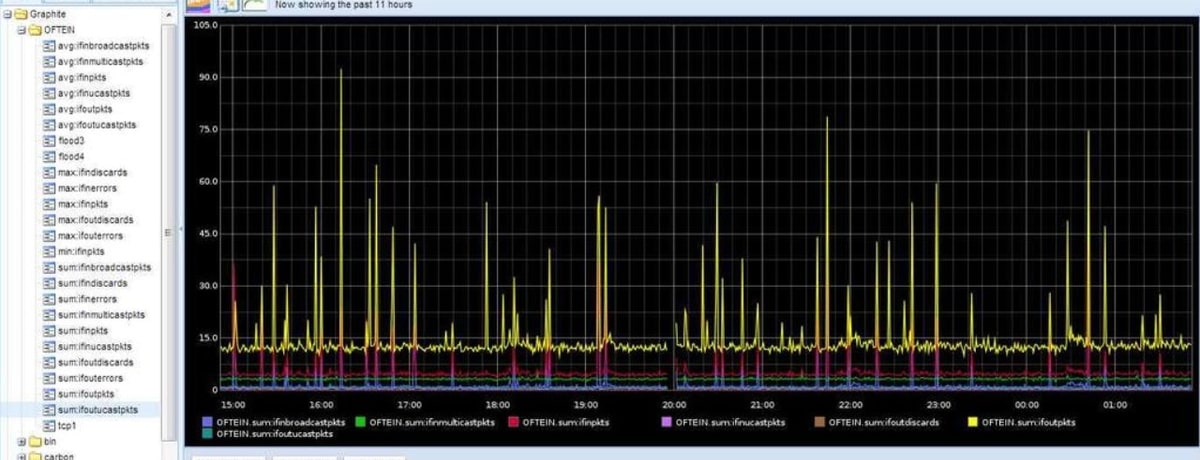
Here is the Graphite Web UI before you’ve loaded in metrics:
Then, after loading in metrics you can see graphs like this:
The Graphite Web UI allows you to do the following things:
- Operate on metrics and transform metrics into a more comprehensible form
- Adjust graph settings to customize graphs
- Extra features, such as cloning graphs, emailing graphs, and rendering graphs at specific URLs
- Events tracking
- Querying specific information
The Graphite Web UI is a great tool for graphing metrics and investigating your metrics database. However, most users of Graphite couple it with Grafana for better long-term monitoring and dashboarding. Read more here about how to use the Graphite Web UI to its fullest in our article on the MetricFire blog. Also, definitely check out how to use Graphite and Grafana here.
What can Graphite monitoring be used for?
Graphite is used to monitor time-series data of all kinds and is most commonly used for server, network, and application monitoring. You can use Graphite to monitor any information that is produced as a time-series, so some people also use it to monitor website activity or even electricity consumption. To take a look at some really cool use cases, check out the following tutorials on the MetricFire blog:
- Monitoring Raspberry PI with Graphite
- Monitoring a Heroku App with Graphite
- Monitoring CircleCI with Graphite
- Installing and setting up Graphite
- Configuring Graphite on Ubuntu
What are the problems with open-source Graphite?
Users find a lot of the same issues with Graphite over and over again. While being a fantastic product, there are some problems that users of the open-source project all agree upon.
- Dashboarding: Graphite Web UI is not a great dashboarding tool. While it is great as a graphing tool, it is not recommended for long-term metrics monitoring. You’ll want to use Grafana, or Hosted Grafana by MetricFire, for your dashboard.
- Team sharing and team accounts: Graphite Web UI does not have a login feature, which means that it’s very difficult to share among your team members. This is another fix that Grafana provides.
- Cluster native storage: Whisper is not a cluster native storage solution. Whisper is file-based and it makes scaling difficult. MetricFire’s Hosted Graphite provides cluster-native storage that solves this problem.
- Data collectors: Using data collectors such as StatsD and collectd can be a hassle, especially if you need many different collectors for different clients.
- Data aggregation: Graphite does not have a data labeling or tagging system, which means that it’s difficult to aggregate out subgroups within your metrics. MetricFire’s Hosted Graphite provides a new feature called Data Views which allows users to see more within their data.
- Scaling: Graphite is notoriously difficult to scale out to wider production. It can take the focus of entire teams of engineers to monitor a large production environment with an in-house installation of Graphite. It can be expensive to do this, as well as generally difficult.
MetricFire’s Hosted Graphite
MetricFire’s Hosted Graphite solves the problems that currently exist with Graphite.
- MetricFire’s Hosted Graphite comes with Grafana built in, so the product has great dashboarding right from the start.
- Hosted Graphite has team accounts and easy sharing, as the web app is fully account based. Teams can easily add and remove users and control user-sharing abilities.
- MetricFire has built its own time-series database that is cluster-native and built for data aggregation. This allows users to view sub-groups within their metrics using a special feature called Data Views.
- MetricFire’s hosted Graphite has a custom collector called the Hosted Graphite Agent, that replaces all of the other typical collectors used by Graphite users.
Read more about The difference between vanilla Graphite and Hosted Graphite - it has all of the best features of open-source Graphite while improving on the original, and offering a fully serviced hosted platform.
Conclusion
The Graphite graphing and monitoring tool is great for time-series monitoring. It is immensely flexible and can be configured to monitor any data points over time.
To try Hosted Graphite sign up for the MetricFire free trial where you can start monitoring with Graphite and Grafana today. You can also book a demo and talk to the MetricFire team directly about how monitoring with Graphite can be done at your company.