

Table of Contents
Great systems are not just built. They are monitored.
MetricFire runs Graphite and Grafana as a fully managed service for small engineering teams, taking care of storage, scaling, and version updates so your team doesn't have to. Plans start at $19/month, billed per metric namespace rather than per host, and include engineer-staffed support. Integrations work natively with Heroku, AWS, Azure, and GCP, and data is stored with 3× redundancy in SOC2- and ISO:27001-certified data centres.
Grafana is a powerful platform for monitoring and time-series data analysis. Graphite is a system for data collection and visualization. Graphite is strong in time-series metrics collection, but Grafana provides a more advanced solution for data analysis and visualization. That’s why Graphite and Grafana are often used in a bundle. In this tutorial, we will show you how to use Graphite with Grafana.
Remember that Metricfire provides a free trial for Hosted Grafana and Hosted Graphite. Sign up and follow along with us in this tutorial.
Key Takeaways
- Grafana is a robust platform for monitoring and time-series data analysis, while Graphite excels in data collection and visualization, particularly for time-series metrics. They are often used together to leverage their respective strengths.
- Grafana offers extensive customization options for panels, including selecting visualization types, adjusting settings like axes, legends, and tooltips, and even customizing gauge charts with min and max values, colors, thresholds, and labels.
- Grafana's exploration feature allows you to experiment with queries and compare results from different data sources. The split feature divides the screen for convenient comparison.
- Grafana makes it easy to share dashboard visualizations with others. You can generate links, embed iframes, or create snapshots to share your work with teammates and stakeholders.
- Alerting is crucial for monitoring, and Grafana can monitor Graphite metrics and trigger alerts based on predefined conditions. Alerts can be configured from the panel creation menu.
Adding a Graphite data source to Grafana
This article contributes to our previous post Monitoring with Graphite: Installation and Setup, where we have configured Graphite to collect metrics from the target system (computer). In this tutorial, we will go further and connect Graphite to Grafana to build a dashboard based on the collected metrics.
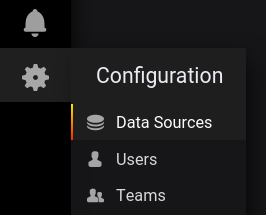
The first step we need to do is add the Graphite data source to Grafana. In Grafana web UI, hover the mouse over the gear button (to see the Configuration drop-down menu) and click on the Data Sources tab:
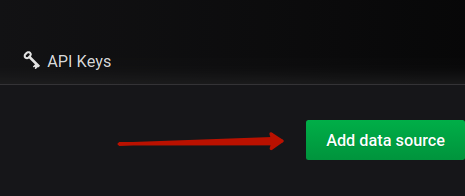
On the next page, you will see the list of all added data sources. If you don’t have any, the list will be empty. What you need to do is press the Add data source button:
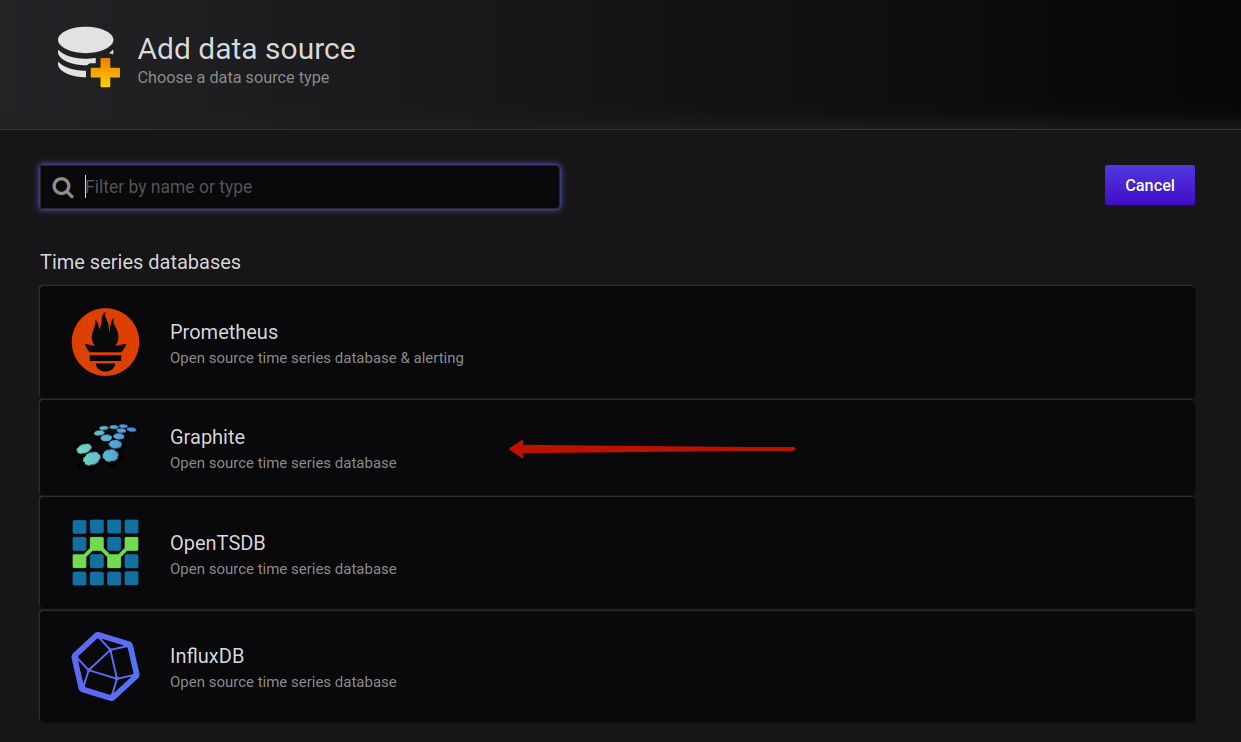
Now you need to choose a data source type:
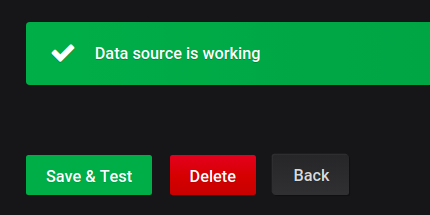
Next, specify the data source parameters. Pay attention to URL and Access (if you use Hosted Graphite, select Browser). Then click the Save & Test button:

Then, Grafana will test the connected data source and, if everything is OK, you will see the success message:
Now the Graphite data source is added, and we can create a dashboard.
Creating a dashboard in Grafana
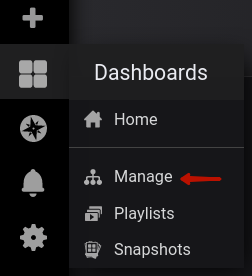
To create a dashboard, click on the Manage tab in the Dashboards drop-down menu:
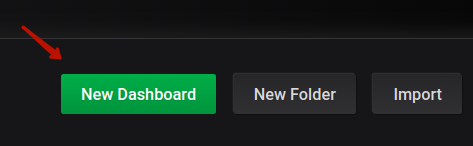
Next, click the new dashboard button:
A dashboard requires at least one panel to exist. So, on the next step, we click Add Query to create a new panel:
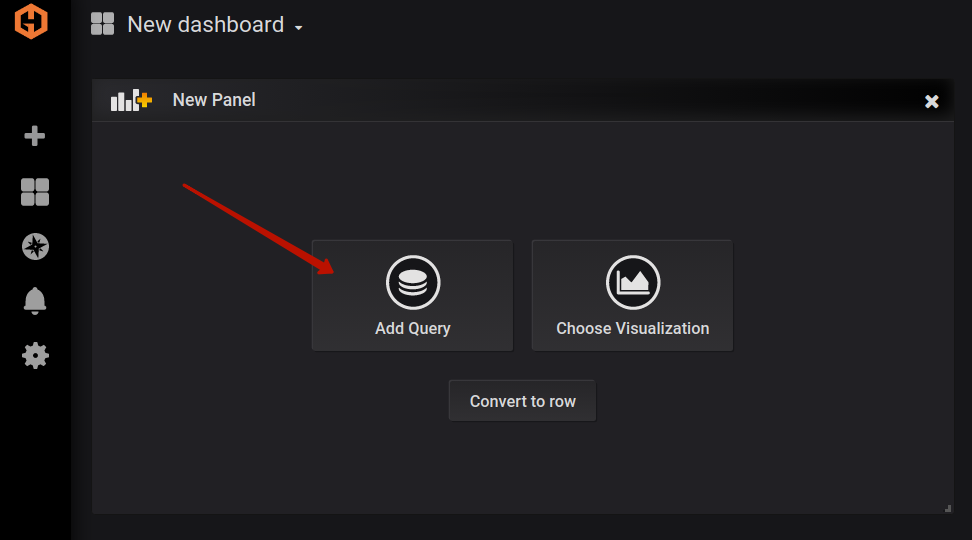
After that, you will see the following window:
Here you should create a query against the data source to display the visualization.
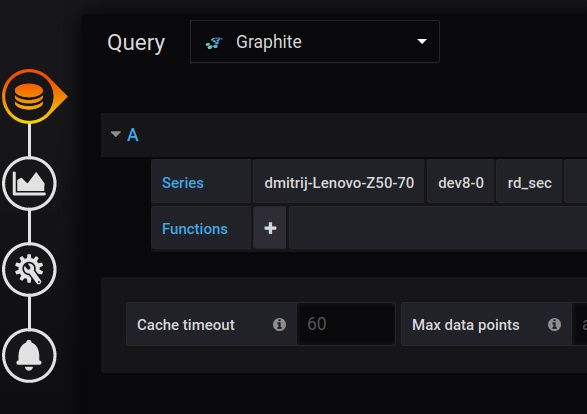
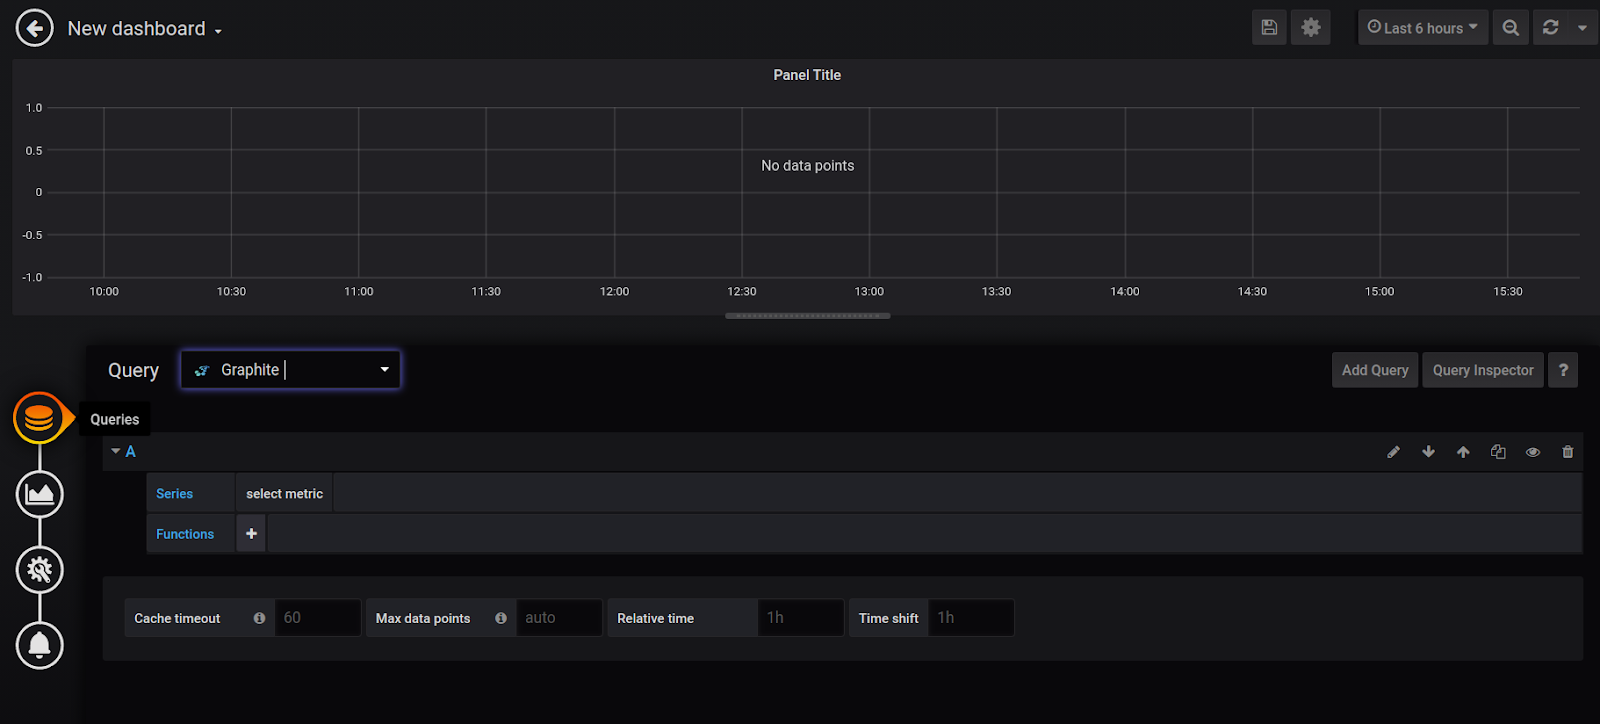
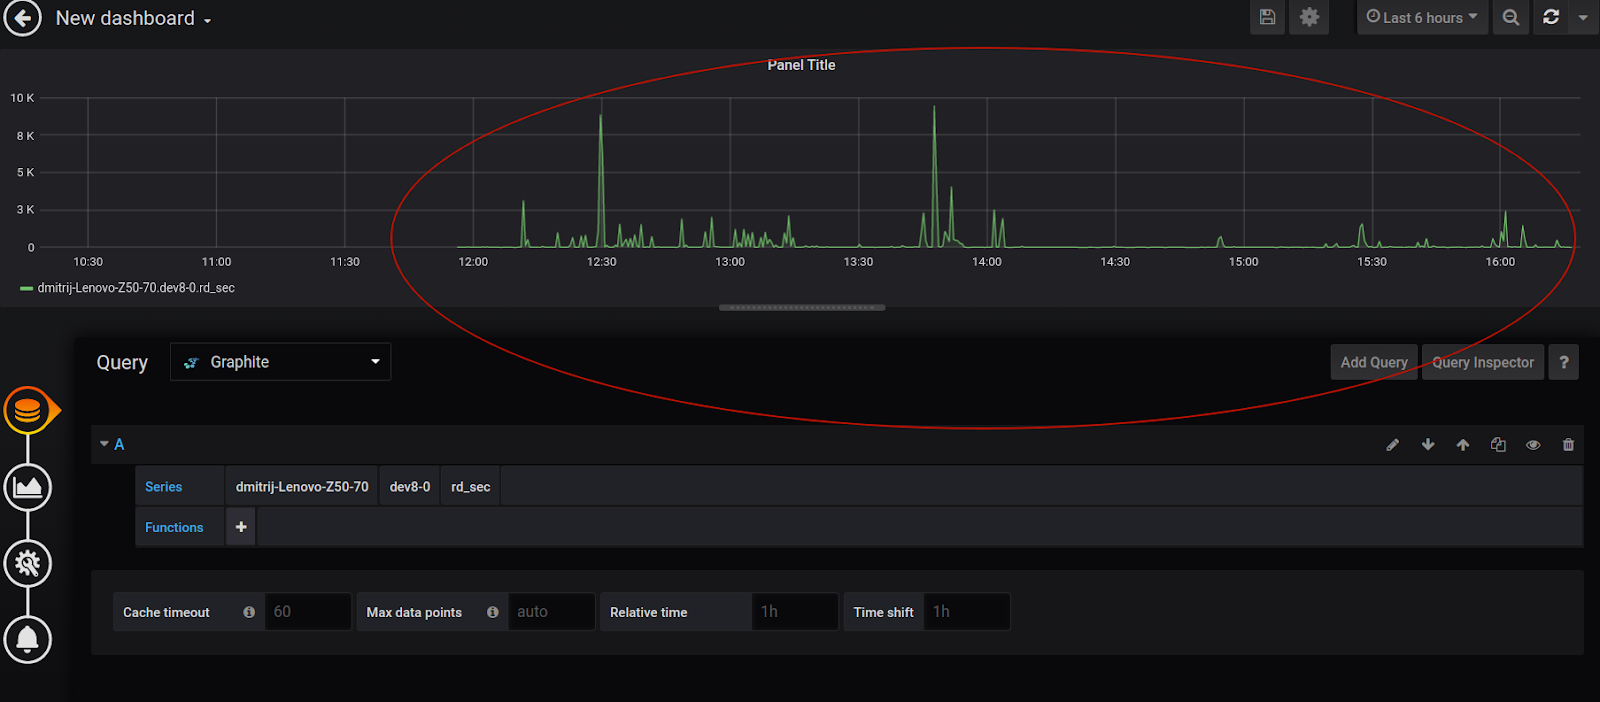
You can see that we select the data source Graphite (at the top of the image above). Then we specify the metric that we want to visualize (in the Series section of the “A” query) - dmitrij-Lenovo-Z50-70.dev8-0.rd_sec. This is sufficient to display the visualization of the metric:
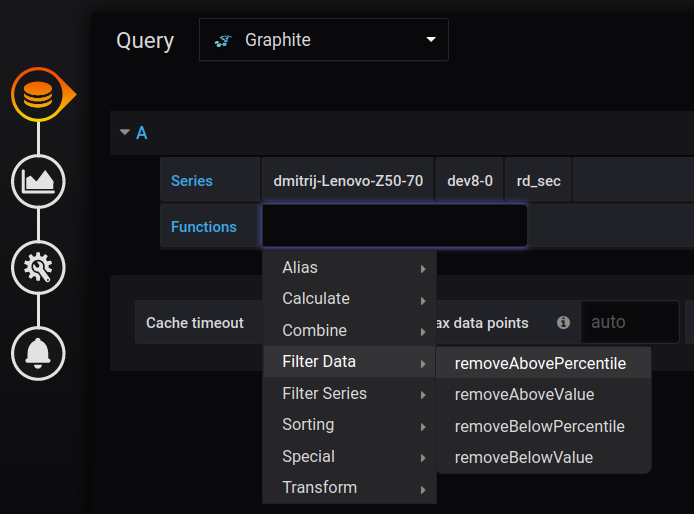
But we can go further and add a function to transform the visualization. For example, remove the values that are above the specified percentile:
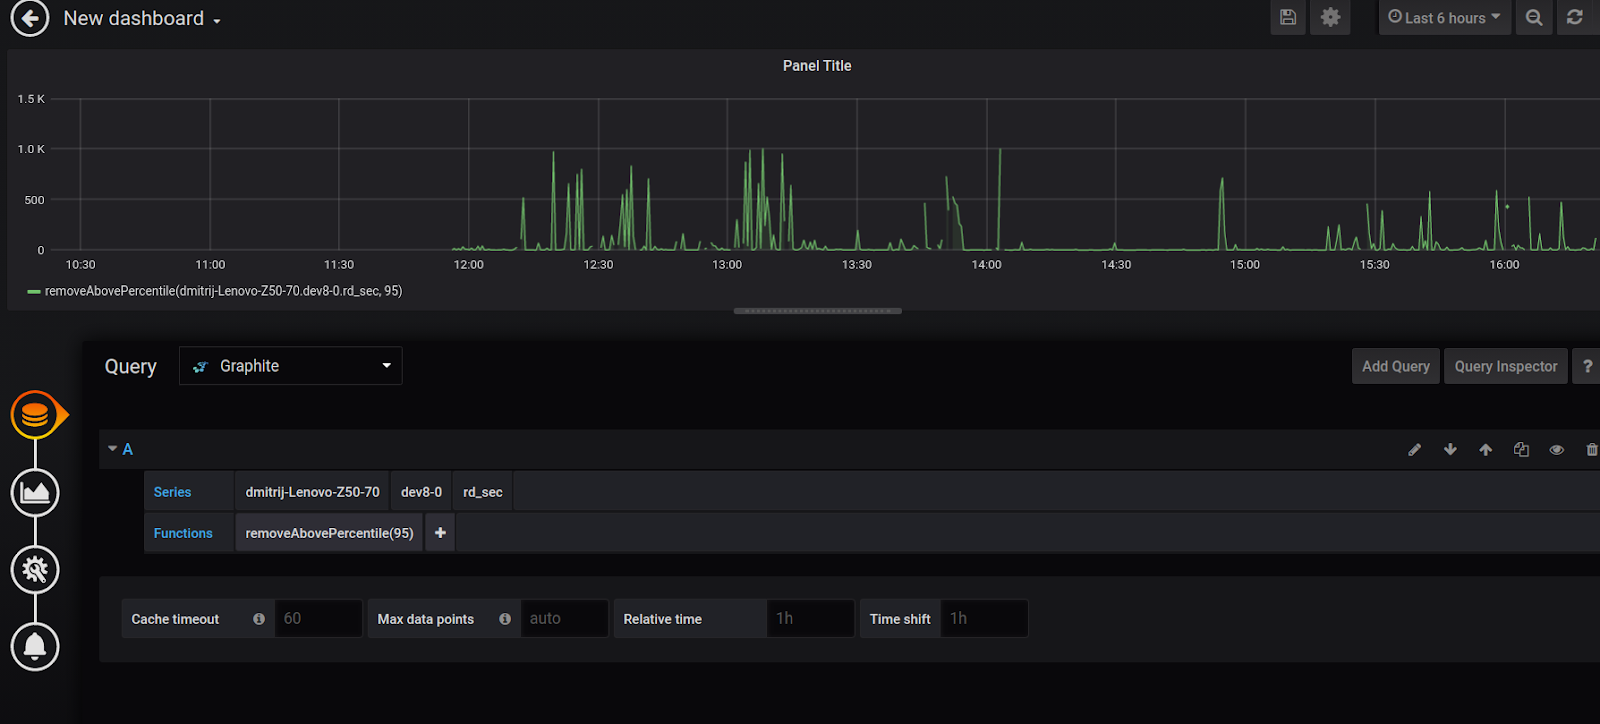
Here is the same visualization but without the values from the upper 5-percentile:
You can click on the back button near the dashboard name (in the top left corner) to go to the entire dashboard view (where you can see all the panels simultaneously).
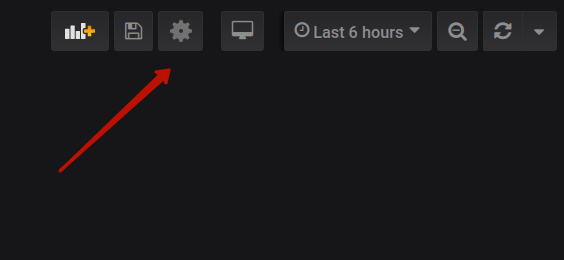
To change the dashboard settings, you should press the gear button at the top right side of the screen:
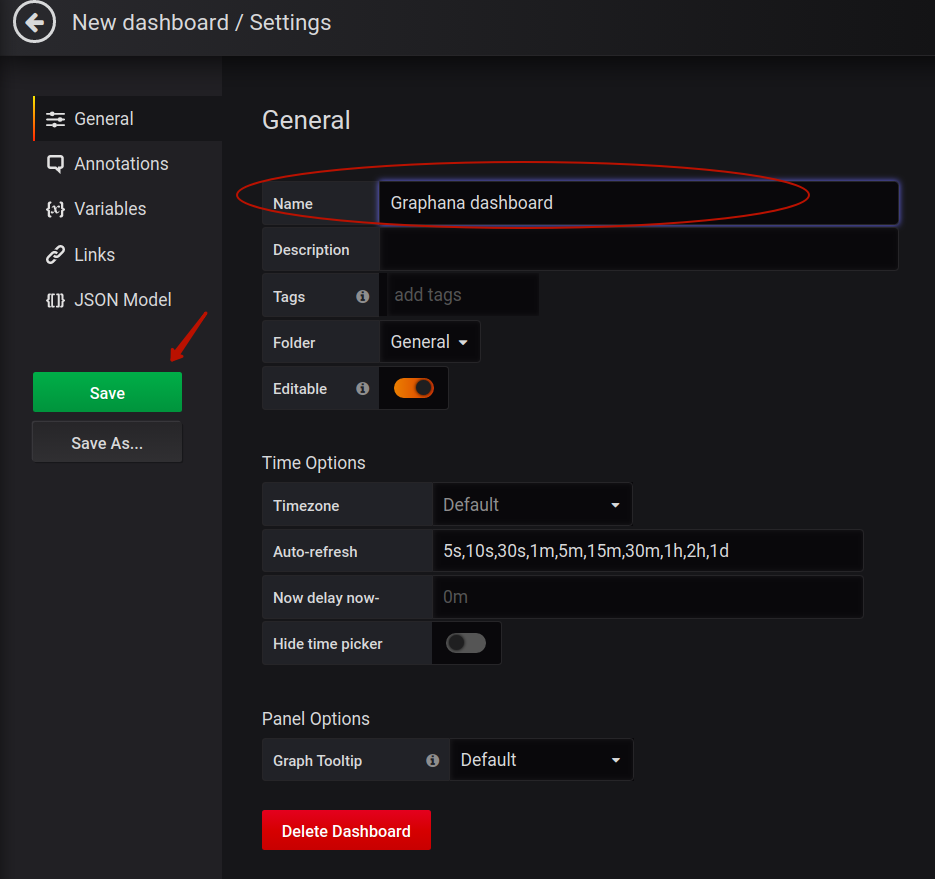
There you can, for example, change the dashboard name:
The Add panel button is located in the same region of the display as the gear button for the dashboard’s settings:
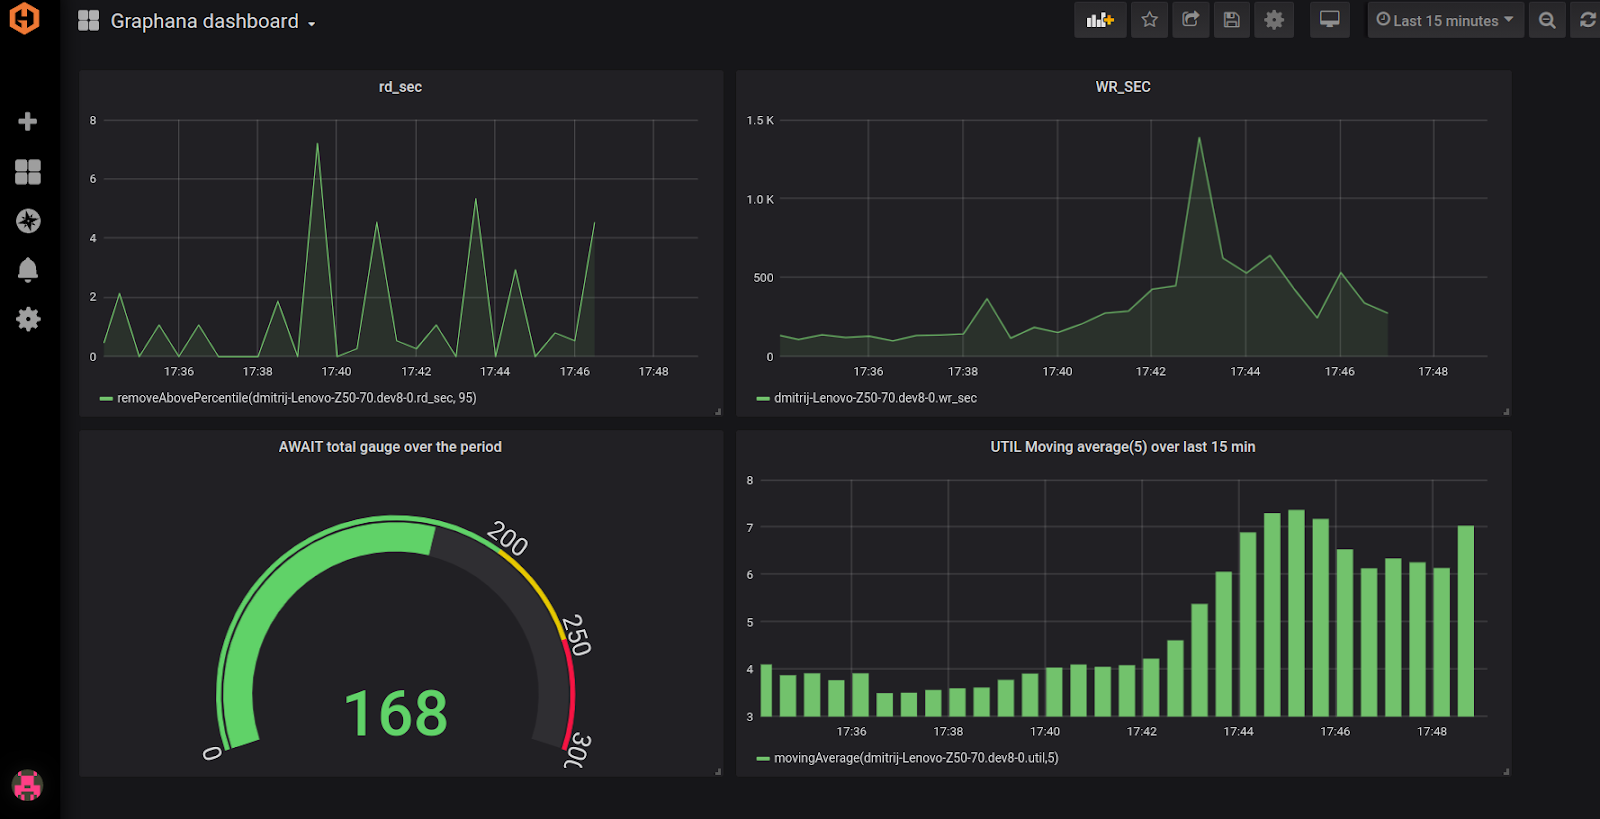
We have added several additional panels and here is what our dashboard looks like now:
Grafana supports different types of visualization and each type can be customized. Graphite also has the functionality to display metrics, but its visualization abilities are far more limited than Grafana’s. Check out our articles on Grafana Dashboards, as well as Graphite Dashboards to learn more.
Grafana features for Graphite data
Besides building nice dashboards, Grafana has other interesting features that you can use while working with Graphite metrics. In this section, we will introduce these features.
Panel customization
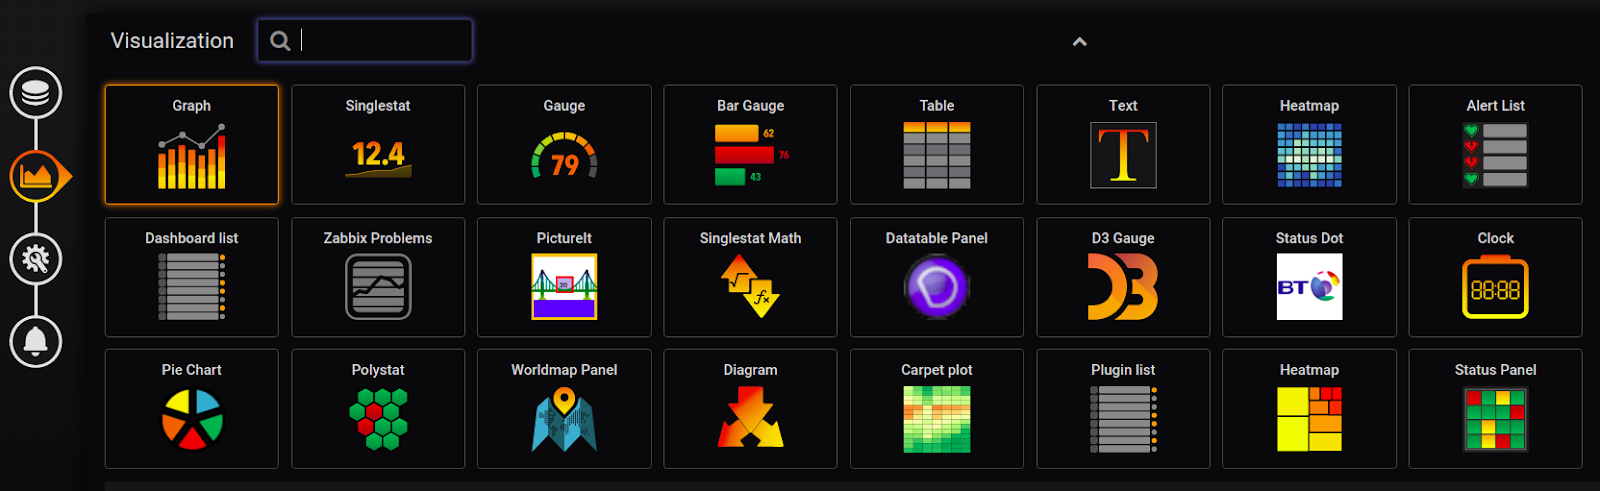
In the previous part of the tutorial, you could see that Grafana supports different types of charts. Here is where you can choose the appropriate type of visualization:
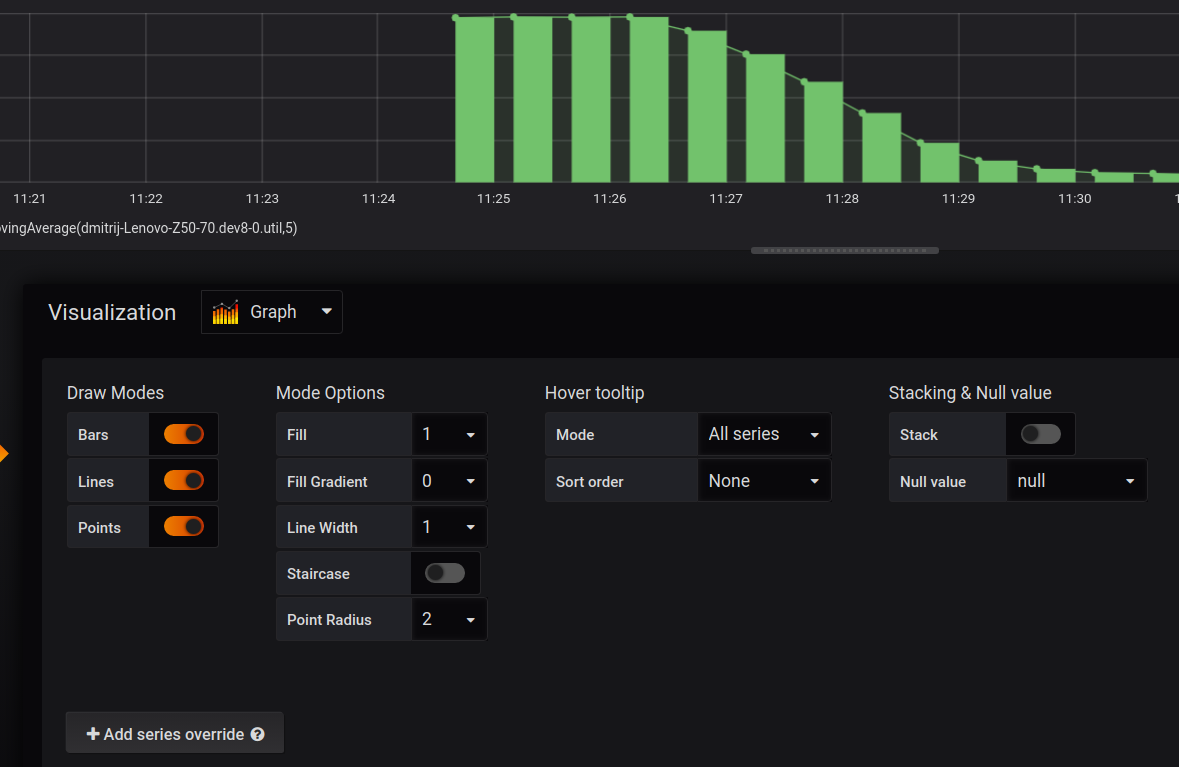
In addition, you can customize each particular chart. For example, for the graph chart you can change the draw modes, mode options, hover tooltip, set up axes, legend, etc:
Another interesting example of the visualization tuning can be made in the gauge type of chart:
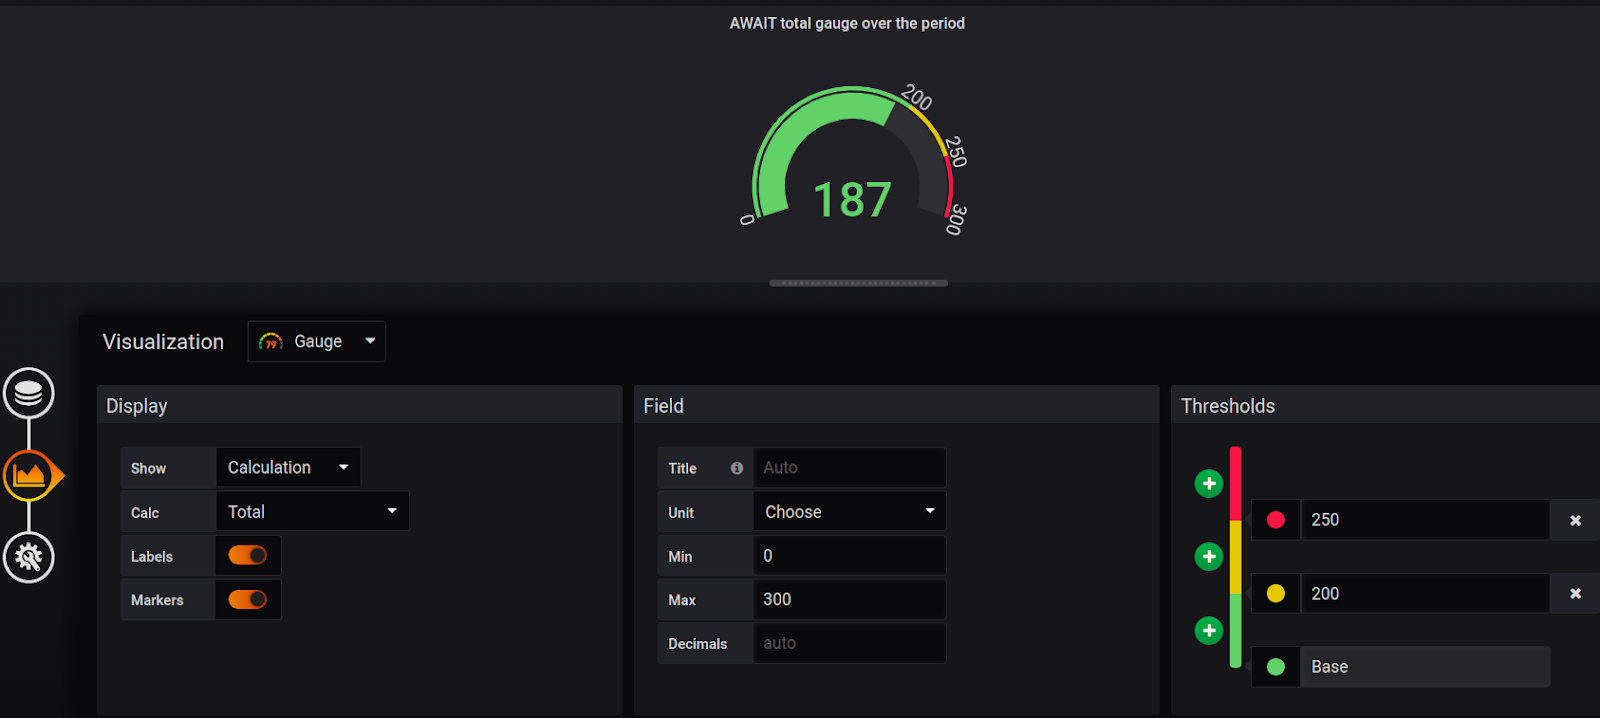
Here you can see it is possible to select min and max values, colors for values ranges, thresholds for these ranges, labels, markers, etc.
In Grafana, each type of visualization has its own features that you can tweak and customize.
Exploration
The exploration option allows you to experiment with the query and compare the results of different queries against various data sources. So, this is more about the gist of the query than about the visualization type or graph tuning. The split feature is among the most convenient tools for exploration:
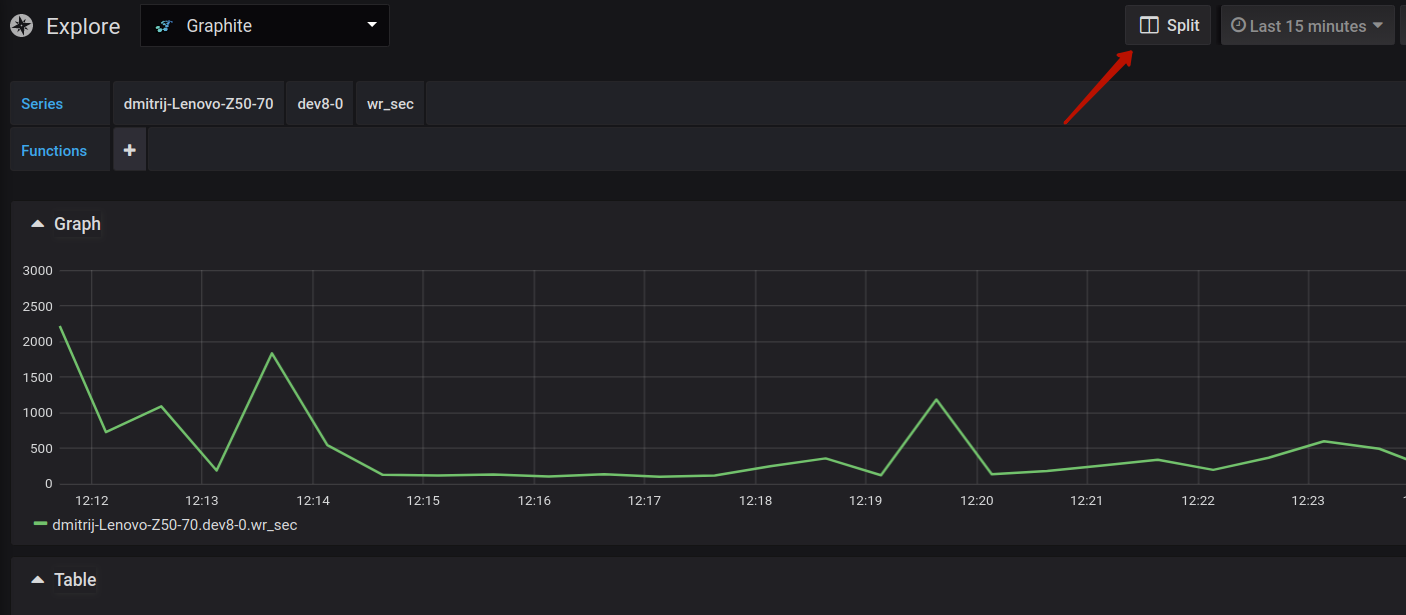
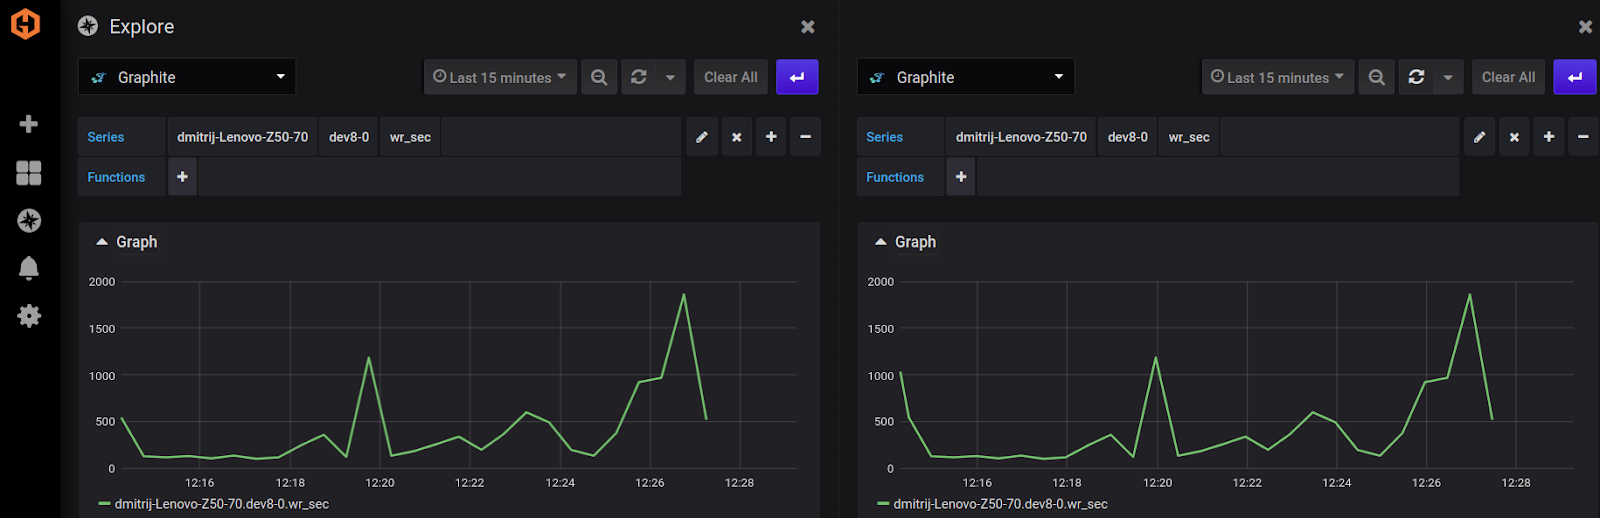
It splits the screen into two parts for a more convenient comparison of the query results. You can find more information about the Explore feature in the Grafana documentation.
Sharing and collaboration
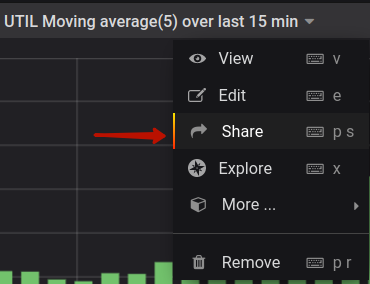
While working in Grafana with the Graphite metrics, it is very easy to share the results of your work with your teammates or other stakeholders. First, you need to click on the Share option in the panel drop-down menu:
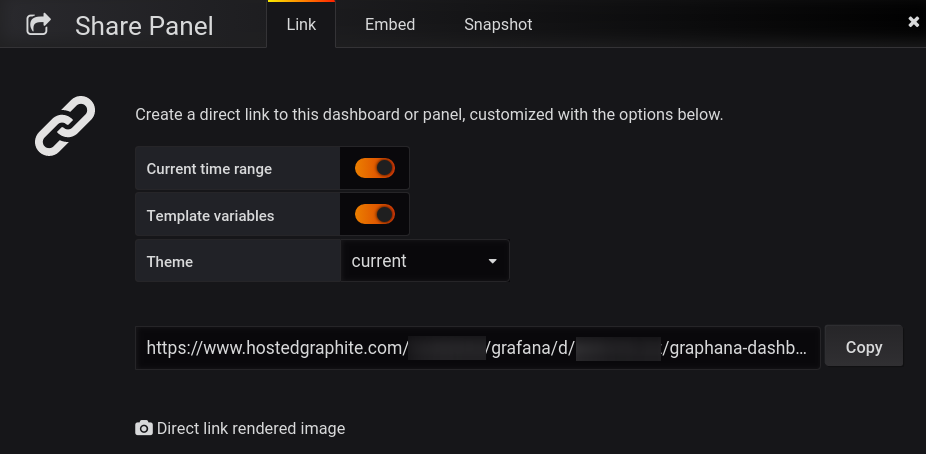
Next, choose the way how the visualization will be shared. It is possible to generate a link to it, embed the iframe into the website, or make a snapshot:
Alerting
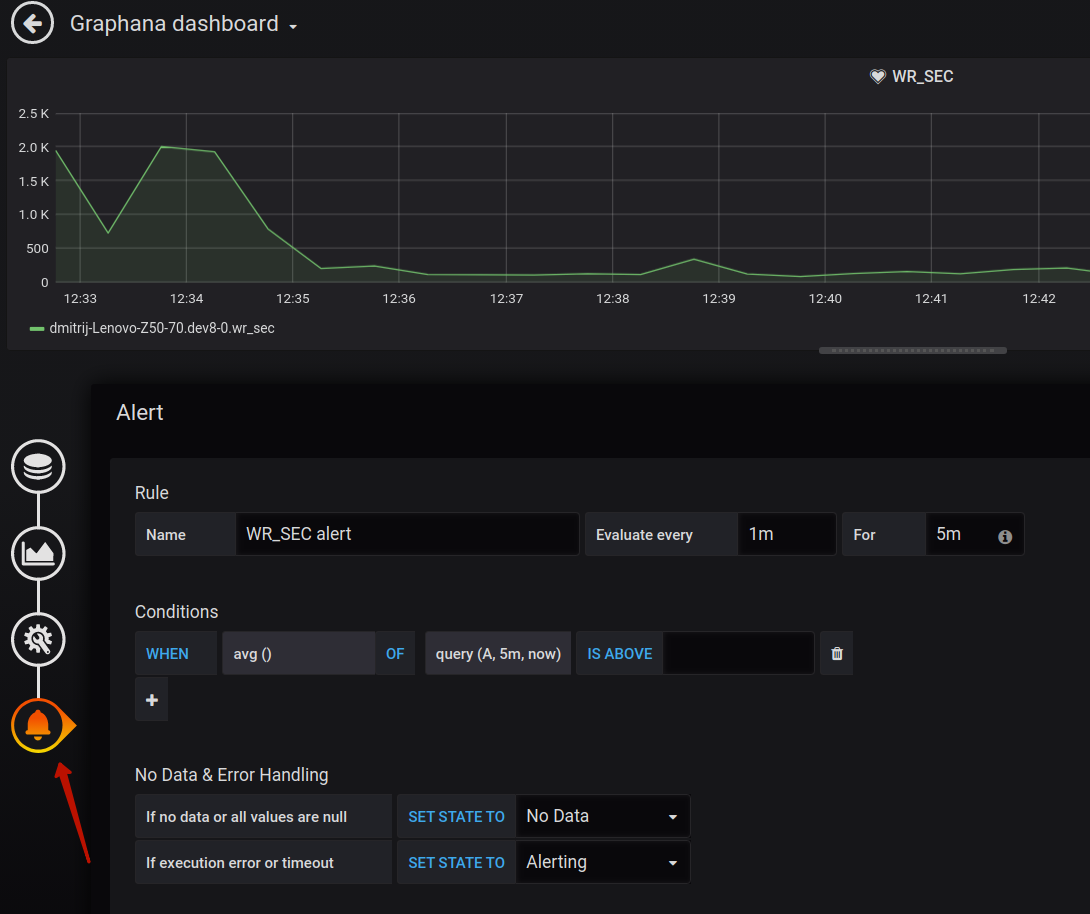
Alerting is one of the important features for monitoring. Graphite collects metrics that reflect information about the health of the system, performance, current state, etc. It is often useful to be notified when certain events occur (either with negative or positive implications). Grafana can monitor the metrics from Graphite and trigger alerts according to the specified conditions.
You can create an alert from the panel creation menu, by clicking on the bell icon:
Conclusion
In this tutorial, we have introduced the basics of using Graphite as a data source in Grafana. We demonstrated how to add a Graphite data source, how to configure it, how to create a dashboard using the metrics collected by Graphite, and how to use other features supported by Grafana.
Metricfire provides a 14-day free trial for using Grafana as a Service and Hosted Graphite. You can use this to understand whether these products are what you need and experiment with them. If you have any questions, book a demo and talk to us on video chat.


