
Table of Contents
Great systems are not just built. They are monitored.
MetricFire runs Graphite and Grafana as a fully managed service for growing engineering teams, taking care of storage, scaling, and version updates so your team doesn't have to. Plans start at $19/month, billed per metric namespace rather than per host, and include engineer-staffed support. Integrations work natively with Heroku, AWS, Azure, and GCP, and data is stored with 3× redundancy in SOC2- and ISO:27001-certified data centres.
Introduction
There are several important performance indicators of any application, system, product, or process, which are aimed to give you an idea of the health and strength of that system at a glance. One of those key indicators is how certain parameters or data points perform over time. What if you want to monitor database latency in seconds, the number of hits on an API endpoint for a certain time frame, or simply how much time it takes certain processes to run? A single data point captured in the present moment will not provide you with much information by itself. However, tracking that same point over time will tell you much more, including the impact of a change on a particular metric.
For example, if you want to know the impact a new user interface design or API documentation has on the number of hits on your API, or how a specific software fix/upgrade affected your database’s latency, comparing the present value to a previous one done prior to when the change was introduced will be useful in providing this insight. Such is the value of time series data.
Graphite is an open-source project that monitors time series data and displays the information on easy-to-read dashboards. MetricFire's product, Hosted Graphite, runs Graphite for you so you can have the reliability and ease of use that is hard to get while doing it in-house. You can sign up for a MetricFire free trial here and start sending us metrics today. To get a look at what it would take to do it on your own, check out this guide to installing Graphite on Ubuntu.
Key Takeaways
- Time series data is crucial for monitoring the performance of applications, systems, products, or processes, allowing you to track how specific parameters or data points change over time.
- Graphite is an open-source tool designed for monitoring and graphing time series data, making it easy to visualize and analyze performance metrics.
- Installing Graphite can be simplified by using Docker, which allows you to set up Graphite quickly and portably. Docker commands are provided in the article for this purpose.
- Alternatively, you can install Graphite directly on an Ubuntu system using Linux apt-get commands. The installation involves installing Graphite Web, and Graphite Carbon, and configuring PostgreSQL as the database.
- Configuring PostgreSQL as the database for Graphite's web app improves data integrity and error handling.
Introduction to Graphite
Several tools exist with the main purpose of collecting, monitoring, and providing helpful insights using time series data. An example of such a tool is Graphite.
Graphite is an enterprise-scale monitoring and graphing tool that runs equally well on Cloud infrastructure or cheap hardware. Enterprises use Graphite to track the performance of their applications, websites, networked servers, and business services - and it was a pioneer product in the generation of monitoring tools. Graphite made it easier than ever to share, retrieve, store, and visualize time-series data.
Basically, Graphite does two things; it stores numeric time-series data and renders graphs of this data on demand. Graphite does not collect data - to collect data there exists a vast array of tools that can be used to collect and send data to graphite with minimal fuss or code changes. You can find a list of such tools on the graphite documentation page.
An architectural breakdown of Graphite reveals that it is made up of 3 software components:
- Carbon - Although Graphite will not collect data for you, it uses the Carbon component, which is a Twisted daemon to passively listen for time series data.
- Whisper - This is a simple database library for storing time-series data (similar in design to RRD)
- Graphite Web App - A Django web app that renders graphs on-demand using Cairo.
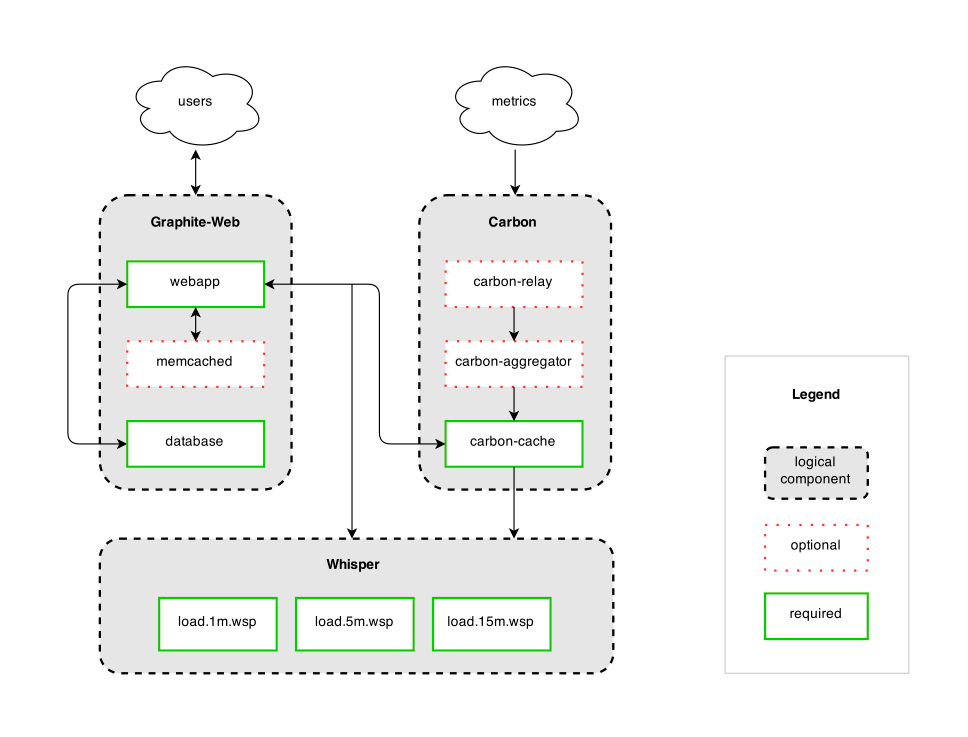
A simplified use case of Graphite would involve writing an application that collects numeric time-series data (this data would usually be collected by a separate tool as discussed above) which you are interested in graphing. Then the app sends the data to Graphite’s processing backend, Carbon, which then stores the data in Graphite’s specialized database, Whisper. The data can then be visualized through Graphite’s web interface, the Graphite Web App.
Now that we’ve gone through the “what is”, the rest of this article is going to explicitly focus on the installation of Graphite, specifically on an Ubuntu Operating System.
Installing Graphite Using Docker
Installing Graphite from source can be a complex process, but thank God we have docker! You can use docker to install the Graphite image to get Graphite up and running in just minutes. This makes for a fast and extremely portable installation. In order to install Graphite using docker, simply run the following command:
docker run -d\
 --name graphite\
 --restart=always\
 -p 80:80\
 -p 2003-2004:2003-2004\
 -p 2023-2024:2023-2024\
 -p 8125:8125/udp\
 -p 8126:8126\
 graphiteapp/graphite-statsd
This command would spin up a container named graphite and this container would have the following components:
- Graphite - front-end dashboard.
- Nginx - reverse proxies the graphite dashboard
- Carbon - back-end daemon that listens for time-series data.
- Grafana - front-end dashboard (more refined than Graphite).
- Statsd - UDP-based back-end proxy.
Please also note that you can freely change the mappings of the container ports to any host port in case the corresponding port listed in the command above is already occupied on the host. It's also not mandatory to map all ports, for example, using the command above would mean the Grafana component is not exposed on any port. This would force us to use the Graphite Web App as the front-end dashboard of our app. If you would prefer to use Grafana as your front-end dashboard, just go with the following command instead:
docker run -d\
 --name graphite\
 --restart=always\
 -p 80:80\
 -p 81:81\
 -p 2003-2004:2003-2004\
 -p 2023-2024:2023-2024\
 -p 8125:8125/udp\
 -p 8126:8126\
 hopsoft/graphite-statsd
This would configure port 80 for Grafana and port 81 for Graphite. Using the previous command would simply map Graphite to port 80. A detailed representation of the mapped ports can be found in the table below.
Host Container Service
80 80 nginx - grafana
81 81 nginx - graphite
2003 2003 carbon receiver - plaintext
2004 2004 carbon receiver - pickle
2023 2023 carbon aggregator - plaintext
2024 2024 carbon aggregator - pickle
8125 8125 statsd
8126 8126 statsd admin
Once you log in, update the default Django admin user account login details. The default is insecure. You can access the login page on http://localhost/account/login (or http://localhost:81/account/login if you have Grafana enabled) and log in using the default username and password, with the values of both of them being root. Once you log in, you can then update the root user's profile at: http://localhost/admin/auth/user/1/ (or http://localhost:81/admin/auth/user/1/ if you have Grafana enabled). You can access the Graphite dashboard using the following link: http://localhost/dashboard (or http://localhost:81/dashboard if you have Grafana enabled).
If Docker is not the way to go for you, you could install Graphite directly using linux apt-get commands.
Installing Graphite on Ubuntu 16.04
Installing Graphite
First, update your local package index to the latest stable version by running the following command:
sudo apt-get update -y

sudo apt-get upgrade -y
As we mentioned earlier, Graphite is made up of several components (the Graphite web application, Carbon storage backend, and the database library, Whisper). Each of these components is present in the Ubuntu default repository. You can install these by simply running the following command:
sudo apt-get install graphite-web graphite-carbon -y
As part of the installation, you will be asked the following questions:
“The /var/lib/graphite/whisper directory contains the whisper database files. You may want to keep these database files even if you completely remove graphite-carbon, in case you plan to reinstall it later. Remove database files when purging graphite-carbon?”
The question itself is self-explanatory and its answer would depend on your use case.
Installing and Configuring PostgreSQL
Next, we are going to configure a database for the Django web app. Although the Graphite data itself is handled by the Whisper database library and Carbon, the Graphite web application is built as a Django Python application and thus needs to store its data somewhere.
By default, it is configured to use SQLite3 database files, but these aren’t as robust as an actual relational database management system. Instead, we will be configuring our app using the PostgreSQL database because it is much stricter with data typing and will catch exceptions that might lead to problems down the road. In order to install and configure PostgreSQL, we’ll run the following commands:
sudo apt-get install postgresql libpq-dev python-psycopg2 -y
This command installs PostgreSQL and gets it running. But in order to use PostgreSQL, we’d need to create a user for that purpose, and then create a database for Graphite. We achieve this as follows:
1. First log in to the PostgreSQL shell using this command:
sudo -u postgres psql
2. Create a Graphite user and secure it using a password as follows:
postgres=# CREATE USER graphite WITH PASSWORD 'password';
3. Create a Graphite database and assign ownership to the user:
postgres=# CREATE DATABASE graphite WITH OWNER graphite;
4. Exit the PostgreSQL shell using this command:
\q
Configuring Graphite
Now that we have our database and user ready to go, we’ll still need to modify Graphite’s settings to use the components we just configured. Open the Graphite web app configuration file, local_settings.py:
sudo nano /etc/graphite/local_settings.py
Make the following changes to the file:
1. We should set the secret key to a value of your choice that will be used as a salt when creating hashes. Uncomment the SECRET_KEY parameter and change the value to something unique, long, and easy to remember.
SECRET_KEY = 'something_unique'
2. Specify the timezone because this will affect the time displayed on your graphs, so it is important to set. Set your time zone by editing the TIME_ZONE variable in the file.
TIME_ZONE = 'America/New_York'
3. We want to configure authentication for saving graph data. This is done by uncommenting this line:
USE_REMOTE_USER_AUTHENTICATION = True
4. Look for the Databases Configuration section of the file. We would change the values to reflect our Postgres configuration. This includes the NAME, ENGINE, USER, PASSWORD, and HOST keys.
When you are finished, it should look something like this:
DATABASES = {
    'default': {
        'NAME': 'graphite',
        'ENGINE': 'django.db.backends.sqlite3',
        'USER': 'graphite',
        'PASSWORD': 'password',
        'HOST': '127.0.0.1',
        'PORT': ''
    }
}
Save and close the file when finished by hitting CTRL + O, then ENTER, then CTRL + X to exit the file editor.
Next, run the following command to sync the database in order to create the correct structure:
sudo graphite-manage migrate auth

sudo graphite-manage syncdb
You will then be asked to create a super user account for the database, and it will prompt you to enter certain values. Just follow the onscreen prompts and enter the appropriate values for each question and our Graphite configuration should now be complete.
Configure Carbon
Next we configure Carbon, the Graphite storage backend by editing its service configuration file, graphite-carbon.
sudo nano /etc/default/graphite-carbon
1. Change the value of CARBON_CACHE_ENABLED to true for carbon to be started on system boot:
CARBON_CACHE_ENABLED=trueSave and close the file, when you are finished.
2. Next, open the Carbon configuration file, carbon.conf:
sudo nano /etc/carbon/carbon.conf
3. Set the variable ENABLE_LOGROTATION to true to enable log rotation:
ENABLE_LOGROTATION = True
4. Save the file, then configure the storage schemas by editing the storage schema file to instruct Carbon on how long to store values and how/what metrics it should store:
sudo nano /etc/carbon/storage-schemas.conf
In the file, you’ll notice two sets of rules that have already been defined - they are divided into sections. The words inside the brackets are the section headers that are used to specify a new definition. Under each section, there is a pattern definition and a retention policy.
The pattern definition is a regular expression that is used to match any information sent to Carbon. This information includes a metric name, which is what this pattern definition checks. In the first example, the pattern checks whether the metric in question starts with the string “carbon”.
The retention policy is defined by sets of numbers separated by colons. Each set consists of a metric interval (this specifies how often a metric is recorded), followed by a colon, and then the length of time to store those values. You can define multiple sets of numbers separated by commas.
To demonstrate, we will define our own schema that will match a test value that we’ll use later. Add the following section at the end of the file:
[test]
pattern = ^test\.
retentions = 10s:10m,1m:1h,10m:1d
Save and close the file when you are finished.
This will match any metrics beginning with the value “test”. It will store the data it collects three times, with different details. The first definition (10s:10m) will create a data point every ten seconds and store the values for only ten minutes.
The second archive definition (1m:1h) will create a data point every minute. It will gather all of the data from the past minute (six points, given that the previous archive creates a point every ten seconds) and aggregate it to create a single point. By default, it does this by averaging the points, but we can adjust this later. The data created at this level of detail is stored for one hour.
The last archive definition that will be created (10m:1d) will make a data point every 10 minutes, aggregating the data as it was done with the second archive. It will store the data for one day.
So when we request information from Graphite, it will return data from the most detailed archive that measures the time frame we’re asking for. For example, if we request metrics from the past 5 minutes, information from the first archive will be returned. If we request a graph of the past 50 minutes, the data will be taken from the second archive.
5. Next, we will need to define the way we want aggregation to occur. This can be done by editing a file called storage-aggregation.conf to set your aggregation specifications, but for the purpose of this tutorial, we will use an example storage aggregation configuration file. Copy the example configuration file to the Carbon configuration directory:
sudo cp /usr/share/doc/graphite-carbon/examples/storage-aggregation.conf.example /etc/carbon/storage-aggregation.conf
6. Finally, start the Carbon service with the following command:
sudo systemctl start carbon-cache
Configure Apache for Graphite
In order to be able to use the Graphite web interface, we would need to install and configure Apache. You can install Apache with the following command:
sudo apt-get install apache2 libapache2-mod-wsgi -y
When the installation is complete, we should disable the default virtual host file, because it conflicts with our new file:
sudo a2dissite 000-default
Next, we copy the Graphite Apache virtual host file into the available sites directory:
sudo cp /usr/share/graphite-web/apache2-graphite.conf /etc/apache2/sites-available
We then enable the virtual host file by typing:
sudo a2ensite apache2-graphite
Reload the service to implement the changes:
sudo service apache2 reload
Access Graphite Web Interface
Finally, Graphite is installed and we can now access its web interface. Open your favorite web browser and type the URL:
http://your_server_domain_name_or_IP
Congratulations, you have just installed and configured Graphite!
Scaling Graphite to the production level can be a really big challenge, even if you know the fundamentals of how to work Graphite. If you're looking to run Graphite on a production level, sign up for a demo and get us to help you. You can also deploy metrics right now on our free trial, and see if MetricFire is the right fit for you.


