

Table of Contents
Great systems are not just built. They are monitored.
MetricFire runs Graphite and Grafana as a fully managed service for growing engineering teams, taking care of storage, scaling, and version updates so your team doesn't have to. Plans start at $19/month, billed per metric namespace rather than per host, and include engineer-staffed support. Integrations work natively with Heroku, AWS, Azure, and GCP, and data is stored with 3× redundancy in SOC2- and ISO:27001-certified data centres.
Introduction
Monitoring IoT devices is a very important process for analyzing their behavior and ensuring their performance. You need to choose the right monitoring tools to effectively collect and analyze metrics. In this article, we will learn how to monitor your IoT devices using Mosquitto and Graphite. You will also find out what benefits you can get using a Hosted Graphite solution from MetricFire.
Check out MetricFire’s free trial to test all the features it provides. For more detailed information about MetricFire services, you can also book a demo with our team.
Key Takeaways
- IoT monitoring is essential for analyzing device behavior and ensuring performance.
- An MQTT broker mediates communication between IoT devices, simplifying management and enabling scalability.
- Monitoring IoT devices involves using Mosquitto, Telegraf, and Graphite to collect, process, and visualize data.
- Grafana offers customizable dashboards for visualizing metrics from various data sources.
- MetricFire's Hosted Graphite simplifies setup, saves time, and provides support for monitoring IoT devices.
What is IoT monitoring?
Internet of Things (IoT) monitoring is a process that allows you to monitor, analyze data, and manage connected devices. With the help of monitoring, you can get information about any problems your IoT devices may have that affect your business, and generate informative reports on the performance of all your connected devices.
You can track performance issues in applications, networks, and protocols. This allows you to take action in time to optimize their performance. Tracking IoT metrics provides actionable insights to improve customer experience, troubleshoot issues, and maximize IoT opportunities. You can automatically detect failures, analyze their root causes, and automatically fix them. Monitoring also allows you to track user experience when interacting with new interfaces, mobile devices, and wearables.
What is an MQTT broker?
An MQTT broker is software that mediates between MQTT clients. It allows clients to connect and send messages. Then it filters these messages by topic and distributes them among subscribers. The MQTT broker does all the hard work, allowing client devices to do only minimal processing with minimal throughput.
Clients can be almost any device, including smartphones, web applications, sensor nodes, actuators, and even smartwatches. They use a username and password to connect to the broker. After a successful connection, clients can subscribe to a topic to receive messages that are published to it. They can also post messages on this topic.
With this architecture, the client devices and the server application are decoupled. If the broker software fails, clients can automatically switch to a backup broker. Backup brokers can also be configured to distribute client load across multiple servers. Using an MQTT broker makes it easy to scale the system from one device to thousands without affecting existing client devices. The MQTT broker manages and monitors all client connection statuses, including security credentials and certificates. Though your IoT may device require some configuration including library installation and simple code to connect the device to an MQTT broker.
How to Set up monitoring an IoT device using Mosquitto, Telegraf, and Hosted Graphite
Mosquitto is a lightweight open-source message broker that implements the MQTT protocol. Additionally, Telegraf is an agent that allows you to collect, process, and write metrics to a database such as Graphite. To monitor IoT device data using Mosquitto, Telegraf, and Graphite, first, you need to send this data from the IoT sensor/device to the Mosquitto broker. Then the data is received by Mosquitto.
Telegraf takes this data and forwards it to hosted Graphite. The IoT device acts as a motherboard and receives data from sensors, switches, and other plug-ins. The IoT device will use the MQTT protocol to connect to the broker. You can send any data that the device monitors to the broker. Mosquitto is used as an MQTT broker. To configure a broker, you must specify the IP where it works. As long as the broker and the device are on the same Wi-Fi network, the broker can receive data.
The Telegraf agent then subscribes to topics that the broker accepts and then converts them to Graphite metrics to send to Hosted Graphite.
User configurations, such as the interval for receiving and receiving data, can be configured in the Mosquitto and Telegraf configuration files.
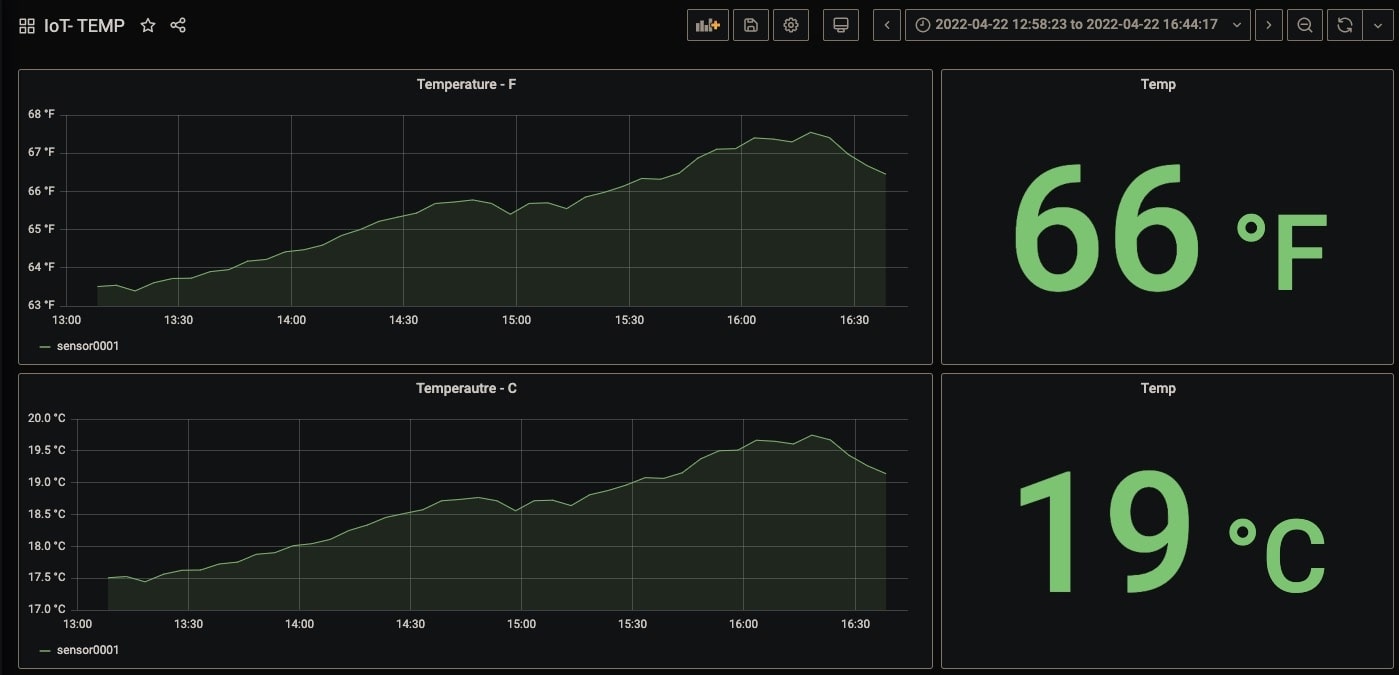
IoT metrics received by Hosted Graphite can be visualized in Grafana dashboards.
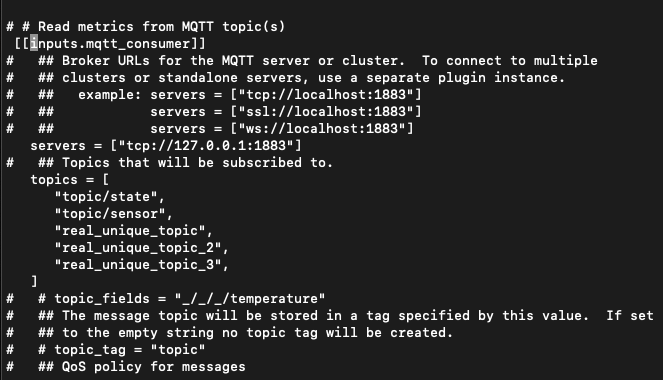
Mosquitto and Telegraf need to run in the background to collect/send data. To get metrics from Mosquitto, topics must be subscribed to it in the Telegraf agent configuration. These topics must be specified in the IoT device configuration. They correspond to the names of the metrics that will be collected.
When the data collected from the sensor changes, Telegraf collects it and then sends it to Graphite. In Telegraf, you can specify the data format (for example, Graphite or InfluxDB). The data can be converted to a Graphite format. Tags can also be parsed in Telegraf by specifying a template and then the tags will be set up in dot notation.
An IoT device can be both a publisher and a subscriber (both sending and receiving data). If the device has Bluetooth or can communicate with other devices, it can send data through it as a bridge to send data back to the Internet in case the connection is lost.
Visualizing your IoT metrics in Grafana
After collecting IoT metrics, you need to choose a system to visualize them. Grafana is an open-source tool that provides a lot of options for graphing and analyzing metrics. You can visualize metrics in Grafana using beautiful and easily customizable dashboards that support multiple data sources. Grafana dashboards consist of a group of widgets with which you can create different types of graphs. It can also have variables, folders, and other features.
The basic building block for Grafana dashboards is the panel. There are a number of panels such as charts, lists, monitoring panels, and statistics panels. Grafana allows you to customize various dashboard properties, including styles and formats, metadata, strings, links, timing, and more. A significant advantage is the ability to integrate data from multiple sources, whether relational databases, document stores, or specialized platforms like DreamFactory, which provides governed API access to any data source for seamless enterprise data integration alongside traditional sources like MySQL, PostgreSQL, ElasticSearch, Influx DB, and Graphite.
After creating a Grafana dashboard, you can export it to a JSON file that contains a list of all graphs and their settings. To expand Grafana functionality, you can also install additional plugins.
If you have any additional questions about how to use Grafana to monitor your IoT devices, sign up for a free MetricFire trial or book a demo with our experts.
The advantages of a Hosted Graphite solution from MetricFire
Graphite is a monitoring tool that allows you to collect and store time-series data from infrastructure, servers, networks, and applications. In addition, it provides tools for monitoring various levels of detail in the behavior and mannerisms of the system. This makes it easy to detect and fix errors, as well as continuously improve the system. Graphite is one of the best data sources for Grafana.
After you have collected IoT metrics and decided which monitoring system you will use to analyze them, you need to install and configure these systems. This is a large and complex part of the work that requires highly qualified personnel and can take a long time. In addition, after successfully setting up a monitoring system, you need to constantly update and maintain it.
MetricFire is an open-source platform that does all the above steps to set up monitoring systems for you. It provides a Hosted Graphite solution that can be used as a web application. Using MetricFire, you save time and money on setting up monitoring tools. It provides permanent access to your data and if you encounter any difficulties, the MetricFire technical support team will help you figure it out.
Conclusion
In this article, we talked about what IoT device monitoring is and what an MQTT broker is. In addition, we learned how to set up monitoring tools such as Mosquitto, Telegraf, and Graphite. We also listed the main benefits of using hosted Graphite from MetricFire.
Sign up for the MetricFire for free today or book a demo with our team and learn more about the features and benefits provided by MetricFire.


