
Table of Contents
Great systems are not just built. They are monitored.
MetricFire runs Graphite and Grafana as a fully managed service for growing engineering teams, taking care of storage, scaling, and version updates so your team doesn't have to. Plans start at $19/month, billed per metric namespace rather than per host, and include engineer-staffed support. Integrations work natively with Heroku, AWS, Azure, and GCP, and data is stored with 3× redundancy in SOC2- and ISO:27001-certified data centres.
Introduction
In a modern DevOps environment, having just metrics or just logs is like trying to navigate with half a map because you’re missing important context that makes decisions faster and smarter. Metrics tell you what is happening (CPU spikes, request rates, failed logins) but logs tell you why it’s happening, with the timestamps to prove it. Grafana Alloy makes it easy to collect, process, and forward logs to visualize alongside your metrics, all from one lightweight agent that can slot right into your existing observability stack. By streaming both data types into Hosted Graphite's Loki/Graphite backends, you have a single pane of glass for observing trends and drilling into root causes, which offers extra clarity every time an incident hits. Yes, it takes a few minutes to set up but in return, you get a faster, smarter, and more confident way to keep your systems healthy.
Start a chat with us today if you are interested in testing MetricFire's new Logging Integration for FREE. We will help you every step of the way, from collection to visualization!
Step 1: Setup the Alloy Collector on your Server (Ubuntu)
Alloy is Grafana’s modern, lightweight replacement for Promtail, and it will scrape/forward logs from a single binary. To make sure we’re installing Alloy safely and getting updates directly from Grafana, we first add their signed APT repository to Ubuntu. This involves importing Grafana’s official GPG key (so the packages are cryptographically verified) and then adding their repo to our system’s package sources. That way, when we install Alloy, the binary can be kept up-to-date with a simple apt upgrade.
sudo apt update && sudo apt install -y gpg apt-transport-https

# Add Grafana GPG key
sudo mkdir -p /etc/apt/keyrings
wget -qO- https://apt.grafana.com/gpg.key | gpg --dearmor | sudo tee /etc/apt/keyrings/grafana.gpg > /dev/null

# Add Grafana APT repo
echo "deb [signed-by=/etc/apt/keyrings/grafana.gpg] https://apt.grafana.com stable main" | \
  sudo tee /etc/apt/sources.list.d/grafana.list

sudo apt update && sudo apt install -y alloy
Prepare Runtime Permissions
When run as a systemd service, Alloy runs as the 'alloy user' for security reasons so we need to allow the right access to do its job. On Ubuntu, most system logs are readable only by members of the adm group, so we also need to add alloy to that group. We also make sure Alloy owns its own storage directory (/var/lib/alloy) so it can write its internal state without throwing permission errors.
sudo usermod -aG adm alloy
sudo mkdir -p /var/lib/alloy/data
sudo chown -R alloy:alloy /var/lib/alloy
Configure Alloy for Log forwarding
Edit the Alloy configuration file located at /etc/alloy/config.alloy (replace HOSTNAME and HG-API-KEY):
logging {
  level = "warn"
}

prometheus.exporter.unix "default" {
  include_exporter_metrics = true
  disable_collectors       = ["mdadm"]
}

prometheus.scrape "default" {
  targets = array.concat(
    prometheus.exporter.unix.default.targets,
    [
      {
        job         = "alloy",
        __address__ = "127.0.0.1:12345",
      },
    ],
  )

  forward_to = []
}

local.file_match "system_logs" {
  path_targets = [
    {
      __address__ = "localhost",
      __path__    = "/var/log/*log", // Narrow to specific files if needed
      host        = "<HOSTNAME>",
      job         = "varlogs",
    },
  ]
}

loki.source.file "system_logs" {
  targets    = local.file_match.system_logs.targets
  forward_to = [loki.write.default.receiver]
}

loki.write "default" {
  endpoint {
    url = "https://<HG-API-KEY>@www.hostedgraphite.com/logs/sink"
    batch_wait = "5s"
  }
}
Now you can enable/restart your Alloy service:
sudo systemctl daemon-reload
sudo systemctl enable alloy
sudo systemctl restart alloy
sudo systemctl status alloy
Or run Alloy manually for testing (matches service user to avoid permissions issues):
sudo -u alloy /usr/bin/alloy run --storage.path=/var/lib/alloy/data /etc/alloy/config.alloy
Step 2: Configure a Loki Data Source in Your Hosted Graphite Account
Reach out to us about trying our new Logging feature for free, and we will create a Loki Access Key in your Hosted Graphite account. If you don't already have a Hosted Graphite account, sign up for a free trial here to obtain a Hosted Graphite API key and Loki Access Key.
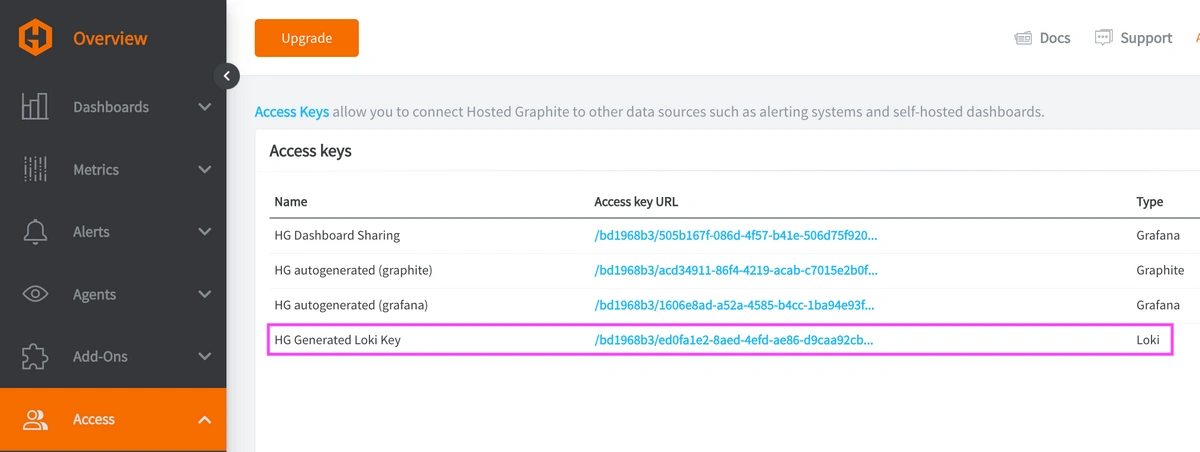
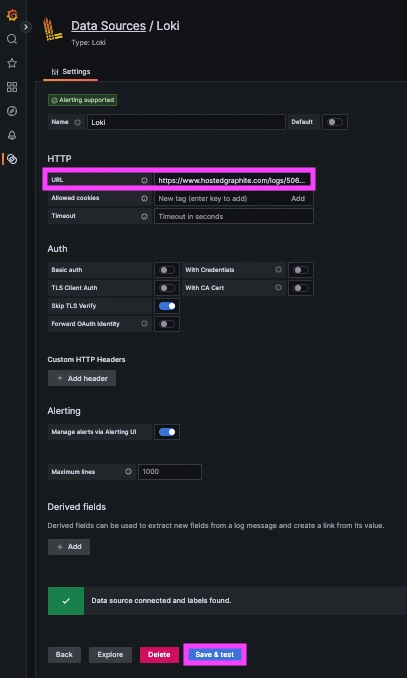
Now within the Hosted Graphite UI, you can navigate to Dashboards => Settings => Data sources => Add New Data source (Loki). You'll be able to add the URL for your HG Loki endpoint, which includes your new Loki Access Key: https://www.hostedgraphite.com/logs/<UID>/<LOKI-ACCESS-KEY>
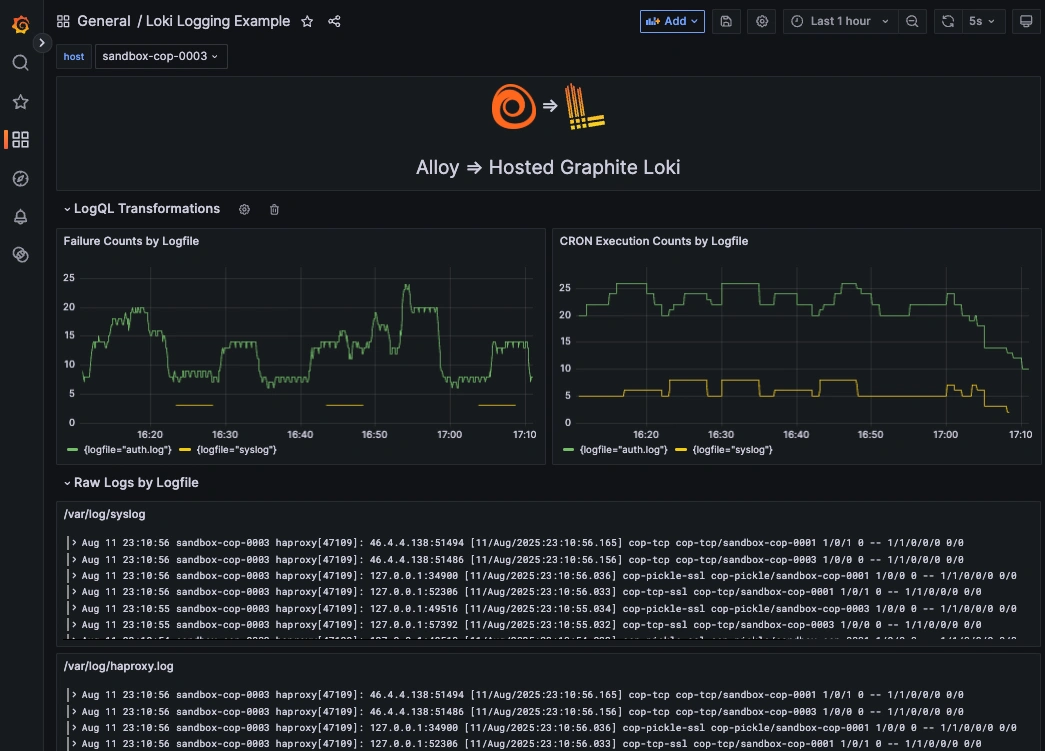
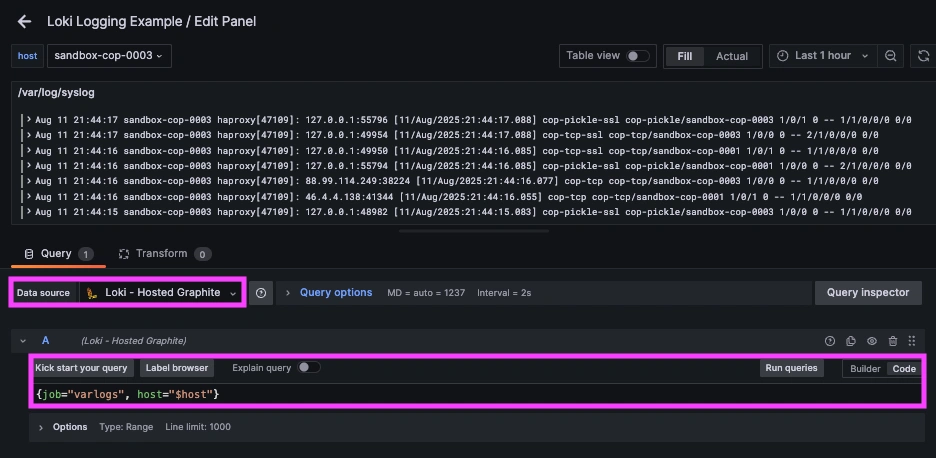
Step 3: Visualize System Logs in Hosted Grafana
Once system logs are forwarded to our Hosted Loki endpoint and the data source is connected in your Hosted Grafana, you can create a new dashboard panel, select Loki as your Data source, and format a query using 'code mode'.
Example query: {job="varlogs, host="$host"}
NOTE: Loki supports a powerful LogQL syntax with regex filtering, line parsing, and field extraction!
Step 4 (BONUS): Configure Alloy Performance Monitoring via Telegraf
Setup the Telegraf Collector
If you don't already have an instance of Telegraf running in your server, install our HG-CLI tool to quickly configure Telegraf:
curl -s "https://www.hostedgraphite.com/scripts/hg-cli/installer/" | sudo sh
NOTE: You will need to input your Hosted Graphite API key, and follow the prompts to select which services to collect metrics from.
Once it's installed, open the Telegraf configuration file at: /etc/telegraf/telegraf.conf and add the following section:
[[inputs.prometheus]]
  urls = ["http://127.0.0.1:12345/metrics"]
  name_prefix = "alloy_"
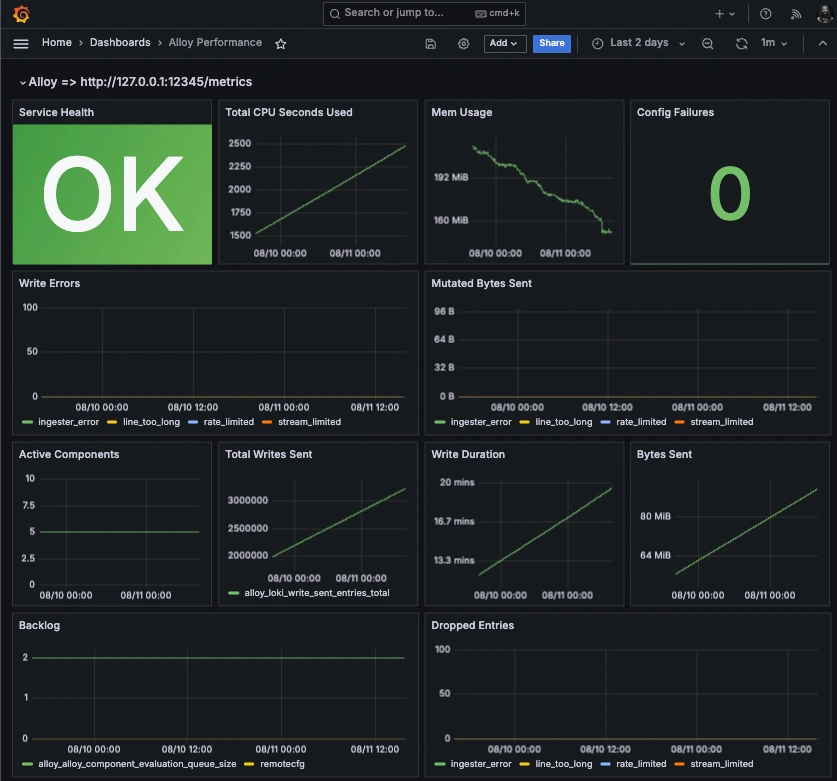
NOTE: Alloy automatically publishes metrics to an internal endpoint at: http://127.0.0.1:12345/metrics, so Telegraf's Prometheus input plugin will simply scrape this endpoint, and the auto-configured Graphite output will convert the metrics to the Graphite format, so they can be ingested by Hosted Graphite's public carbon endpoint. You can also curl Alloy's /metrics endpoint in your server to confirm that metrics are indeed being forwarded locally:
curl -s http://127.0.0.1:12345/metrics
Ship Alloy Metrics to HG
Simply restart the Telegraf service to forward Alloy metrics to your HG account, or run it manually to inspect the output for any potential errors:
telegraf --config /etc/telegraf/telegraf.conf
Once these metrics hit your Hosted Graphite account, you can use them to easily create custom dashboards and alerts!
Conclusion
When you combine logs with metrics, you stop guessing and start knowing. Metrics highlight the anomaly, but logs give you the story behind it and help you confirm root causes in seconds instead of hours. In today’s high-uptime environments, that level of speed can be the difference between a quick fix and a costly outage. Building an observability setup that brings logs and metrics together is essential for keeping your business’s tech stack ready for whatever the next deploy throws at it.
By visualizing logs alongside metrics, you can troubleshoot faster, spot patterns more easily, and get critical context around performance issues or system events. Instead of jumping between tools or manually inspecting your server logs, you can correlate a spike in metrics with the exact log line that makes sense, all in a single dashboard.
MetricFire's Loki-based logging integration is quick to set up but powerful in practice. Whether you're tracking security threats, service restarts, failed jobs, or kernel anomalies, it gives you the visibility you need to stay ahead of problems and reduce the time its takes to resolve them. Reach out to the MetricFire team today and let’s build something great together!


