
Table of Contents
- Introduction
- Step 1: Getting Started With Elasticsearch
- Step 2: Enable Slow-Query Logging to a File
- Step 3: Install and Configure Promtail to Collect System Logs
- Step 4: Create a Loki Data Source in our Hosted Grafana
- Step 5: Visualize the Slowlogs
- Step 6: Configure Telegraf to Send Corresponding Elasticsearch Metrics
- Conclusion
Great systems are not just built. They are monitored.
MetricFire is the fully managed Graphite and Grafana platform for small teams that don’t want to self-host their monitoring stack. Pre-built dashboards, alerts, and native add-ons for Heroku, AWS, Azure, and GCP. All with dedicated support and no infrastructure to maintain.
Introduction
Elasticsearch is a distributed search and analytics engine that powers everything from log management platforms to e-commerce search bars. It excels at indexing and retrieving large volumes of data quickly, but like any complex system it can slow down under heavy load or inefficient queries. That’s why a well-rounded monitoring solution for Elasticsearch is important, because logs help pinpoint which queries are causing trouble, while metrics provide the bigger picture of cluster health and resource usage. In this guide, we’ll walk through installing Elasticsearch, enabling slow query logging, and sending everything to hosted storage backends so you can visualize logs and metrics side by side.
In this guide you’ll enable slow-query logging, make the logs readable for MetricFire's Hosted Loki integration, and collect core Elasticsearch metrics with Telegraf. It’s minimal, reproducible, and production-friendly.
Start a chat with us today if you are interested in testing MetricFire's Logging Integration for FREE. We will help you every step of the way, from collection to visualization!
Step 1: Getting Started With Elasticsearch
This article assumes that you are running an instance of Elasticsearch, but if not, here is how you can get up and running quickly (ubuntu).
Install Dependencies
Here we will update the package lists, install basic utilities like gnupg2 and ensure OpenJDK 11 is available since Elasticsearch runs on the JVM. Without Java installed, Elasticsearch won’t start.
sudo apt-get update
sudo apt-get install -y apt-transport-https gnupg2 openjdk-11-jdk
Import GPG Key and Add Repository
This step imports the official Elasticsearch signing key. It ensures that the packages you download from Elastic’s repository are authentic and haven’t been tampered with. Adding the key builds trust into the installation process.
wget -qO - https://artifacts.elastic.co/GPG-KEY-elasticsearch | sudo apt-key add -
Here we register Elastic’s package repository with apt. This allows us to install and update Elasticsearch directly through the package manager, making it easier to stay up to date with new releases.
echo "deb https://artifacts.elastic.co/packages/8.x/apt stable main" | \
  sudo tee -a /etc/apt/sources.list.d/elastic-8.x.list
Fix Log Permissions, Enable, and Start
Elasticsearch writes its logs to /var/log/elasticsearch, and the service runs as the elasticsearch user. These commands make sure the directory is owned and writable by that user, otherwise Elasticsearch may fail to log or even start.
sudo chown -R elasticsearch:elasticsearch /var/log/elasticsearch
sudo chmod 755 /var/log/elasticsearch

sudo systemctl enable --now elasticsearch
Step 2: Enable Slow-Query Logging to a File
Reset the Password
By default, Elasticsearch generates a random bootstrap password for the elastic superuser. Resetting it here gives you a fresh password you can use consistently for API requests and monitoring integrations.
sudo /usr/share/elasticsearch/bin/elasticsearch-reset-password -u elastic
Create a Test Index
Slowlogs are configured per-index, so we will create a test index called slowlog-test. This gives us a sandboxed place to tune slowlog thresholds and run test queries without affecting production data.
curl -u elastic:<PW> -k -X PUT "https://localhost:9200/slowlog-test"
Configure Slowlog Levels and Thresholds
This API call adjusts the cluster-wide loggers so that search and indexing slowlogs are written at the WARN level. Setting the level to WARN ensures only relevant slow operations make it to the log, keeping noise down. In the second curl command, we define the thresholds that trigger slowlog entries. Setting them to 1ms is extreme, but it guarantees that any query will show up in the log while you test your pipeline. In production, thresholds are usually closer to 500ms–1s (make sure to add your PW to each section in the below commands):
curl -u elastic:<PW> -k \
  -X PUT "https://localhost:9200/_cluster/settings" \
  -H 'Content-Type: application/json' \
  -d '{
    "transient": {
      "logger.index.search.slowlog": "WARN",
      "logger.index.indexing.slowlog": "WARN"
    }
  }' && \
curl -u elastic:<PW> -k \
  -X PUT "https://localhost:9200/slowlog-test/_settings" \
  -H 'Content-Type: application/json' \
  -d '{
    "index.search.slowlog.threshold.query.warn": "1ms",
    "index.search.slowlog.threshold.fetch.warn": "1ms",
    "index.indexing.slowlog.threshold.index.warn": "1ms"
  }'
Run a Test Query
To generate a slow query, we search the test index with a regular expression. Regex queries are computationally expensive, which makes them a reliable way to trigger the slowlog (even though our threshold is set to 1ms to ensure that all queries will be properly written to the slowlog file).
curl -u elastic:<PW> -k \
  -X GET "https://localhost:9200/slowlog-test/_search" \
  -H 'Content-Type: application/json' \
  -d '{
    "query": {
      "regexp": {
        "text": {
          "value": ".*elasticsearch test slow query.*"
        }
      }
    }
  }'
Check the Logs
This command tails the slowlog JSON file, letting you confirm that your test query was captured. If configured correctly, you’ll see entries showing the query, the execution time, and related metadata.
sudo tail -50 /var/log/elasticsearch/elasticsearch_index_search_slowlog.json
Step 3: Install and Configure Promtail to Collect System Logs
We support log collection via OpenTelemetry Contrib and Promtail. In this example, we'll detail how to configure Promtail since it is an official log shipping agent for Grafana Loki. It runs as a lightweight binary that tails log files (like /var/log/*) and forwards them to our Hosted Loki endpoint over HTTP.
Install/unpack Promtail (Ubuntu)
wget https://github.com/grafana/loki/releases/download/v3.5.3/promtail_3.5.3_amd64.deb

sudo apt-get install -y ./promtail_3.5.3_amd64.deb
Configure Promtail to Forward Logs
Update your Promtail configuration file at /etc/promtail/config.yml to include the following (make sure to replace YOUR-API-KEY and HOST-NAME):
server:
  http_listen_port: 9080
  grpc_listen_port: 0

positions:
  filename: /tmp/positions.yaml

clients:
  - url: https://<YOUR-API-KEY>@www.hostedgraphite.com/logs/sink

- job_name: elasticsearch-logs
  static_configs:
    - targets:
        - localhost
      labels:
        host: <host-name>
        job: elasticsearch-logs
        __path__: /var/log/elasticsearch/elasticsearch*.json
Restart Promtail
sudo systemctl restart promtail
sudo systemctl status promtail
Step 4: Create a Loki Data Source in our Hosted Grafana
REACH OUT TO US about trying our new Logging feature for FREE, and we will create a Loki Access Key in your Hosted Graphite account. If you don't already have a Hosted Graphite account, sign up for a free trial here to obtain a Hosted Graphite API key and Loki Access Key.
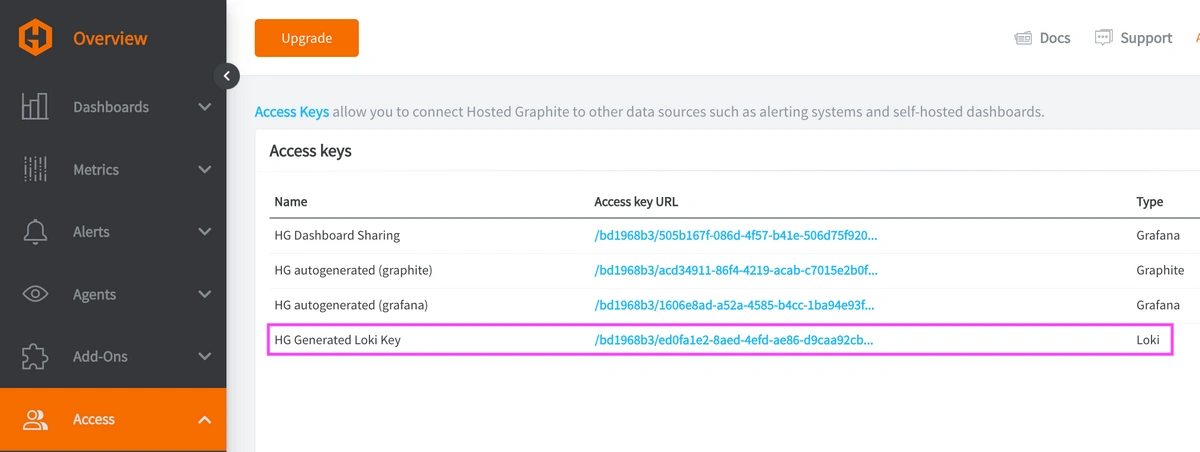
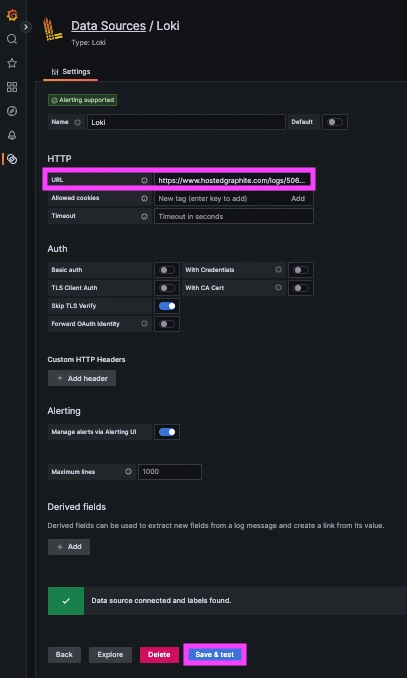
Now within the Hosted Graphite UI, you can navigate to Dashboards => Settings => Data sources => Add New Data source (Loki). You'll be able to add the URL for your HG Loki endpoint, which includes your new Loki Access Key: https://www.hostedgraphite.com/logs/<UID>/<LOKI-ACCESS-KEY>
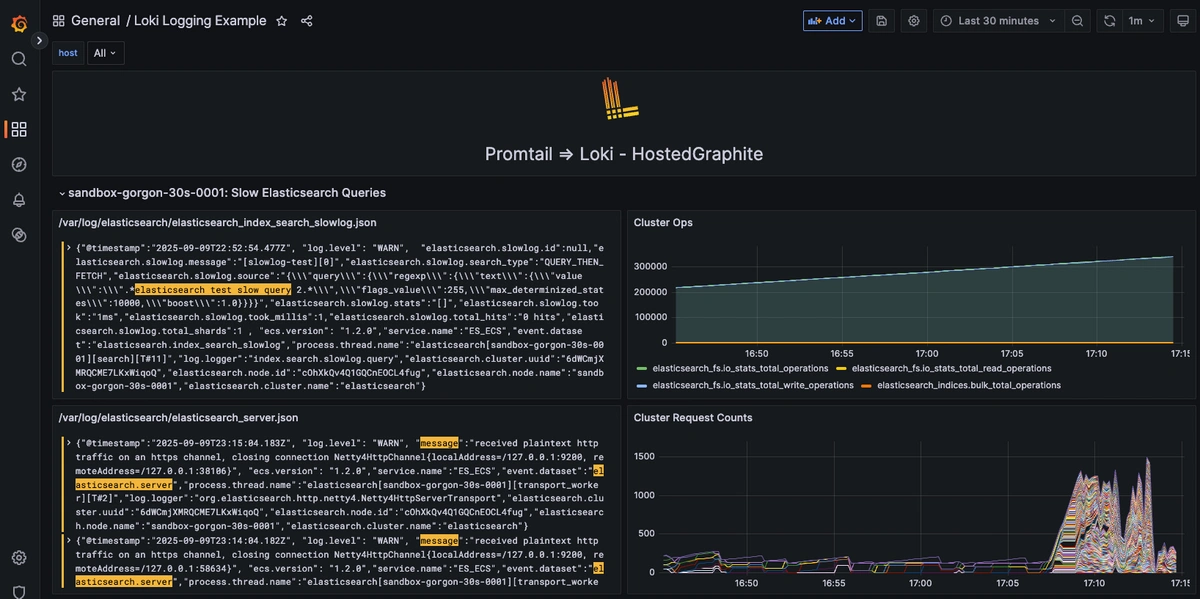
Step 5: Visualize the Slowlogs
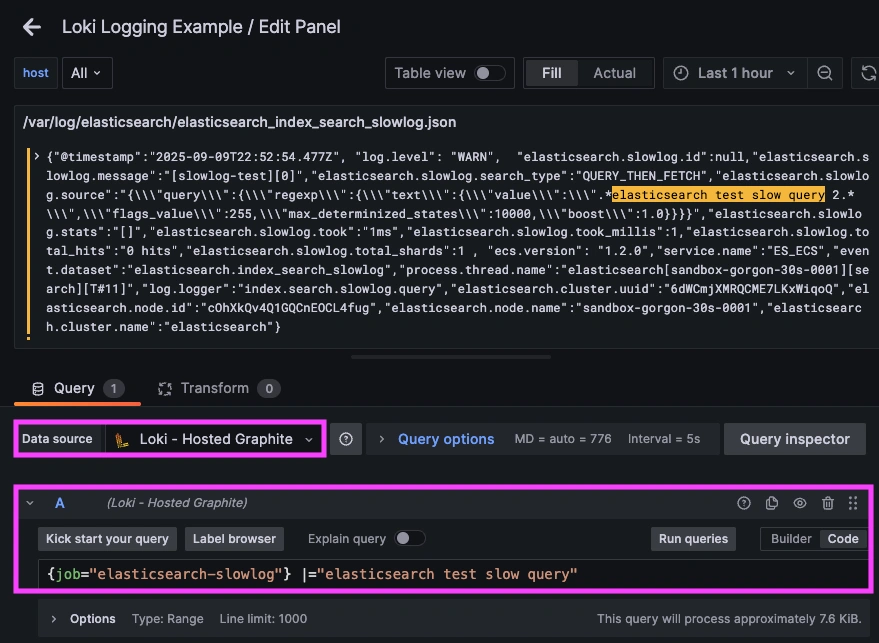
Once system logs are forwarded to our Loki endpoint and the data source is connected in your Hosted Grafana, you can create a new dashboard panel, select Loki as your Data source, and format a query using 'code mode'.
Example query for slowlogs: {job="elasticache-slowlog"}
Step 6: Configure Telegraf to Send Corresponding Elasticsearch Metrics
Setup the Telegraf Collector
If you don't already have an instance of Telegraf running in your server, install our handy HG-CLI tool to quickly install/configure Telegraf:
curl -s "https://www.hostedgraphite.com/scripts/hg-cli/installer/" | sudo sh
NOTE: You will need to input your Hosted Graphite API key, and follow the prompts to select which metric sets you want.
Once it's installed, open the Telegraf configuration file at: /etc/telegraf/telegraf.conf and add the following section (make sure to add your Elasticsearch PW):
[[inputs.elasticsearch]]
  servers = ["https://localhost:9200"]
  username = "elastic"
  password = "<PW>"
  insecure_skip_verify = true
  cluster_stats = true
  local = true
The above is a minimal configuration because Elasticsearch has a generally high cardinality of metrics that it will output. The cluster_stats = true flag gives you a cluster-wide overview, while local = true ensures you also see node-level details. Together with logs, this makes it possible to correlate spikes in query latency with underlying CPU, heap, or disk issues.
Ship Elasticsearch Metrics to Hosted Graphite
Simply save your updated conf file, and restart the Telegraf service to forward Elasticsearch performance metrics to your HG account. Or run it manually to inspect the output for potential syntax/permission errors:
telegraf --config /etc/telegraf/telegraf.conf
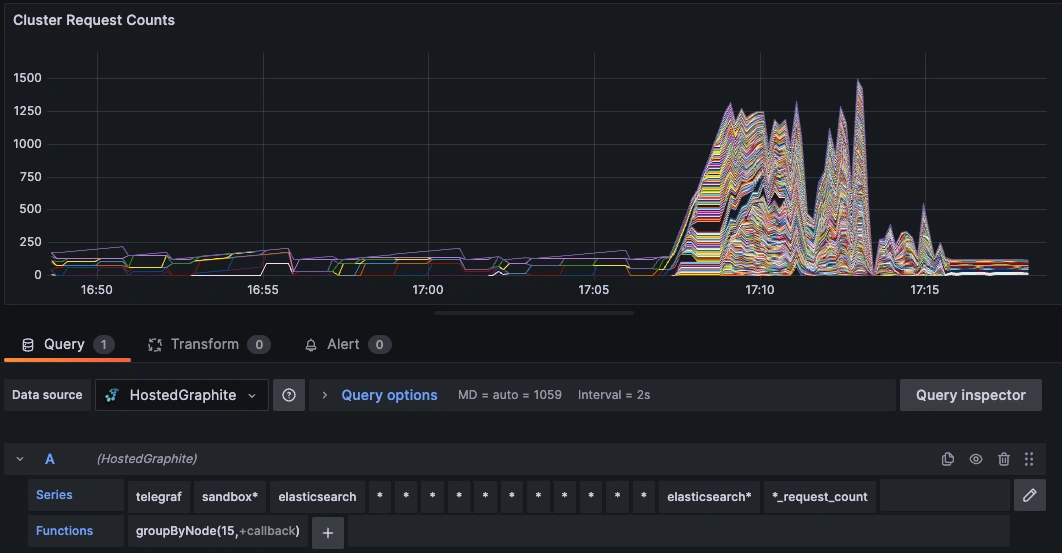
Once these metrics hit your Hosted Graphite account, you can use them to easily create custom dashboards and alerts!
Conclusion
Elasticsearch is a powerful system, but it’s only as reliable as your visibility into its performance. Slowlogs capture the exact queries that are causing bottlenecks, while metrics track the overall health of the cluster. By wiring logs into Hosted Loki and metrics into Hosted Graphite, you get both perspectives in one place. That pairing is what turns raw telemetry into actionable monitoring, helping you catch issues earlier and resolve them faster.
Ship logs alongside metrics and you’ll fix performance regressions with speed and confidence. Instead of jumping between tools or manually inspecting your server logs, you can correlate a spike in metrics with the exact log line that makes sense, all in a single dashboard.
MetricFire's Hosted Loki logging integration is quick to set up but powerful in practice. Whether you're tracking security threats, service restarts, failed jobs, or kernel anomalies, it gives you the visibility you need to stay ahead of problems and reduce the time its takes to resolve them. Reach out to the MetricFire team today and let’s build something great together!


