
Table of Contents
Great systems are not just built. They are monitored.
MetricFire runs Graphite and Grafana as a fully managed service for growing engineering teams, taking care of storage, scaling, and version updates so your team doesn't have to. Plans start at $19/month, billed per metric namespace rather than per host, and include engineer-staffed support. Integrations work natively with Heroku, AWS, Azure, and GCP, and data is stored with 3× redundancy in SOC2- and ISO:27001-certified data centres.
Introduction
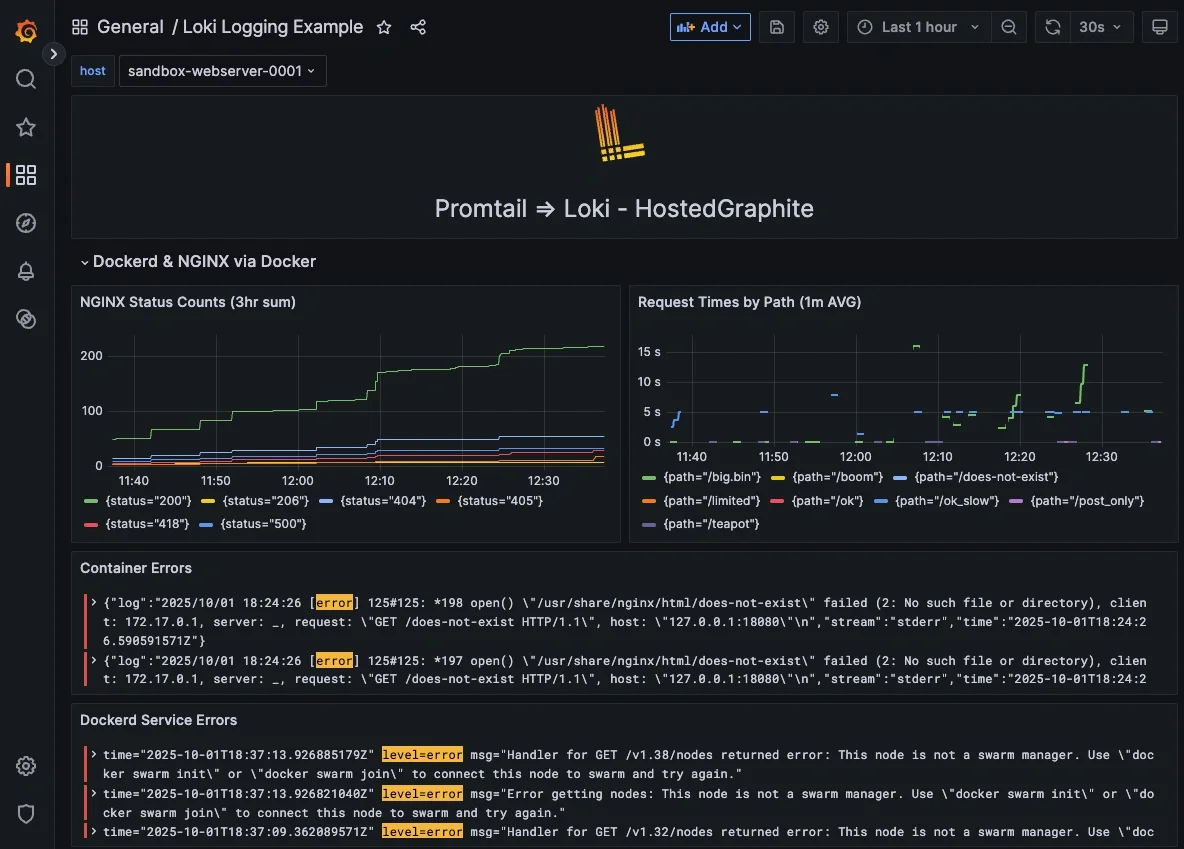
Effective monitoring catches problems before users do, and with Promtail, Loki, and LogQL, it’s a lightweight, approachable option for any DevOps team. This guide shows how to monitor Docker itself (pull failures, restarts, health flaps) so you’ve got a baseline on container runtime health. Then we take it one step further with a tiny Nginx-in-Docker example that emits clean log lines, letting you chart things like status-code counts and request times by path (two of the most useful signals for real user impact). The whole thing is quick to stand up on an Ubuntu box using Promtail and Hosted Loki, so you can go from first log line to actionable panels in minutes.
In this guide, we'll detail how to ship Docker and NGINX container logs to a Hosted Loki endpoint using Promtail and use LogQL to make useful queries in Grafana.
Start a chat with us today to test MetricFire's Logging Integration for FREE. We will help you every step of the way, from collection to visualization!
Step 1: Confirm Docker’s Log Driver and Paths
Docker must write container stdout/stderr to files that Promtail can tail. The default driver is generally json-file, and the logs should live under /var/lib/docker/containers/.../*-json.log.
sudo docker info --format 'Root={{.DockerRootDir}} LogDriver={{.LoggingDriver}}'
Expected output: Root=/var/lib/docker LogDriver=json-file
Once you have a container, this command shows its log file path:
sudo docker inspect -f '{{.LogPath}}' <container-name>
Step 2: Getting Started With Promtail
We support log collection via OpenTelemetry Contrib and Promtail. In this example, we'll detail how to configure Promtail since it is an official log shipping agent for Grafana Loki. It runs as a lightweight binary that tails log files (like /var/log/haproxy.log) and forwards them to our Hosted Loki endpoint over HTTP. (This article assumes that you are already running an instance of HAProxy that is serving traffic).
Install/unpack Promtail (Ubuntu)
wget https://github.com/grafana/loki/releases/download/v3.5.3/promtail_3.5.3_amd64.deb

sudo apt-get install -y ./promtail_3.5.3_amd64.deb
Configure Promtail to Collect and Forward Logs
In this Promtail config, we run two separate scrape jobs for clarity and signal. The docker-json job tails Docker’s own *-json.log files (container stdout/stderr) so you can query real app behavior like status codes, request times, and errors straight from each container. The dockerd job reads journald for docker.service and containerd.service, surfacing engine-level events like image pull failures, restart loops, and health-check flaps, so you can see platform issues alongside your app logs without shipping the entire system journal. Update your Promtail configuration file at /etc/promtail/config.yml to include the following:
server:
  http_listen_port: 9080
  grpc_listen_port: 0

positions:
  filename: /var/lib/promtail/positions.yaml

clients:
  - url: "https://<YOUR-API-KEY>@www.hostedgraphite.com/logs/sink"

scrape_configs:
  # Docker containers (json-file)
  - job_name: docker-json
    static_configs:
      - labels:
          host: <HOSTNAME>
          job: docker-json
          __path__: /var/lib/docker/containers/*/*-json.log

  # Docker engine & containerd (journald)
  - job_name: dockerd
    journal:
      max_age: 12h
      labels:
        host: <HOSTNAME>
        job: dockerd
    relabel_configs:
      - source_labels: ['__journal__systemd_unit']
        regex: 'docker\.service|containerd\.service'
        action: keep
NOTE: Make sure to replace YOUR-API-KEY and HOST-NAME in the above config and restart the Promtail service:
sudo systemctl restart promtail
sudo systemctl status promtail
Step 3: Create a Loki Data Source in our Hosted Grafana
REACH OUT TO US about trying our new Logging feature for FREE, and we will create a Loki Access Key in your Hosted Graphite account. If you don't already have a Hosted Graphite account, sign up for a free trial here to obtain a Hosted Graphite API key and Loki Access Key.
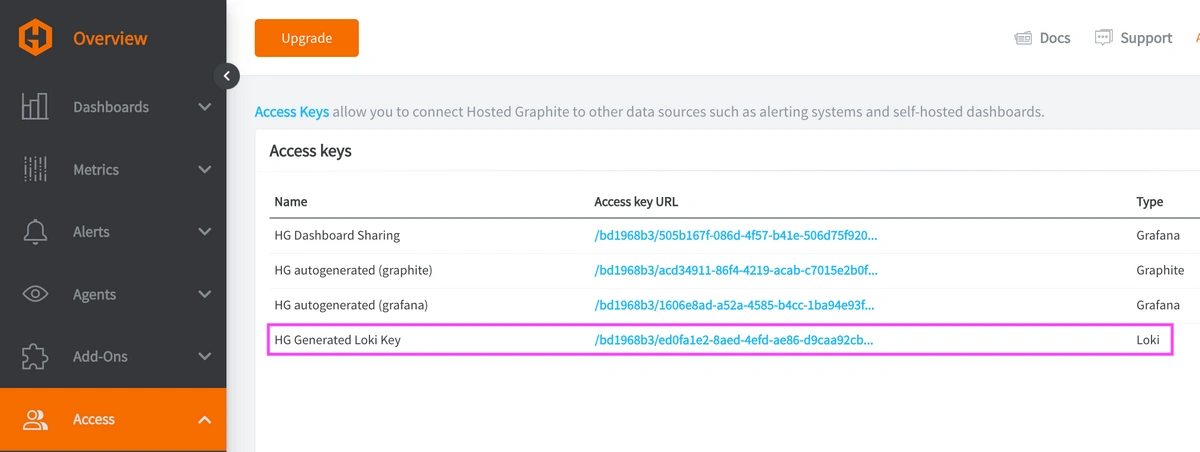
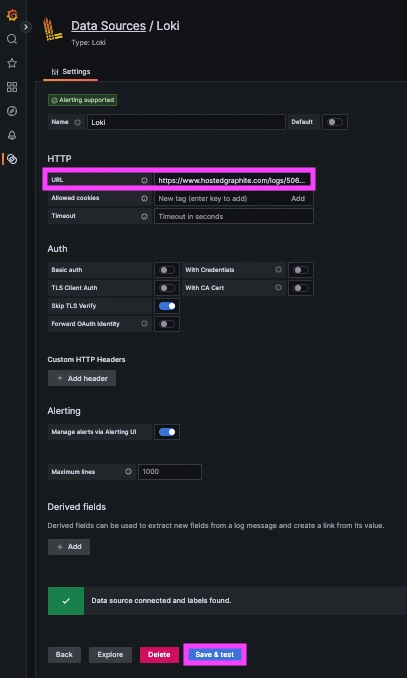
Now, within the Hosted Graphite UI, navigate to Dashboards > Settings > Data sources > Add New Data source (Loki). You'll be able to add the URL for your HG Loki endpoint, which includes your new Loki Access Key: https://www.hostedgraphite.com/logs/<UID>/<LOKI-ACCESS-KEY>
Step 4: Monitor the Docker Engine
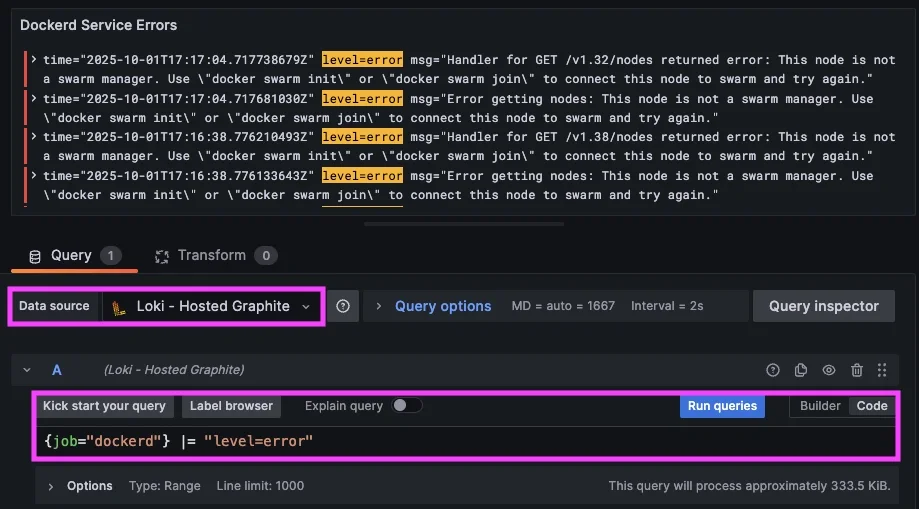
Docker logs will display important occurrences, such as pull errors, connectivity issues, and health flaps. These are great early-warning signals to track on your dashboards:
- LogQL query that displays error lines: {job="dockerd"} |= "level=error"
- Query that sums pull failures: sum(count_over_time(({job="dockerd"} |~ "failed to pull|pull access denied|not found")[1h]))
- Query that sums service/container start failures: sum(count_over_time(({job="dockerd"} |~ "failed to start|driver failed programming external connectivity")[1h]))
- Query that sums failed health checks: sum(count_over_time(({job="dockerd"} |~ "unhealthy|health check failed")[1h]))
Step 5: Create an NGINX Container in Docker
In this step, we spin up a small NGINX container and replace the stock config with a single server block that writes clear access logs (status=…, request_time=…). Then we add a few test routes (200/404/418/500) plus server-paced downloads so you can generate predictable slow requests on demand. The goal here is to produce clean, repeatable log lines from a real service, making it easy to validate log ingestion and build useful Loki panels.
Create the container on an available port:
sudo docker run -d --name web -p 18080:80 nginx:alpine
Remove the stock server so your test server is the only one:
sudo docker exec web sh -c 'rm -f /etc/nginx/conf.d/default.conf'
Write your test config:
sudo docker exec -i web sh -c 'cat > /etc/nginx/conf.d/test.conf' <<'EOF'
limit_req_zone $binary_remote_addr zone=one:10m rate=2r/s;
log_format mf 'status=$status request="$request" request_time=$request_time bytes=$body_bytes_sent';

server {
  listen 80 default_server;
  server_name _;
  root /usr/share/nginx/html;
  access_log /var/log/nginx/access.log mf;

  location = /ok      { return 200 "ok\n"; add_header Content-Type text/plain; }
  location = /boom    { return 500; }
  location = /teapot  { return 418; }

  # POST-only endpoint -> 405 on non-POST
  location = /post_only {
    if ($request_method != POST) { return 405; }
    return 200 "posted\n";
  }

  # Server-paced download so $request_time reflects wall time
  location = /big.bin {
    sendfile off;
    limit_rate 200k;
    try_files /big.bin =404;
    types { application/octet-stream bin; }
    default_type application/octet-stream;
  }

  # Another explicit slow path
  location = /ok_slow {
    sendfile off;
    limit_rate 200k;
    try_files /slow1m.bin =404;
    types { application/octet-stream bin; }
    default_type application/octet-stream;
  }
}
EOF
Ensure the files exist, test, and reload the service:
sudo docker exec web sh -c 'test -f /usr/share/nginx/html/big.bin || dd if=/dev/zero of=/usr/share/nginx/html/big.bin bs=1M count=10 status=none'
sudo docker exec web sh -c 'test -f /usr/share/nginx/html/slow1m.bin || dd if=/dev/zero of=/usr/share/nginx/html/slow1m.bin bs=1M count=1 status=none'
sudo docker exec web nginx -t && sudo docker exec web nginx -s reload
Generate a Spread of Statuses to Multiple Endpoints
# 200s
for i in {1..5};  do curl -sS -o /dev/null -w "%{http_code}\n" http://127.0.0.1:18080/ok; done

# 404s
for i in {1..5};  do curl -sS -o /dev/null -w "%{http_code}\n" http://127.0.0.1:18080/does-not-exist; done

# 500s / 418s
for i in {1..3};  do curl -sS -o /dev/null -w "%{http_code}\n" http://127.0.0.1:18080/boom; done
for i in {1..2};  do curl -sS -o /dev/null -w "%{http_code}\n" http://127.0.0.1:18080/teapot; done

# 405 then 200
curl -sS -o /dev/null -w "%{http_code}\n" http://127.0.0.1:18080/post_only
curl -sS -o /dev/null -w "%{http_code}\n" -X POST http://127.0.0.1:18080/post_only
Force Some Slow Requests
curl -s -o /dev/null -w 'code=%{http_code} total=%{time_total}s\n' http://127.0.0.1:18080/big.bin
curl -s -o /dev/null -w 'code=%{http_code} total=%{time_total}s\n' http://127.0.0.1:18080/ok_slow
Step 6: Visualize NGINX Performance in Hosted Grafana
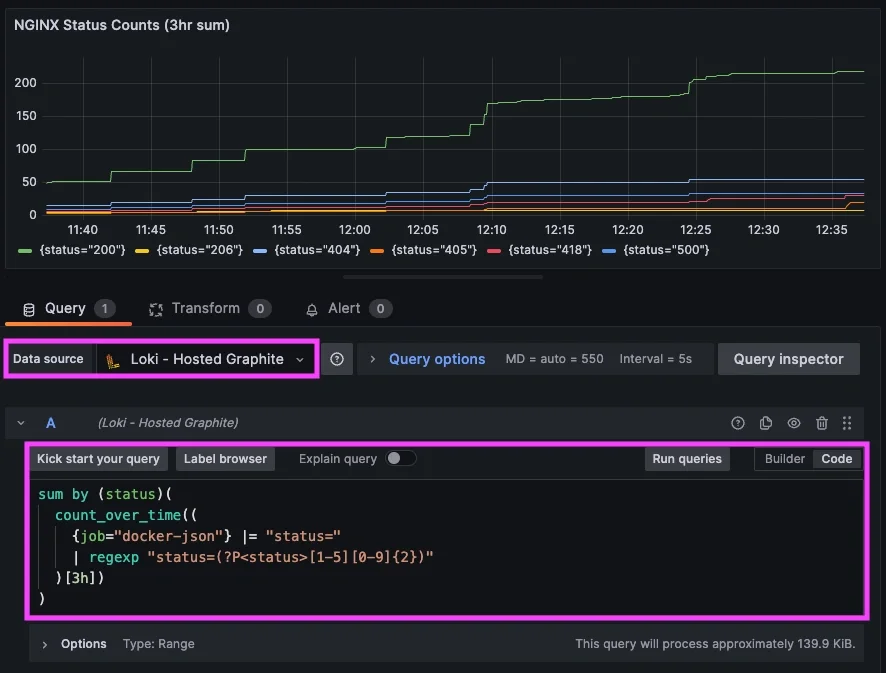
With logs now shipping to your Hosted Grafana Loki data source, we’ll turn raw Nginx lines into actionable panels. Using a few copy-paste LogQL queries that extract status= and request_time=, you can easily build panels for status-code count and per-path timing.
LogQL query that sums statuses over 1 hour:
sum by (status)(
  count_over_time((
    {job="docker-json"} |= "status="
    | regexp "status=(?P<status>[1-5][0-9]{2})"
  )[1h])
)
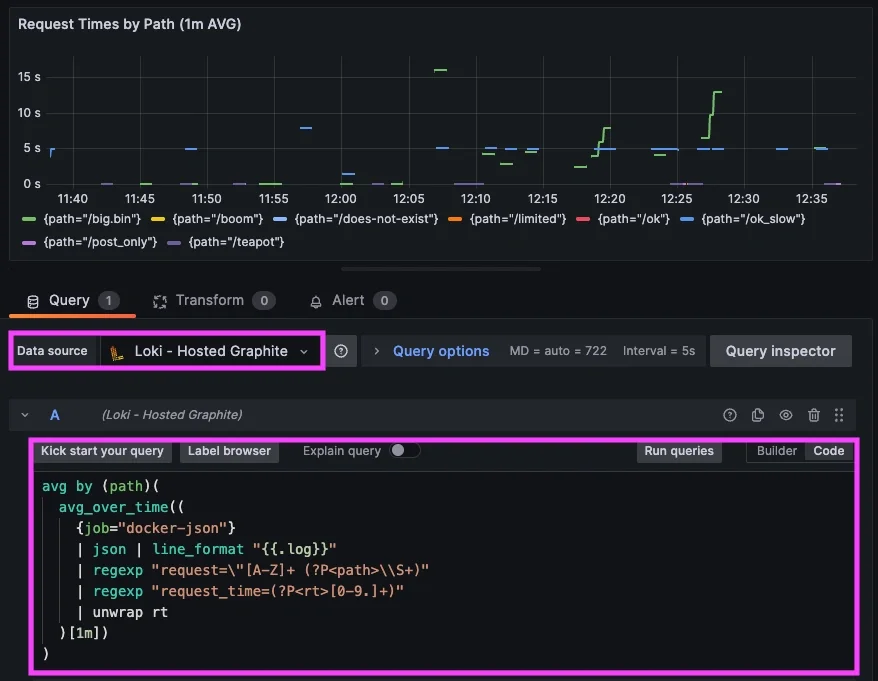
Query that averages request times by path:
avg by (path)(
  avg_over_time((
    {job="docker-json"}
    | json | line_format "{{.log}}"
    | regexp "request=\"[A-Z]+ (?P<path>\\S+)"
    | regexp "request_time=(?P<rt>[0-9.]+)"
    | unwrap rt
  )[1m])
)
Conclusion
For any SaaS business, this kind of log-centric monitoring is the difference between “we think it’s fine” and “we know what broke, where, and how bad.” Monitoring with logs provides the truth about who hit what, how long it took, and whether the response was successful or an error. This approach cuts time to detect and repair, protects SLA commitments, and keeps support queues (and churn) down. Just as important, it makes development safer because you can do things like ship an optimization and watch request times drop, then roll out a feature and confirm 5xx doesn’t spike. This simple Docker => Nginx => Promtail => Hosted Loki pattern can scale from a single node to fleets, and it gives your team a common language to prioritize fixes and prove impact.
MetricFire's Hosted Loki logging integration is quick to set up but powerful in practice. Whether you're tracking security threats, service issues, failed jobs, or kernel anomalies, it gives you the visibility you need to stay ahead of problems and reduce the time it takes to resolve them. Reach out to the MetricFire team today and let’s build something great together!

