
Table of Contents
Great systems are not just built. They are monitored.
MetricFire runs Graphite and Grafana as a fully managed service for growing engineering teams, taking care of storage, scaling, and version updates so your team doesn't have to. Plans start at $19/month, billed per metric namespace rather than per host, and include engineer-staffed support. Integrations work natively with Heroku, AWS, Azure, and GCP, and data is stored with 3× redundancy in SOC2- and ISO:27001-certified data centres.
Introduction
Redis earns its place in modern stacks because it’s an in-memory data store with microsecond latency and rich data structures, making it perfect for things like caching, sessions, and rate limiting. Since it often sits on the request path, small issues (connection churn, blocked commands, memory pressure) can quickly ripple into user-visible incidents. Monitoring Redis performance lets you catch early signals like misses, evictions, replication lag, and unexpected restarts before they snowball into something bigger. With a few lightweight logs and metrics, you can tie symptoms to concrete events and keep your application snappy.
In this guide, we will detail how to collect metrics and logs from a Redis instance and visualize them together for complete performance observability.
Start a chat with us today if you are interested in testing MetricFire's Logging Integration for FREE. We will help you every step of the way, from collection to visualization!
Step 1: Getting Started With Redis
This article assumes that you are already running an instance of Redis, but if not, here is how you can get up and running quickly (Ubuntu) so you can follow along with our examples.
Install and Enable
sudo apt-get update
sudo apt-get install -y redis-server
sudo systemctl enable --now redis-server
sudo systemctl status redis-server
Redis should now be running, ready to accept connections, and outputting logs to the default path of: /var/log/redis/redis-server.log. You can quickly test this by executing the following command and tailing it in the redis-server.log file:
redis-cli BGSAVE
sudo tail -n 20 /var/log/redis/redis-server.log
Step 2: Install and Configure Promtail to Collect System Logs
MetricFire supports log collection via OpenTelemetry Contrib and Promtail. In this example, we'll detail how to configure Promtail since it is an official log shipping agent for Grafana Loki. It runs as a lightweight binary that tails log files (like /var/log/*) and forwards them to our Hosted Loki endpoint over HTTP.
Install/unpack Promtail (Ubuntu)
wget https://github.com/grafana/loki/releases/download/v3.5.3/promtail_3.5.3_amd64.deb

sudo apt-get install -y ./promtail_3.5.3_amd64.deb
Configure Promtail to Forward Redis Logs
Update your Promtail configuration file at /etc/promtail/config.yml to include the following (make sure to replace YOUR-API-KEY and HOST-NAME):
server:
  http_listen_port: 9080
  grpc_listen_port: 0

positions:
  filename: /tmp/positions.yaml

clients:
  - url: https://<YOUR-API-KEY>@www.hostedgraphite.com/logs/sink

scrape_configs:
- job_name: redis
  static_configs:
    - targets:
        - localhost
      labels:
        host: <host-name>
        job: redis
        __path__: /var/log/redis/*.log
Restart Promtail
sudo systemctl restart promtail
sudo systemctl status promtail
Step 3: Create a Loki Data Source in our Hosted Grafana
REACH OUT TO US about trying our new Logging feature for FREE, and we will create a Loki Access Key in your Hosted Graphite account. If you don't already have a Hosted Graphite account, sign up for a free trial here to obtain a Hosted Graphite API key and Loki Access Key.
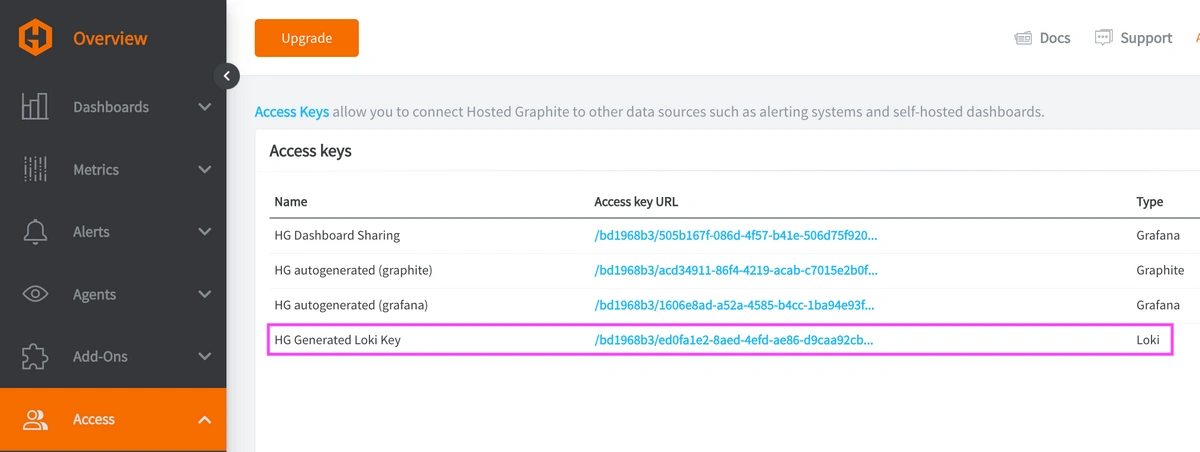
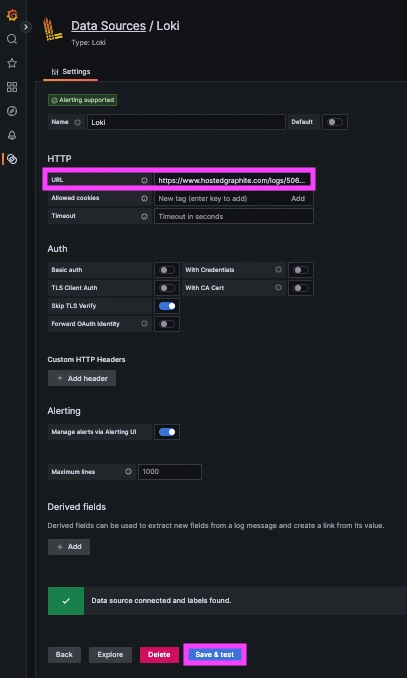
Now, within the Hosted Graphite UI, you can navigate to Dashboards => Settings => Data sources => Add New Data source (Loki). You'll be able to add the URL for your HG Loki endpoint, which includes your new Loki Access Key: https://www.hostedgraphite.com/logs/<UID>/<LOKI-ACCESS-KEY>
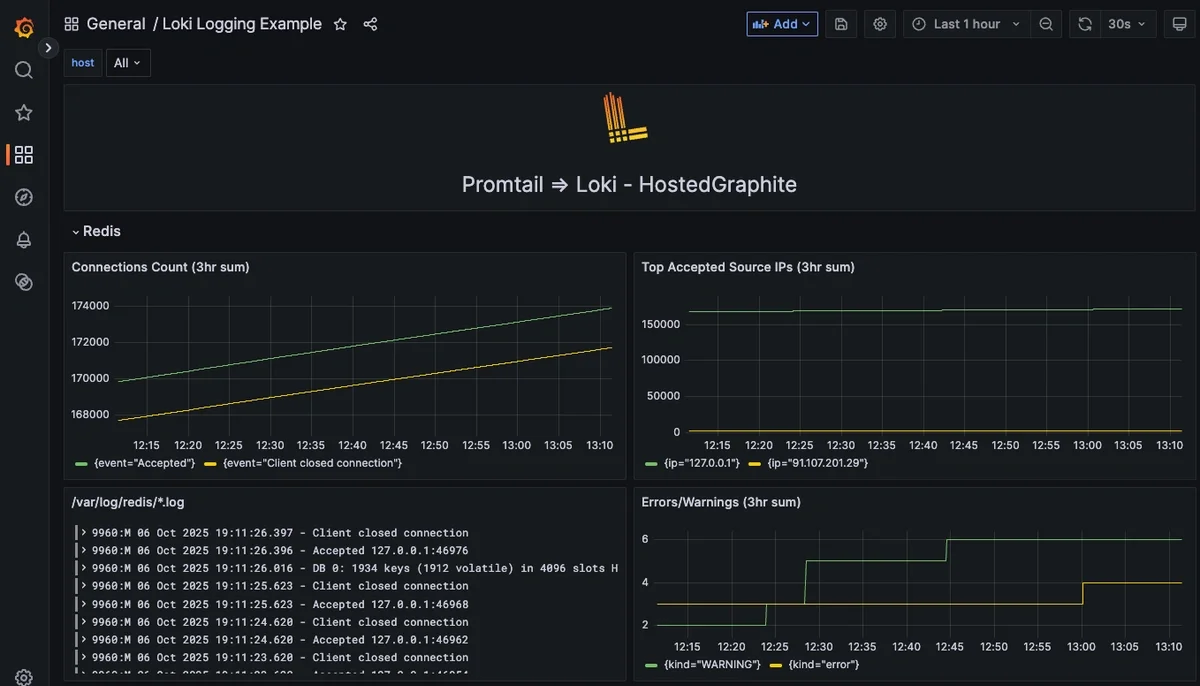
Step 4: Visualize Redis Logs and Build LogQL Queries
Once system logs are forwarded to our Loki endpoint and the data source is connected in your Hosted Grafana, you can create a new dashboard panel, select Loki as your Data source, and format a query using 'code mode'.
Example query to visualize raw redis-server logs: {job="redis"}
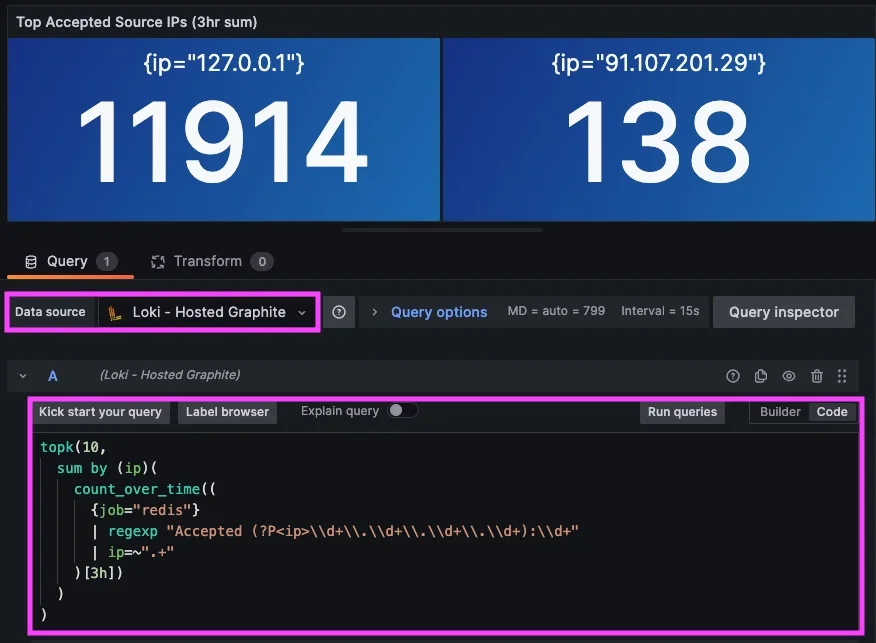
Example LogQL query to see a summed count of Top connections by IP:
topk(10,
  sum by (ip)(
    count_over_time((
      {job="redis"}
      | regexp "Accepted (?P<ip>\\d+\\.\\d+\\.\\d+\\.\\d+):\\d+"
      | ip=~".+"
    )[3h])
  )
)
Example query to see a summed count of Accepted/Closed connections:
sum by (event)(
  count_over_time((
    {job="redis"}
    | regexp "(?P<event>Accepted|Client closed connection)"
    | event=~".+"
  )[3h])
)
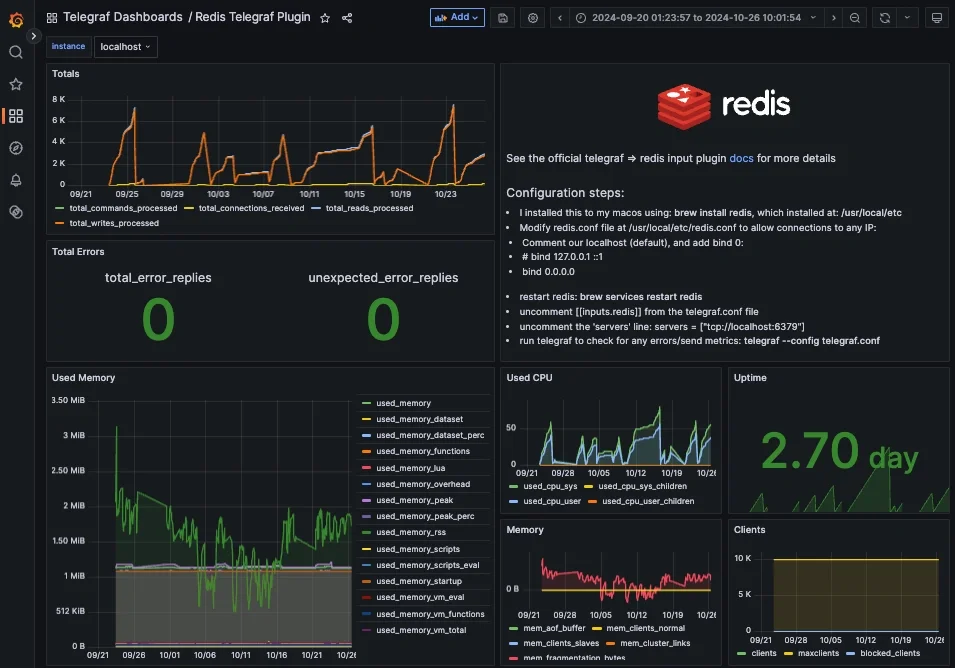
Step 5: Configure Telegraf to Send Corresponding Redis Metrics
Set up the Telegraf Collector
If you don't already have an instance of Telegraf running on your server, install our handy HG-CLI tool to quickly install/configure Telegraf:
curl -s "https://www.hostedgraphite.com/scripts/hg-cli/installer/" | sudo sh
NOTE: You will need to input your Hosted Graphite API key and follow the prompts to select which metric sets you want.
Once it's installed, open the Telegraf configuration file at: /etc/telegraf/telegraf.conf and add the following section:
[[inputs.redis]]
  servers = ["tcp://localhost:6379"]
Ship Redis Metrics to Hosted Graphite
Simply save your updated conf file, and restart the Telegraf service to forward Redis performance metrics to your HG account. Or run Telegraf manually to inspect the output for potential syntax/permission errors:
telegraf --config /etc/telegraf/telegraf.conf
Once these metrics hit your Hosted Graphite account, you can use them to create custom dashboards and alerts!
Conclusion
In production, Redis often sits in the hot path for caches, sessions, queues, and rate limits, meaning small hiccups can cascade into user-visible latency. Watching metrics tells you what is out of bounds, but the logs tell you why. Visualizing Redis logs alongside metrics gives you insight into trends and root cause under a single pane of glass. This way, you can prove fixes and tune thresholds while keeping extra headroom as usage grows. It’s the difference between noticing a problem and explaining it.
Ship logs alongside metrics and you’ll fix performance regressions with speed and confidence. Instead of jumping between tools or manually inspecting your server logs, you can correlate a spike in metrics with the relevant log line, all in a single dashboard.
MetricFire's Hosted Loki logging integration is quick to set up but powerful in practice. Whether you're tracking security threats, service restarts, failed jobs, or kernel anomalies, it gives you the visibility you need to stay ahead of problems and reduce the time it takes to resolve them. Reach out to the MetricFire team today and let’s build something great together!

