
Table of Contents
Great systems are not just built. They are monitored.
MetricFire runs Graphite and Grafana as a fully managed service for growing engineering teams, taking care of storage, scaling, and version updates so your team doesn't have to. Plans start at $19/month, billed per metric namespace rather than per host, and include engineer-staffed support. Integrations work natively with Heroku, AWS, Azure, and GCP, and data is stored with 3× redundancy in SOC2- and ISO:27001-certified data centres.
Introduction
Grafana’s MySQL datasource makes it easy to turn raw database rows into clean, interactive dashboards. Whether you're testing out a new monitoring setup or experimenting with time-series data, MySQL + Grafana gives you a powerful foundation for building visualizations quickly. In this short guide, we’ll walk through:
-
Installing and configuring MySQL on Ubuntu (quick + minimal steps)
-
Creating sample CPU, Memory, and Disk metrics
-
Setting up a Grafana MySQL datasource
-
Using a query that renders all three metrics in a single panel
Don't have Grafana yet? Sign up for MetricFire's free trial to try it out and follow along with this tutorial!
Spin Up a Fresh Instance of MySQL (ubuntu)
Installation Steps
Update and install:
sudo apt update
sudo apt install mysql-server -y
Start and enable MySQL:
sudo systemctl enable --now mysql
Secure the install (recommended):
sudo mysql_secure_installation
You can safely answer YES to all prompts in a test environment.
Configuration Steps for Grafana Access (Testing Mode)
These steps intentionally use loose permissions to make Grafana connectivity easy for this demo (do not use these settings in production), and allows Grafana to connect from any IP address.
Allow MySQL to Listen Externally
Edit the config generally located at: /etc/mysql/mysql.conf.d/mysqld.cnf
Locate: bind-address = 127.0.0.1
Replace with: bind-address = 0.0.0.0
Restart MySQL
sudo systemctl restart mysql
Open Port 3306 in UFW
sudo ufw allow 3306/tcp
sudo ufw reload
Create a Grafana User With Full Access (Testing Only)
Login:
sudo mysql
Run:
CREATE DATABASE testdb;

CREATE USER 'grafana_user'@'%' IDENTIFIED BY 'your_password';
GRANT ALL PRIVILEGES ON testdb.* TO 'grafana_user'@'%';
FLUSH PRIVILEGES;
Inject Sample Data
This sample dataset makes it easy to build your first time-series graph. First, switch to your test database:
USE testdb;
Create the metrics table:
CREATE TABLE sample_data (
    id INT AUTO_INCREMENT PRIMARY KEY,
    name VARCHAR(255) NOT NULL,
    value INT NOT NULL,
    created_at TIMESTAMP DEFAULT CURRENT_TIMESTAMP
);
Insert data:
INSERT INTO sample_data (name, value) VALUES
  ('CPU Load', 42),
  ('Memory Usage', 8000),
  ('Disk Space', 380);
Visualize Your Sample Data in Grafana
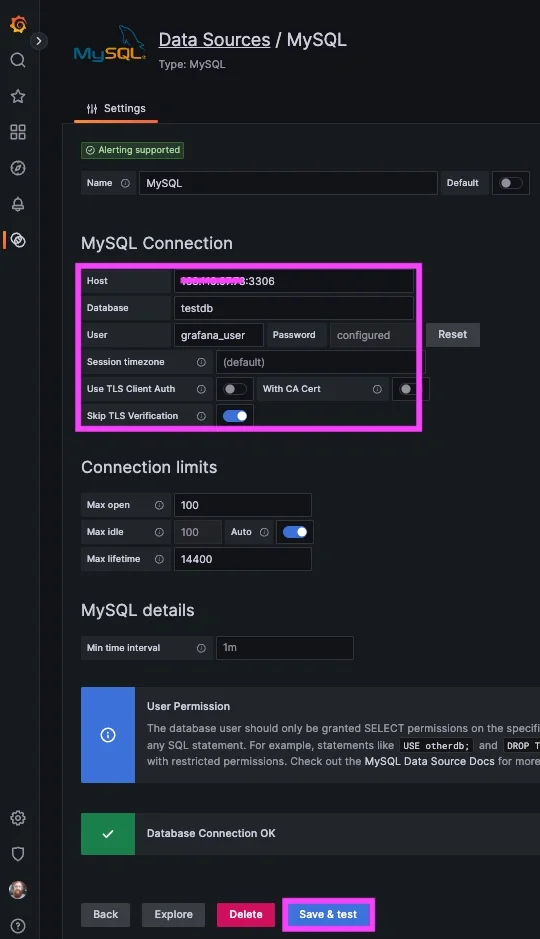
Configure the MySQL Data Source
- Navigate to your Grafana instance => Connect Data => search/select MySQL
- Enter Details:
- Host:
<mysql_server_ip>:3306 - Database:
testdb - User:
grafana_user - Password:
your_password
- Host:
- Set SSL Mode:
disable - Click "Save & Test"
Again, when allowing remote connections to a production DB, you should always use SSL certificates and can reference our related article HERE.
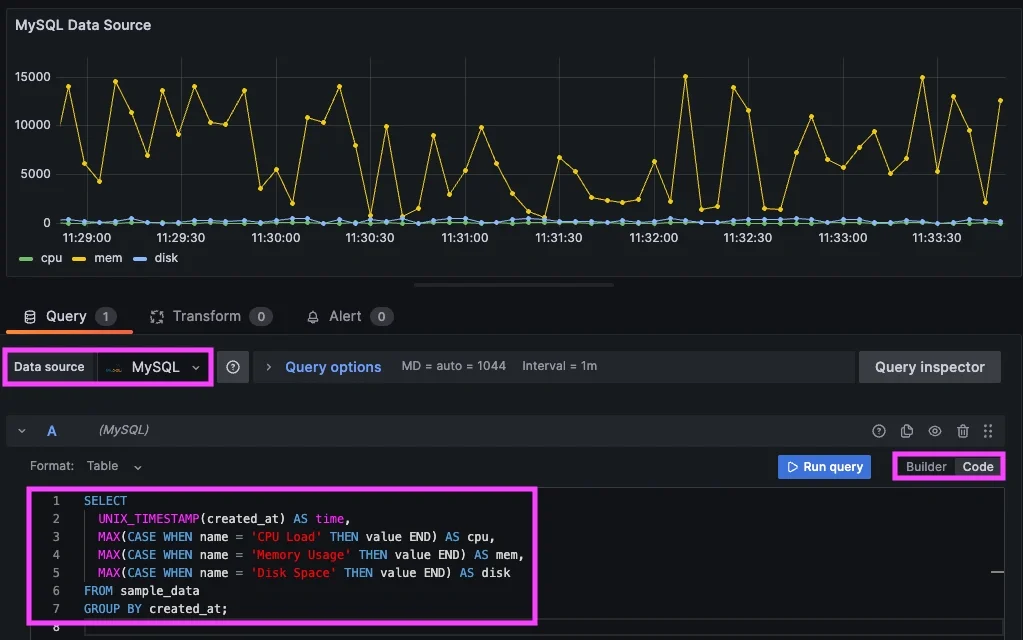
Create a Grafana Dashboard Panel
In your instance of Grafana, go to => Dashboards => New Dashboard => "Add a new panel"
Select your new MySQL Datasource, select the Code option, and enter a Query for your sample data:
SELECT
  UNIX_TIMESTAMP(created_at) AS time,
  MAX(CASE WHEN name = 'CPU Load' THEN value END) AS cpu,
  MAX(CASE WHEN name = 'Memory Usage' THEN value END) AS mem,
  MAX(CASE WHEN name = 'Disk Space' THEN value END) AS disk
FROM sample_data
GROUP BY created_at;
Then 'Run' the query to see any values you've injected into your MySQL testdb:
Conclusion
MySQL often sits at the heart of critical business applications, from internal reporting tools and customer portals to transaction systems and analytics pipelines. When the database slows down, everything built on top of it slows down with it. That’s why monitoring MySQL performance is foundational to keeping operations running smoothly. Visualizing key MySQL metrics in Grafana gives teams real-time insight into query performance, resource usage, storage trends, and potential bottlenecks before they affect end users. With clear dashboards and reliable alerting, organizations can troubleshoot issues faster, make smarter capacity decisions, and ensure their workflows remain efficient.
Sign up for the free trial and begin monitoring your infrastructure today. You can also book a demo and talk to the MetricFire team directly about your monitoring needs.

