

Table of Contents
Great systems are not just built. They are monitored.
MetricFire runs Graphite and Grafana as a fully managed service for growing engineering teams, taking care of storage, scaling, and version updates so your team doesn't have to. Plans start at $19/month, billed per metric namespace rather than per host, and include engineer-staffed support. Integrations work natively with Heroku, AWS, Azure, and GCP, and data is stored with 3× redundancy in SOC2- and ISO:27001-certified data centres.
Introduction
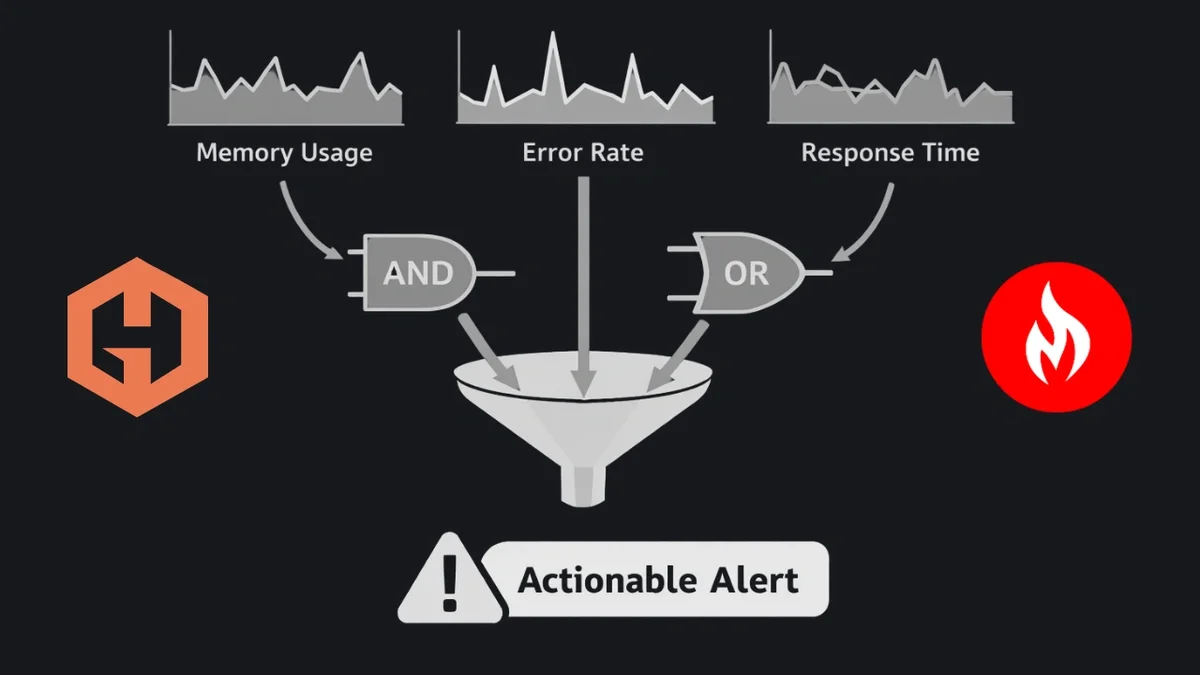
Traditional alerts are simple by design: if a metric crosses a threshold, fire an alert. While that simplicity makes alerts easy to configure, it also leads to alert noise, because single metrics rarely tell the full story and often trigger during non-actionable conditions.
Hosted Graphite Composite Alerts solve this by allowing you to combine multiple alert conditions using logical expressions like AND (&&) and OR (||). Instead of alerting on symptoms in isolation, you can alert on meaningful combinations of signals that indicate real user impact. In this post, we’ll walk through several practical composite alert examples using easy-to-collect metrics from:
- Heroku
- NGINX
- PostgreSQL
- Disk Usage
We’ll also look at a few theoretical examples for other common services.
What Are Composite Alerts?
Composite alerts allow a single alert to evaluate multiple metrics and trigger only when a logical expression evaluates to true.
At a high level:
- Each metric has its own alert criteria
- Each criteria is assigned a label (a, b, c), which can be referenced in the alert expression
- An and/or expression defines how those criteria are evaluated together
Example 1: a && b
- This alert only fires when both conditions are true.
Example 2: (a && b) || c
- This alert only fires when a AND b are true OR c is true.
NOTE: Composite alerts can be created and updated via the Hosted Graphite Alerts UI, as well as the Hosted Graphite Alerts API.
Composite Alert Curl Example:
curl -H "Content-Type: application/json" -X POST -d \
'{
  "name": "Composite Alert Example",
  "metric": "<your.alerting.metric>",
  "alert_criteria": {
    "type": "above",
    "above_value": 100,
    "time_period": 10
  },
  "additional_criteria": {
    "b": {
      "type": "above",
      "below_value": 10,
      "metric": "<your.secondary.metric>",
      "time_period": 10
    }
  },
  "expression": "a && b",
  "notification_channels": ["channel_id1", "channel_name1", "channel_id2"],
  "notification_type": "state_change" | ["state_change"] | ["every", 123],
  "info": "string"
}' \
"https://<YOUR-API-KEY>@api.hostedgraphite.com/v2/alerts/"
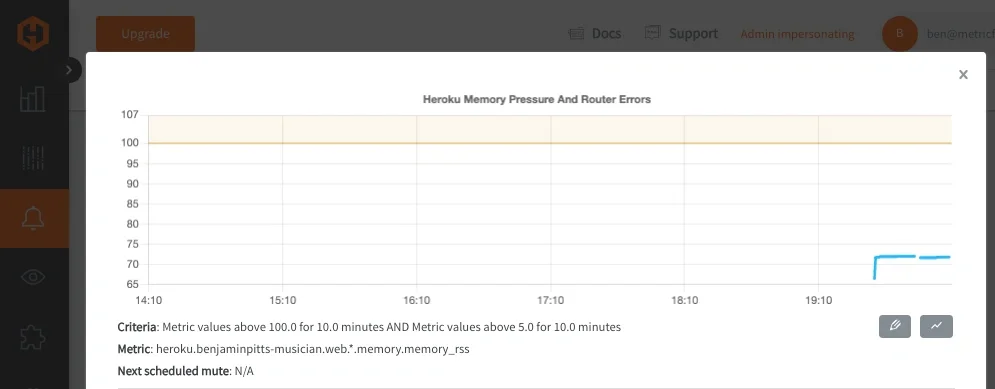
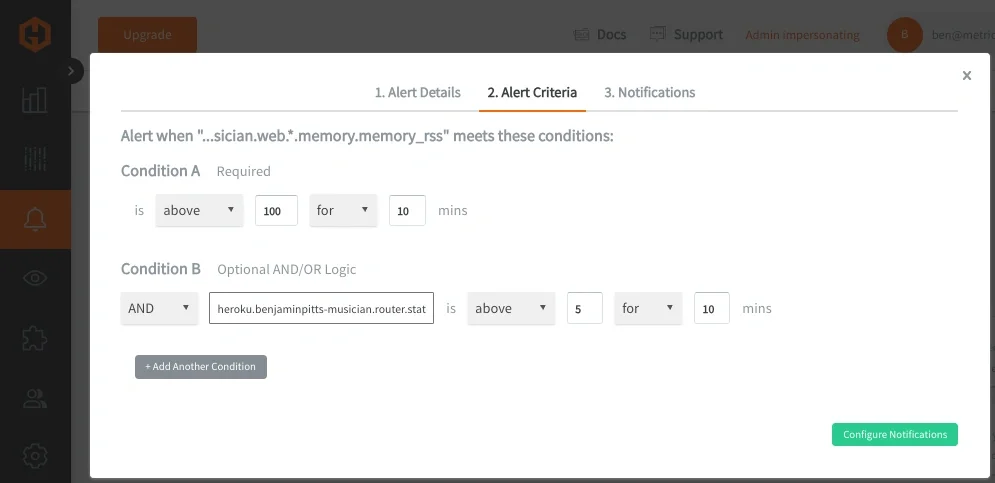
Heroku: Memory Pressure AND Router Errors
Heroku dynos frequently experience transient memory growth or brief router errors, neither of which always requires action. But when memory pressure coincides with user-facing errors, it’s a strong signal that the application is unhealthy. The metrics used below are real examples of metrics collected when you configure the Heroku integration or enable the Heroku Marketplace Hosted Graphite Add-on.
Dyno memory usage:
- heroku.<app-name>.web.<dyno>.memory.memory_rss
Router 5XX errors:
- heroku.<app-name>.router.status.503
Alert logic:
- A: Dyno memory usage is above a safe threshold
- B: Router is returning 503 errors
- Expression: A && B
Composite alert JSON example:
{
  "name": "Heroku dyno memory pressure with router errors",
  "metric": "heroku.<app-name>.web.*.memory.memory_rss",
  "alert_criteria": {
    "type": "above",
    "above_value": 200,
    "time_period": 10
  },
  "additional_criteria": {
    "b": {
      "type": "above",
      "above_value": 5,
      "metric": "heroku.<app-name>.router.status.5*",
      "time_period": 10
    }
  },
  "expression": "a && b"
}
This is a useful type of alert because memory usage alone can spike during GC or traffic bursts, and router 5XXs alone can occur during deploys.
Both together usually indicate degraded application performance affecting users.
NGINX: Sustained Traffic AND Request Processing Load
NGINX metrics are often noisy when viewed individually. Active connections can be high without issues, and request handling metrics fluctuate constantly. Combining them allows you to detect sustained, meaningful load rather than brief spikes. The metrics used below are real examples of metrics collected when you configure the NGINX Telegraf Input plugin.
Active connections:
- telegraf.<host>.<port>.<instance>.nginx.active
Requests being written:
- telegraf.<host>.<port>.<instance>.nginx.writing
Alert logic:
- A: Active connections are high
- B: NGINX is actively writing many responses
- Expression: A && B
Composite alert JSON example:
{
  "name": "NGINX sustained load under active traffic",
  "metric": "telegraf.<host>.*.*.nginx.active",
  "alert_criteria": {
    "type": "above",
    "above_value": 200,
    "time_period": 10
  },
  "additional_criteria": {
    "b": {
      "type": "above",
      "above_value": 50,
      "metric": "telegraf.<host>.*.*.nginx.writing",
      "time_period": 10
    }
  },
  "expression": "a && b"
}
This is a useful alert because high connection counts alone may be normal, and high write activity alone may be short-lived.
Both together indicate sustained load that may require scaling or investigation.
PostgreSQL: Connection Pressure AND Disk Read Latency
PostgreSQL performance issues are often caused by a combination of connection saturation and slow disk access. Alerting on either metric alone can generate noise; combining them creates a much more actionable signal. The metrics used below are real examples of metrics collected when you configure the PostgreSQL Telegraf Input plugin.
Active connections:
- telegraf.<host>.postgres.host=<db_host>_user=<db_user>_.postgresql.numbackends
Block read time:
- telegraf.<host>.postgres.host=<db_host>_user=<db_user>_.postgresql.blk_read_time
Alert logic:
- A: Number of active database connections is high
- B: Disk read latency is elevated
- Expression: A && B
Composite alert JSON example:
{
  "name": "PostgreSQL connection saturation with disk latency",
  "metric": "telegraf.<host>.postgres.host=*_user=*_.postgresql.numbackends",
  "alert_criteria": {
    "type": "above",
    "above_value": 80,
    "time_period": 10
  },
  "additional_criteria": {
    "b": {
      "type": "above",
      "above_value": 50,
      "metric": "telegraf.<host>.postgres.host=*_user=*_.postgresql.blk_read_time",
      "time_period": 10
    }
  },
  "expression": "a && b"
}
This is a useful composite alert because high connection counts alone don’t always indicate a problem, and disk latency spikes can occur during maintenance.
Both together often correlate with slow queries and user-facing latency.
Disk: Capacity OR Inode Exhaustion
Disk-related incidents often present in multiple ways. A filesystem might become unavailable because it’s nearly full, because free space has dropped below a safe minimum, or because inode exhaustion prevents new files from being created. Any one of these conditions is serious enough to warrant immediate attention.
This composite alert uses OR logic to trigger when any critical disk capacity condition is detected, ensuring broad coverage without requiring multiple separate alerts. The metrics used below are real examples of metrics collected when you install the Telegraf agent on any OS.
Disk space used (%):
- telegraf.<host>.<disk>.<fstype>.<mode>.<mount>.disk.used_percent
Disk free space:
- telegraf.<host>.<disk>.<fstype>.<mode>.<mount>.disk.free
Inodes used (%):
- telegraf.<host>.<disk>.<fstype>.<mode>.<mount>.disk.inodes_used_percent
Alert logic:
- A: Disk usage is critically high
- B: Free disk space is critically low
- C: Inodes are critically high
Composite alert JSON example:
{
  "name": "Disk capacity or inode exhaustion detected",
  "metric": "telegraf.<host>.disk*.*.*.*.disk.used_percent",
  "alert_criteria": {
    "type": "above",
    "above_value": 90,
    "time_period": 10
  },
  "additional_criteria": {
    "b": {
      "type": "below",
      "below_value": 5000000000,
      "metric": "telegraf.<host>.disk*.*.*.*.disk.free",
      "time_period": 10
    },
    "c": {
      "type": "above",
      "above_value": 90,
      "metric": "telegraf.<host>.disk*.*.*.*.disk.inodes_used_percent",
      "time_period": 10
    }
  },
  "expression": "a || b || c"
}
Disk failures are dangerous on their own, which means alerting needs broad coverage rather than correlation. A filesystem that is 95% full, out of inodes, or nearly out of free space will cause application failures regardless of which specific limit is reached first. By combining these independent failure modes into a single OR-based composite alert, you ensure that critical disk issues are detected quickly without managing multiple overlapping alerts.
Other Theoretical Composite Alert Examples
Once you understand the pattern, composite alerts apply almost everywhere:
- Kubernetes: Pod restarts AND node memory pressure
- Redis: Evictions AND command latency
- AWS ALB: 5XX error rate AND request count
- Background workers: Queue depth AND processing time
In each case, the goal is the same: alert only when multiple independent signals confirm a real problem. For SRE teams, alert fatigue is both an inconvenience and a reliability risk. When alerts fire too often, engineers stop trusting them, response times slow down, and real incidents can be missed. Single-metric alerts are especially prone to noise, since many metrics naturally spike or fluctuate during normal system behavior.
Composite alerts reduce that noise by requiring correlation, not coincidence. By combining signals like resource pressure and user-facing errors, alerts fire only when there’s strong evidence of real impact. This mirrors how experienced engineers reason during incidents and helps ensure that when an alert does fire, it matters. The result is fewer false positives, higher confidence in alerts, and healthier on-call rotations focused on issues that truly require attention.
At MetricFire, we ran into this exact issue within our own alerting infrastructure, specifically in a routing layer responsible for handling incoming traffic. Multiple components within that layer could fail at the same time and each one generated its own alert, resulting in a cluster of alerts that all pointed to the same underlying issue.
After restructuring our alerts to follow a more consistent service and signal hierarchy, we were able to group those components under a single "service-level" alert. That made it possible to evaluate the health of the service as a whole and then identify which specific signals were responsible when something went wrong. Learn how we applied these same concepts within MetricFire’s internal alerting infrastructure to reduce noisy, redundant alerts across our production traffic routing layer.
Conclusion
Composite alerts allow you to move beyond single-metric thresholds and toward context-aware alerting that reflects how systems actually fail in production. By requiring multiple signals to confirm an issue, or by explicitly covering multiple critical failure modes, composite alerts help eliminate false positives and prevent on-call engineers from being paged for conditions that resolve on their own.
For SRE teams, this means fewer interruptions, higher trust in alerts, and faster response when real incidents occur. Whether you’re monitoring a Heroku application, an NGINX edge service, or a PostgreSQL backend, composite alerts ensure that alerts fire only when there’s sustained, actionable impact. If you’re already collecting metrics, composite alerting lets you encode operational judgment directly into your alerts and reduce noise without adding complexity to your monitoring setup.
Sign up for a free trial, and test composite alerting on any part of your infrastructure. You can also book a demo and speak directly with the MetricFire team about any monitoring needs you may have.


