
Table of Contents
Great systems are not just built. They are monitored.
MetricFire is the fully managed Graphite and Grafana platform for small teams that don’t want to self-host their monitoring stack. Pre-built dashboards, alerts, and native add-ons for Heroku, AWS, Azure, and GCP. All with dedicated support and no infrastructure to maintain.
Introduction
Modern observability platforms promise a similar outcome: instrument your systems, ship your telemetry, and quickly gain visibility into what matters. The experience can feel almost turnkey but beneath that shared promise, platforms often take very different approaches to how observability should work. Under the hood, this often means installing agents, enabling auto-discovered integrations, and querying data through a unified telemetry model.
Some platforms aim to be expansive ecosystems covering infrastructure, APM, logs, tracing, synthetics, and more under a single pane of glass. Others focus more narrowly on metrics, prioritizing clarity, explicit configuration, and predictable behavior.
New Relic and Hosted Graphite are good examples of these two philosophies because both are powerful tools, and both support production-grade monitoring. But they optimize for different operational styles and understanding that difference is far more useful than comparing feature checklists.
Integration Breadth vs. Focused Monitoring
New Relic positions itself as a full-stack observability platform. Infrastructure monitoring, application performance monitoring (APM), logs, distributed tracing, real user monitoring, and synthetics available within the same ecosystem. There’s also a broad catalog of integrations covering cloud providers, databases, message queues, runtimes, container systems, and more. This breadth has a clear advantage: consolidation. Teams can instrument hosts, services, and applications under a unified data model and telemetry from multiple layers of the stack lives in one place. For organizations trying to reduce tool sprawl, that’s compelling.
However, breadth can increase surface area because more integrations mean more configuration paths. The platform must unify metrics, logs, and traces into a consistent interface, and that unification naturally introduces complexity. For example, a single infrastructure agent installation can surface host CPU, memory, disk I/O, running services, and detected integrations such as HAProxy or Kubernetes components. Adding APM instrumentation introduces transaction traces, service maps, and application-level golden metrics into the same UI.
Hosted Graphite by MetricFire takes a more focused approach. It is fundamentally a metrics-first monitoring platform. Rather than assuming a particular application stack or attempting to unify all telemetry types, it provides a flexible metrics ingestion and visualization system. Teams push time-series data via Carbon/Graphite protocols, StatsD counters and gauges, or Prometheus exporters routed through MetricFire’s ingestion layer, then compose Grafana dashboards using time series metrics and Graphite functions. The system does not auto-detect services or preconfigure entire monitoring paradigms but it provides the foundation, and teams shape it intentionally. There are fewer layers to reason about.
In short, New Relic emphasizes ecosystem coverage while Hosted Graphite emphasizes clarity and control.
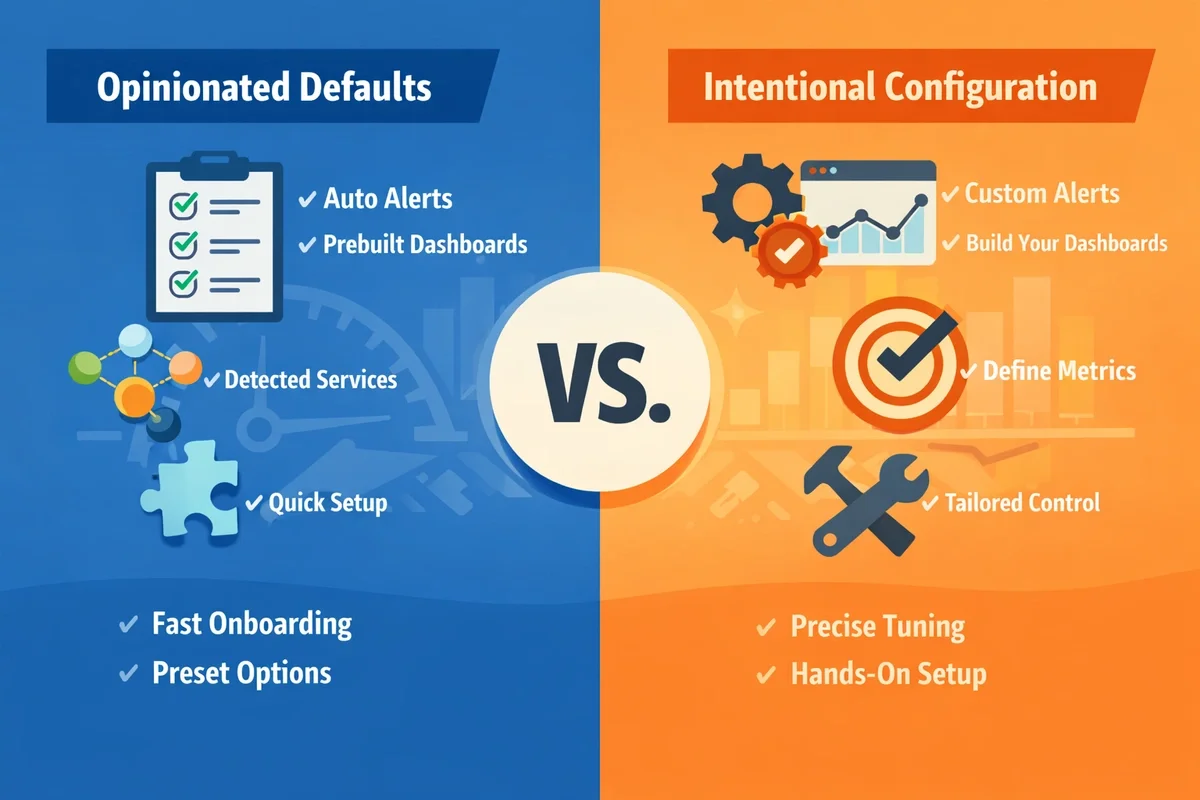
Opinionated Defaults vs. Intentional Configuration
A major philosophical difference between platforms shows up in how they handle alerts and dashboards.
New Relic leans into opinionated monitoring patterns. Concepts like Golden Signals (latency, traffic, errors, and saturation) are embedded directly into onboarding experiences and alert templates. Baseline anomaly detection can automatically calculate expected metric behavior over time and trigger incidents when a deviation exceeds a dynamic threshold, rather than relying solely on static limits. Instead of building every condition from scratch, teams can start with standardized monitoring best practices.
- This kind of automation can be extremely helpful, especially for teams that want structured guidance. However, standardized alert packs must make assumptions. They assume certain metrics exist. They assume certain telemetry types are instrumented. They assume naming conventions and baselines align with the environment. In real-world systems like heterogeneous or custom stacks, those assumptions may require tuning. A useful rule of thumb could be that 'automation reduces initial friction but it does not eliminate the need for validation'.
Hosted Graphite approaches alerting differently because their Graphite Alerts evaluate explicit time-series queries such as movingAverage(api.requests.count, 5min) > 500, where the condition logic is fully visible and directly tied to the metric path structure. There are no auto-generated Golden Signal bundles or baseline anomaly templates applied automatically. Instead, teams decide exactly which metric matters, what threshold constitutes a problem, and how long the condition must persist.
- This requires a more deliberate setup, but it also minimizes hidden assumptions. What you configure is exactly what runs and there is no abstraction layer translating a generic best-practice template into your environment. The tradeoff becomes clear: opinionated defaults can accelerate onboarding, while intentional configuration can increase predictability over time.
As of 2026, Hosted Graphite is introducing an alert simulation feature designed to help teams tune thresholds before deploying them in production. Rather than relying on opaque anomaly models, the simulator allows users to test alert conditions against historical data to see exactly when and how they would have triggered. This makes alert configuration more iterative and transparent, helping reduce noise without adding abstraction.
Unified Query Language vs. Direct Metric Manipulation
Querying is another area where philosophical differences emerge.
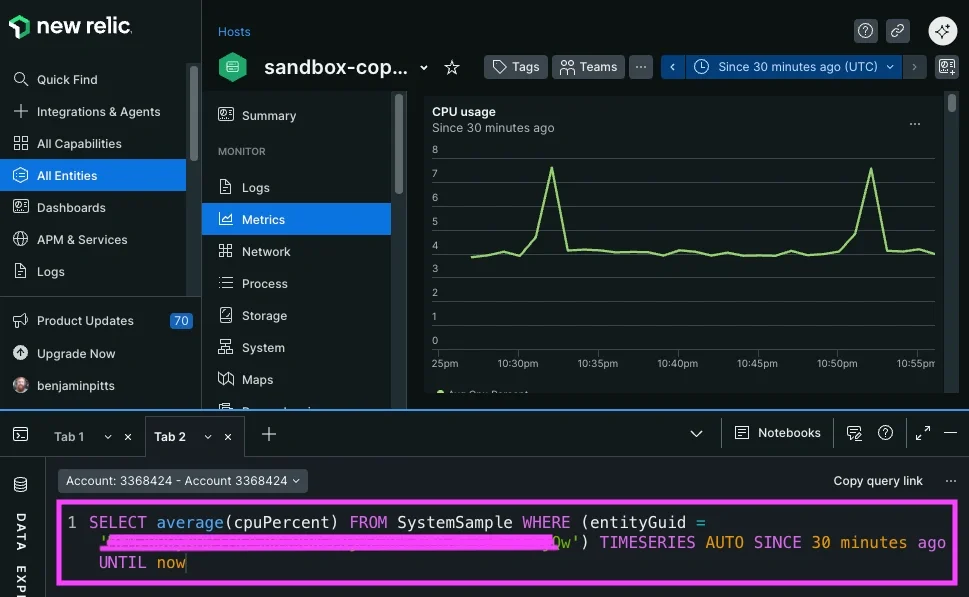
New Relic uses NRQL, a SQL-like query language that can operate across metrics, events, logs, and traces. Because telemetry types are unified into a common data platform, teams can perform cross-entity queries and advanced aggregations inside a single query model. This enables powerful correlation workflows, like linking application performance to infrastructure metrics within the same interface, but that power comes with some abstraction. Users must learn NRQL and understand how the platform models telemetry internally. NRQL operates across metric, event, and dimensional data types, allowing queries such as aggregating error rates across services while faceting by entity GUID. This unified model enables cross-telemetry analysis but requires understanding how data is stored internally. The learning curve isn’t necessarily steep for SQL-literate engineers, but it does represent a platform-specific mental model.
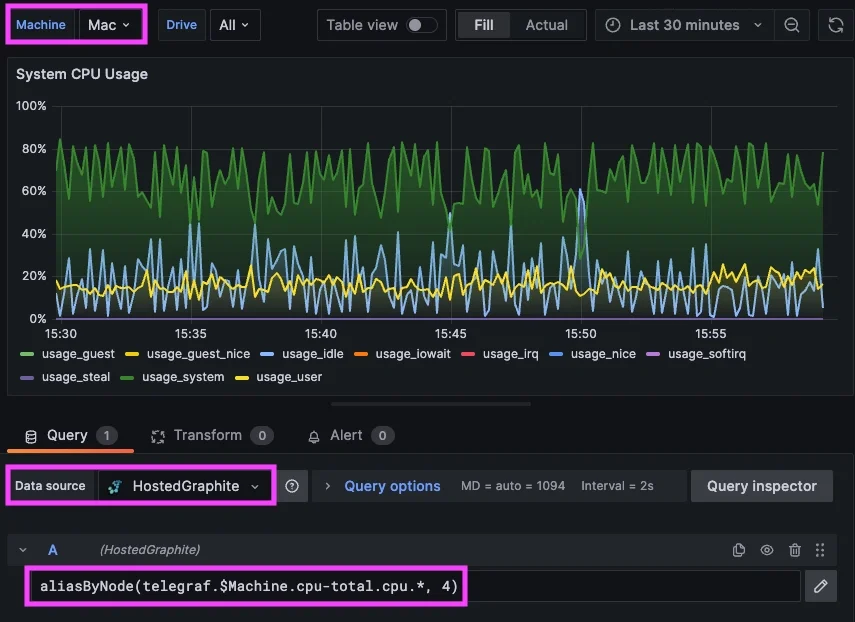
Hosted Graphite follows a more direct query approach because metrics have paths, Graphite functions transform time series, and alerts evaluate the result. The mental model is straightforward and tightly coupled to the underlying data. Graphite’s query model works directly on hierarchical metric paths (e.g: servers.web01.cpu.user), applying transformation functions before rendering or alert evaluation. The relationship between raw metric and visualization remains transparent throughout the workflow. For teams already familiar with Graphite or StatsD patterns, this can feel lightweight and predictable.
The difference here isn’t about capability, it’s about abstraction depth. New Relic unifies and generalizes telemetry and Hosted Graphite exposes and manipulates metrics directly.
At-a-Glance Comparison
| Category | New Relic | Hosted Graphite |
|---|---|---|
| Platform Scope | Full-stack observability (infrastructure, APM, logs, traces, synthetics) | Metrics-focused monitoring + optional Loki-based logging |
| Integration Model | Extensive integration catalog with agent-based service detection and entity modeling | Flexible ingestion (Graphite, StatsD) with no stack assumptions |
| Dashboards | Built-in dashboards with telemetry views; custom dashboards built using NRQL queries | Hosted Grafana + Graphite-native dashboards |
| Alerting Approach | Preconfigured Golden Signals, anomaly detection, NRQL-based alert conditions | Explicit metric-based alert rules with transparent threshold logic |
| Query Language | NRQL (SQL-like, cross-telemetry queries across metrics, events, logs) | Graphite functions & metric path queries; Prometheus-compatible querying |
| Abstraction Level | High (unified telemetry and entity model across services) | Low (direct time-series manipulation and explicit metric structure) |
| Onboarding Style | Guided setup with opinionated defaults and auto-detected services | Deliberate, configuration-driven setup with full control over metric definitions |
| Pricing Model | Usage-based pricing tied to data ingest, users, and telemetry type | Predictable plan-based pricing tied to metric volume and retention |
| Cost Predictability | Can vary depending on ingest growth and telemetry expansion | Generally simpler and more predictable as usage scales |
| Best Fit For | Teams seeking ecosystem breadth and cross-stack correlation | Teams prioritizing clarity, control, cost predictability, and metric-level precision |
Conclusion
When comparing New Relic and Hosted Graphite, it’s tempting to focus on feature count. But feature breadth alone doesn’t determine operational fit. The more important question is how your team prefers to interact with telemetry. In many ways, this becomes a question of architectural layering: do you prefer a platform that abstracts telemetry into higher-level operational constructs, or one that exposes the raw time-series primitives and lets you build upward from there?
- If you value broad integration coverage, cross-telemetry correlation, and guided monitoring patterns, a full-stack platform like New Relic may align well with your workflow. It centralizes multiple observability layers and provides opinionated structures to accelerate setup.
- If you prefer direct control over metric structure, explicit alert logic, and a smaller conceptual footprint, a metrics-first system like Hosted Graphite may offer a cleaner long-term experience. It reduces abstraction and keeps the monitoring model tightly coupled to the data you define.
Observability tools don’t just collect signals, they shape how teams reason about reliability. Whether you choose ecosystem breadth or focused clarity depends less on which platform has more features and more on how much abstraction your team wants between raw telemetry and operational decisions. Both approaches can work exceptionally well but the key is choosing the philosophy that fits how your team thinks about monitoring in production.

