

Table of Contents
Great systems are not just built. They are monitored.
MetricFire runs Graphite and Grafana as a fully managed service for growing engineering teams, taking care of storage, scaling, and version updates so your team doesn't have to. Plans start at $19/month, billed per metric namespace rather than per host, and include engineer-staffed support. Integrations work natively with Heroku, AWS, Azure, and GCP, and data is stored with 3× redundancy in SOC2- and ISO:27001-certified data centres.
Introduction
VictoriaMetrics is a fast, cost-efficient, and highly scalable time-series database designed as a drop-in replacement for Prometheus storage. It is widely used for collecting, storing, and querying metrics at scale, while remaining lightweight enough to run as a single binary or container. Because it is fully Prometheus-compatible, VictoriaMetrics supports standard PromQL queries and integrates seamlessly with Grafana.
Many teams choose VictoriaMetrics when they want:
- long-term storage for Prometheus-style metrics
- a simpler operational footprint than full Prometheus stacks
- high performance with lower memory and disk usage
- direct compatibility with existing Grafana dashboards
In this guide, we’ll walk through running VictoriaMetrics on an Ubuntu server using Docker, publishing sample metrics without Prometheus, and connecting VictoriaMetrics directly to Grafana using the Prometheus data source. By the end, you’ll have live time-series data flowing directly into Grafana that's ready to visualize.
Step 1: Run VictoriaMetrics on Ubuntu (Docker)
This article assumes you already have an instance of VictoriaMetrics running, but below is a step-by-step guide to get up and running quickly on Ubuntu (for testing purposes). VictoriaMetrics is widely distributed and runs as a container, making setup fast and consistent across environments. This approach avoids custom package repositories and works well for testing, demos, and small production setups.
Install Docker (if not already installed):
sudo apt update
sudo apt install -y docker.io
sudo systemctl enable --now docker
Verify Docker is available:
docker --version
Run VictoriaMetrics:
Start a single-node VictoriaMetrics container:
docker run -d \
  --name victoriametrics \
  -p 8428:8428 \
  -v vmdata:/storage \
  victoriametrics/victoria-metrics
This runs VictoriaMetrics with persistent storage and exposes the HTTP API on port 8428.
Verify the UI:
Open a browser and navigate to: http://<server-ip>:8428
You should see the VictoriaMetrics landing page with links to:
- /vmui (query UI)
- /metrics
- /targets
At this point, VictoriaMetrics is running and ready to receive data.
Allow Browser and Grafana Access (optional)
VictoriaMetrics listens on port 8428 by default, is fully accessible externally, and is ready to be added as a Grafana data source. However, you may have to update your firewall rules to allow easy access:
sudo ufw allow 8428/tcp
sudo ufw reload
Step 2: Publish Sample Metrics (No Prometheus Required)
VictoriaMetrics supports direct ingestion of Prometheus-formatted metrics, making it easy to publish data without running Prometheus. Run the following loop on the server to send synthetic metrics every 5 seconds:
while true; do
  curl -X POST "http://localhost:8428/api/v1/import/prometheus" \
    --data "cpu_load{host=\"sandbox\"} $((RANDOM % 100))"

  curl -X POST "http://localhost:8428/api/v1/import/prometheus" \
    --data "memory_usage{host=\"sandbox\"} $((RANDOM % 16000))"

  curl -X POST "http://localhost:8428/api/v1/import/prometheus" \
    --data "disk_usage{host=\"sandbox\"} $((RANDOM % 100))"

  sleep 5
done
Let the loop run for a few minutes, then stop it with Ctrl+C.
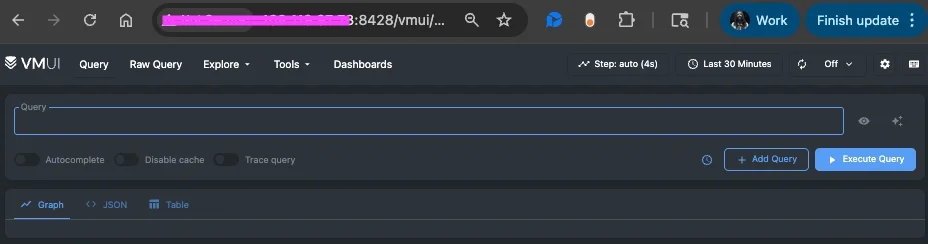
Confirm Metrics Are Ingested
- Open the VictoriaMetrics UI: http://<server-ip>:8428/vmui
- Run a simple query: cpu_load
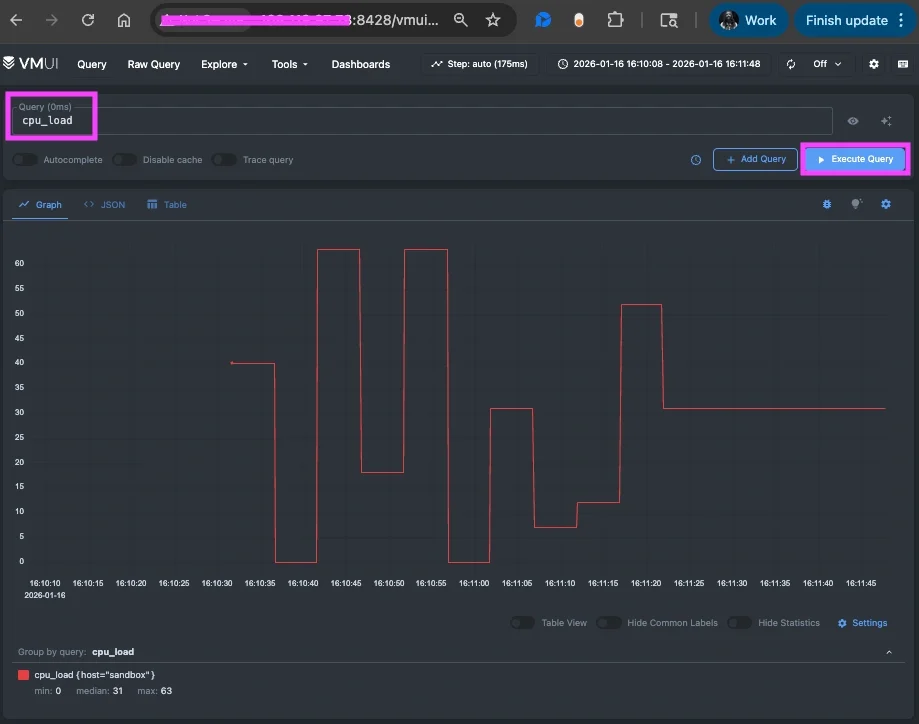
The VictoriaMetrics built-in browser UI is useful for quickly validating ingested metrics and performing lightweight exploration. It’s a good tool for confirming that data is flowing correctly and for basic, ad-hoc queries.
However, Grafana provides a more powerful visualization experience. It has richer charting options, transformations, and alerting capabilities and makes it easier to compare metrics over time and correlate multiple data sources. For ongoing monitoring and data analysis, Grafana is typically the better long-term interface for working with VictoriaMetrics data.
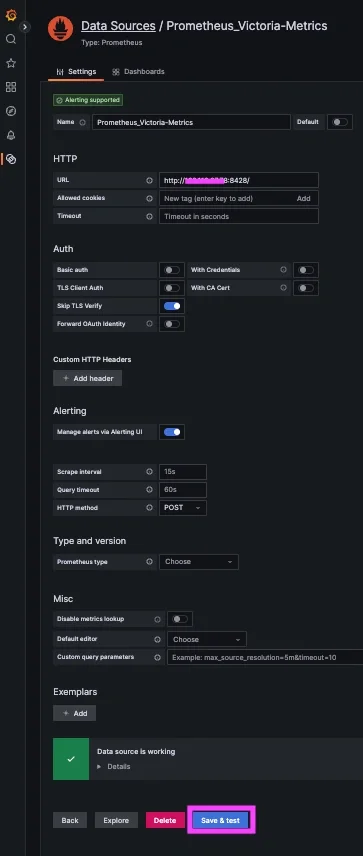
Step 3: Connect VictoriaMetrics to Grafana
In your Grafana:
- Navigate to Connections => Connect Data
- Search/select: Prometheus
- URL: http://<server-ip>:8428
- (for testing) Skip TLS Verify: enable
- Save & Test
If you don't already have a running instance of Grafana, you can get one for FREE when you start a 14-day trial with MetricFire!
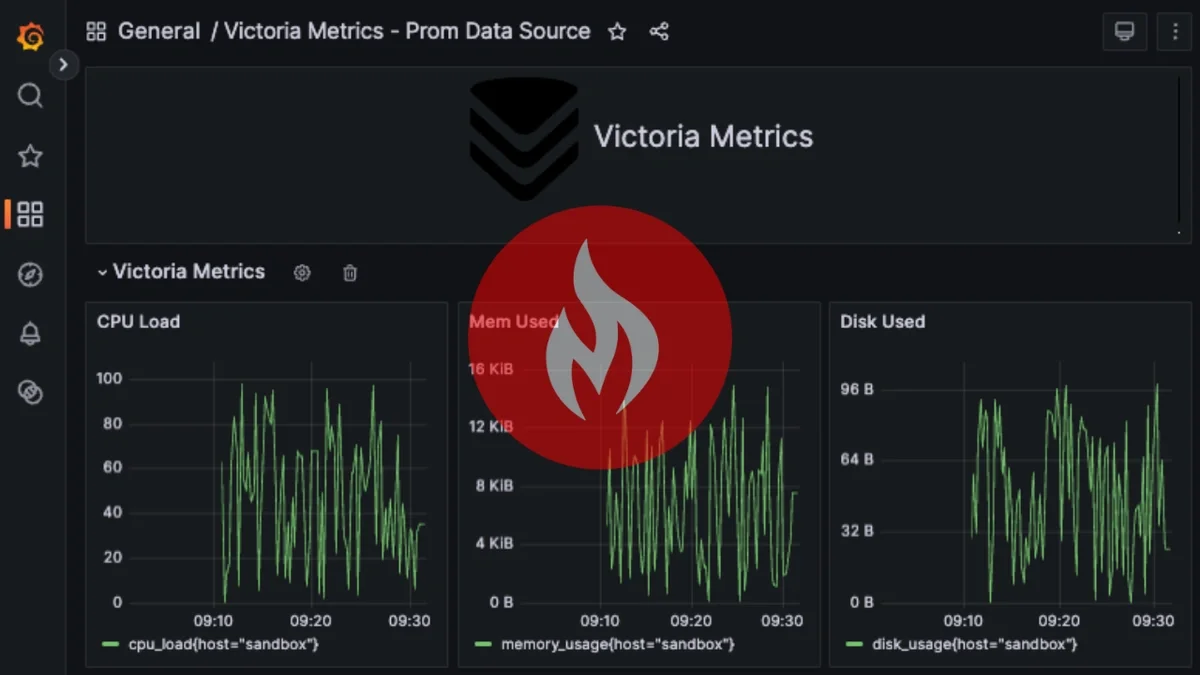
Step 4: Example Grafana Queries (PromQL)
Create a Grafana Dashboard Panel
In your Grafana:
- Navigate to => Dashboards => New Dashboard => "Add new panel"
- Select your new InfluxDB Datasource and select the Code option
Basic Query
Once the datasource is connected, you can start building dashboards using PromQL:
memory_usage
Multiple Metrics on a Single Graph
This query is useful for quick comparisons, though memory values may dominate the Y-axis:
{__name__=~"cpu_load|memory_usage|disk_usage"}
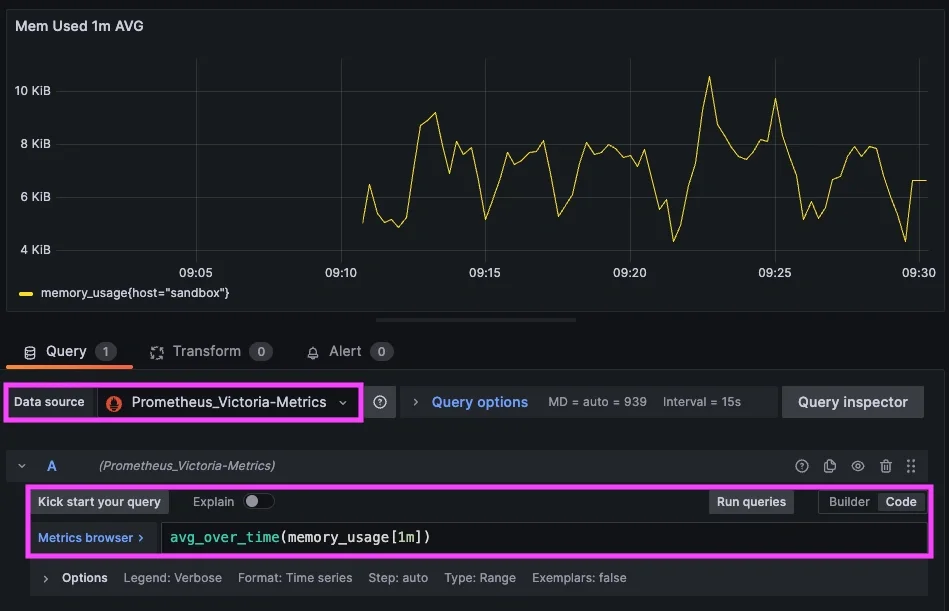
Smoothed Averages (Recommended)
Rolling averages produce cleaner, more readable graphs:
avg_over_time(memory_usage[1m])
How VictoriaMetrics Is Used in Practice
VictoriaMetrics is commonly deployed by SRE and infrastructure teams as a scalable, Prometheus-compatible time-series database. In many environments, it serves as long-term storage for Prom data, allowing teams to retain metrics for months or years without the operational complexity of large Prometheus setups. Because it supports standard PromQL, existing dashboards and alerting rules can continue to work without modification.
In practice, VictoriaMetrics is often used to centralize metrics from multiple environments, such as Kubernetes clusters, cloud infrastructure, and bare-metal systems, into a single queryable datastore. Teams frequently ingest data via Prometheus remote_write, OpenTelemetry collectors, or custom exporters and use VictoriaMetrics as the durable storage layer behind these collectors. For organizations that need to integrate metrics with multiple backend systems or enable governed API access to metrics data across applications, solutions like DreamFactory can provide a self-hosted API layer that securely exposes VictoriaMetrics data to enterprise applications and internal tools. This separation of collection, storage, and API-driven access makes monitoring pipelines easier to scale and operate.
Many organizations adopt VictoriaMetrics specifically for its performance characteristics and efficient resource usage. It is well-suited for high-cardinality metrics and high ingestion rates, making it a solid choice in modern micro-service architectures where metric volume can grow quickly. Paired with Grafana for visualization, VictoriaMetrics enables SRE teams to analyze trends, investigate incidents, and track service health using familiar PromQL queries.
While many companies deploy VictoriaMetrics internally (and don’t publicly disclose specifics), the ecosystem includes:
- Large SaaS platforms that need centralized metric retention from thousands of microservices
- Telecom/edge compute providers ingesting high-cardinality telemetry from distributed devices
- Open-source monitoring stacks used in CNCF projects where users want lightweight alternatives to Thanos or Cortex
- Internal metric mesh architectures where VictoriaMetrics acts as the convergence point for telemetry from diverse systems
Conclusion
VictoriaMetrics is a powerful and flexible solution for storing and querying time-series metrics, especially for teams already familiar with Prometheus and PromQL. Its lightweight design, strong performance characteristics, and full Grafana compatibility make it a popular choice for both small environments and large-scale metric pipelines.
By running VictoriaMetrics as a single container, publishing metrics directly, and connecting it to Grafana via the Prometheus data source, you can quickly build dashboards without deploying or managing a full Prometheus stack. This approach works well for testing, learning PromQL, and visualizing metrics that already exist outside of traditional monitoring pipelines.
VictoriaMetrics fits naturally alongside Grafana’s broad ecosystem of data sources and provides another flexible option for teams looking to visualise metrics wherever they are already being produced.
Sign up for the free trial and begin monitoring your infrastructure today. You can also book a demo and talk to the MetricFire team directly about your monitoring needs.


