
Table of Contents
Great systems are not just built. They are monitored.
MetricFire runs Graphite and Grafana as a fully managed service for growing engineering teams, taking care of storage, scaling, and version updates so your team doesn't have to. Plans start at $19/month, billed per metric namespace rather than per host, and include engineer-staffed support. Integrations work natively with Heroku, AWS, Azure, and GCP, and data is stored with 3× redundancy in SOC2- and ISO:27001-certified data centres.
Introduction
Prometheus is one of the most popular open-source monitoring systems in the world. It’s lightweight, easy to deploy, and pairs beautifully with Grafana for dashboards and alerting. If you're running applications or infrastructure on Linux, Prometheus plus one of many Exporters (Redis, NVIDIA GPU, Nginx, etc.) gives you deep visibility into service performance - quickly and reliably.
In this guide, we’ll show you how to install Prometheus and Node Exporter using the simplest method available (apt install on Ubuntu), verify that metrics are flowing, and connect everything to your Grafana account. By the end, you’ll have a working monitoring stack you can expand to multiple servers or entire environments. Don't have Grafana yet? Sign up for MetricFire's free trial to try it out and follow along with this tutorial!
Step 1: Install Prometheus + Node Exporter (ubuntu)
Most Prometheus tutorials involve downloading binaries, creating users, configuring directories, and writing systemd service files manually. That works well for production level use cases, but it's overkill if you're just trying to stand up a local Prometheus instance quickly. Ubuntu’s built-in package repository includes both Prometheus and Node Exporter as fully configured services.
This article assumes that you already have a running instance of Prometheus, but if you want to follow along as a proof of concept, you can have a working monitoring environment with a few simple commands:
Update and install (ubuntu)
sudo apt update
sudo apt install prometheus prometheus-node-exporter -y
Services start automatically
sudo systemctl status prometheus
sudo systemctl status prometheus-node-exporter
Confirm metrics are scrape-able from within your server
curl http://localhost:9100/metrics
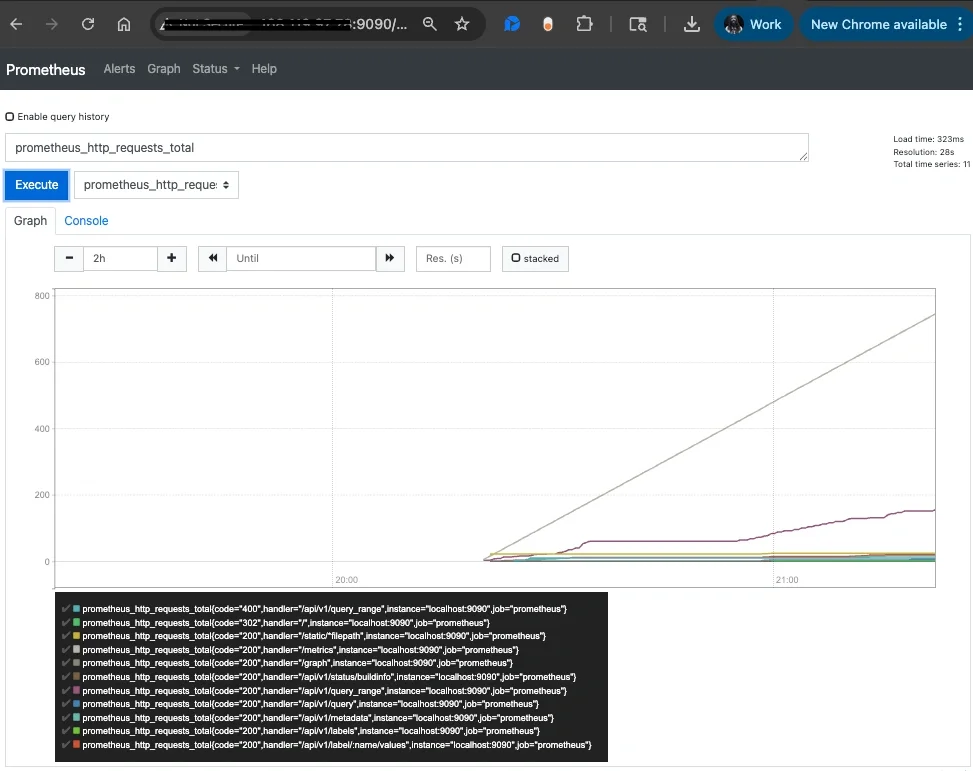
View the prometheus UI in your browser
http://<server-ip>:9090
Optionally Allow Remote Access
If you're unable to view the prometheus UI from your browser you may need to open the ports on your server:
sudo ufw allow 9090/tcp
sudo ufw allow 9100/tcp
sudo ufw reload
Now Prometheus should be fully accessible externally, and is ready to be added as a Grafana datasource.
Step 2: Connecting Prometheus to Grafana
In your Grafana account:
- Navigate to Connections => Connect Data
- Search/select Prometheus
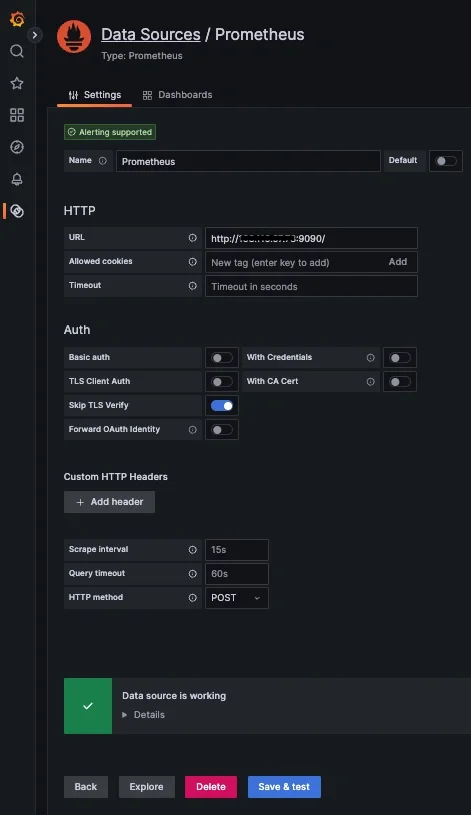
- Enter your Prometheus URL: http://<server-ip>:9090
- Skip TLS Verify: enable
- Click Save & Test
You should see:
- Data source is working - now you’re ready to build dashboards!
If you don't already have a running instance of Grafana, you can get one for FREE when you start a 14-day trial with MetricFire!
Step 3: Visualize Node Exporter Metrics in Grafana
Create a Grafana Dashboard Panel
In your Grafana:
- Navigate to => Dashboards => New Dashboard => "Add new panel"
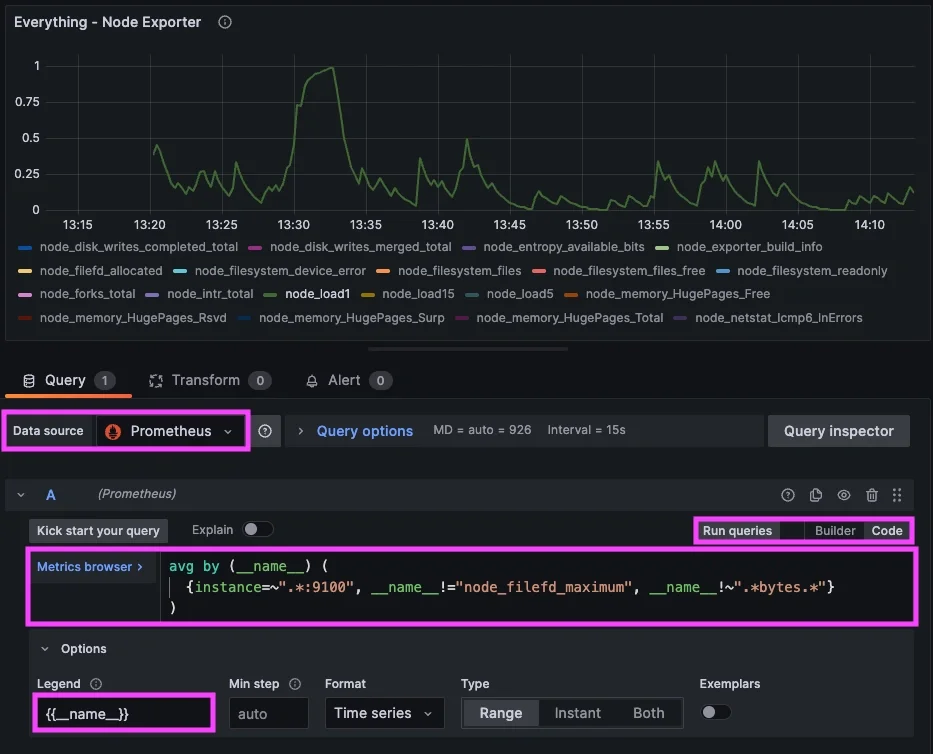
- Select your new Prometheus Datasource and select the Code option
Add a PromQL Query
Prometheus uses a powerful query language called PromQL, and thanks to Node Exporter, you already have hundreds of metrics available. Here are some useful starter queries:
CPU Usage (%)
100 - (avg by(instance) (rate(node_cpu_seconds_total{mode="idle"}[5m])) * 100)
Memory Usage (%)
(node_memory_MemTotal_bytes - node_memory_MemAvailable_bytes)
 / node_memory_MemTotal_bytes * 100
Disk Usage (%)
(node_filesystem_size_bytes{mountpoint="/"} - node_filesystem_avail_bytes{mountpoint="/"})
 / node_filesystem_size_bytes{mountpoint="/"} * 100
Load Average
node_load1
Network Throughput (bytes/sec)
rate(node_network_receive_bytes_total[5m])
All Metrics
{instance=~".*:9100"}
Conclusion
Prometheus and Node Exporter give you deep visibility into your Linux servers with almost no setup. When paired with MetricFire’s Hosted Grafana, you get a powerful monitoring stack without storing metrics or maintaining your own dashboard environment. With just a few commands:
-
Prometheus is installed
-
Node Exporter begins collecting metrics
-
Prometheus starts scraping automatically
-
Grafana displays everything beautifully - directly from your server
Whether you're monitoring development servers, production workloads, or benchmarking performance, this setup is simple, scalable, and fully compatible with MetricFire’s hosted platform.
Sign up for the free trial and begin monitoring your infrastructure today. You can also book a demo and talk to the MetricFire team directly about your monitoring needs.

