
Table of Contents
Great systems are not just built. They are monitored.
MetricFire runs Graphite and Grafana as a fully managed service for growing engineering teams, taking care of storage, scaling, and version updates so your team doesn't have to. Plans start at $19/month, billed per metric namespace rather than per host, and include engineer-staffed support. Integrations work natively with Heroku, AWS, Azure, and GCP, and data is stored with 3× redundancy in SOC2- and ISO:27001-certified data centres.
Introduction
HAProxy is the workhorse in front of countless APIs and apps because it’s fast, lean, and flexible. Because it sits on the traffic hot path, it’s also your earliest warning system when something slows down or breaks entirely. This means that monitoring it isn’t optional. You need to see connection queues and retries, per-stage timings, health-check failures, and spikes in error statuses to catch incidents before users do. With simple service logs, you can leverage HAProxy to become the lens that keeps traffic flowing and pinpoint which backend, route, or configuration is leading to upstream issues.
In this guide, we'll detail how to ship HAProxy logs to a Hosted Loki endpoint using Promtail, and use LogQL to make useful queries in Grafana.
Start a chat with us today to test MetricFire's Logging Integration for FREE. We will help you every step of the way, from collection to visualization!
Step 1: Understanding HAProxy Logs
HAProxy is an open-source load balancer and reverse proxy used to distribute traffic across multiple backend services. It supports both Layer 4 (TCP) and Layer 7 (HTTP), allowing teams to perform tasks such as terminating TLS, enforcing routing rules, and maintaining fast and reliable connections. Built-in health checks, retries, and sticky-session options help apps stay available even when individual instances fail. It’s also popular because it’s rock-solid under heavy loads, it's easy to automate, and it comes with basic logs for observability. Below is a line from a /var/log/haproxy.log file, and a decoder for each section of the line:
Sep 25 15:09:53 sandbox-lb-server haproxy[3725515]: 127.0.0.1:46886 [25/Sep/2025:15:09:53.028] cop-tcp-ssl cop-tcp/sandbox-lb-server 1/0/0 0 -- 1/1/0/0/0 0/0
- Sep 25 15:09:53 sandbox-lb-server haproxy[3725515]: - Syslog header: timestamp, host, program and PID.
- 127.0.0.1:46886 - Client IP and source port.
- [25/Sep/2025:15:09:53.028] - Accept time of the connection (ms).
- cop-tcp-ssl - Frontend name handling the connection.
- cop-tcp/sandbox-lb-server - Backend and selected server.
- 1/0/0 - Timers: Tw queue wait, Tc connect time, Tt total session duration. Here: waited 1 ms, 0 ms to connect, 0 ms total.
- 0 - Bytes sent to the client.
- -- - Termination state (two chars). -- means normal close on both sides.
- 1/1/0/0/0 - Connection counters: active on process / on frontend / on backend / on server / retries.
- 0/0 - Queues: server queue / backend queue depths when logged.
Step 2: Configure Promtail to Collect HAProxy Logs
We support log collection via OpenTelemetry Contrib and Promtail. In this example, we'll detail how to configure Promtail since it is an official log shipping agent for Grafana Loki. It runs as a lightweight binary that tails log files (like /var/log/haproxy.log) and forwards them to our Hosted Loki endpoint over HTTP. (This article assumes that you are already running an instance of HAProxy that is serving traffic).
Install/unpack Promtail (Ubuntu)
wget https://github.com/grafana/loki/releases/download/v3.5.3/promtail_3.5.3_amd64.deb

sudo apt-get install -y ./promtail_3.5.3_amd64.deb
Configure Promtail to Forward Logs
Update your Promtail configuration file at /etc/promtail/config.yml to include the following:
server:
  http_listen_port: 9080
  grpc_listen_port: 0

positions:
  filename: /tmp/positions.yaml

clients:
  - url: https://<YOUR-API-KEY>@www.hostedgraphite.com/logs/sink

scrape_configs:
  - job_name: haproxy-logs
    static_configs:
      - targets:
          - localhost
        labels:
          host: <HOST-NAME>
          job: haproxy-logs
          __path__: /var/log/haproxy.log
NOTE: Make sure to replace YOUR-API-KEY and HOST-NAME in the above config and restart the Promtail service:
sudo systemctl restart promtail
sudo systemctl status promtail
Step 3: Create a Loki Data Source in our Hosted Grafana
REACH OUT TO US about trying our new Logging feature for FREE, and we will create a Loki Access Key in your Hosted Graphite account. If you don't already have a Hosted Graphite account, sign up for a free trial here to obtain a Hosted Graphite API key and Loki Access Key.
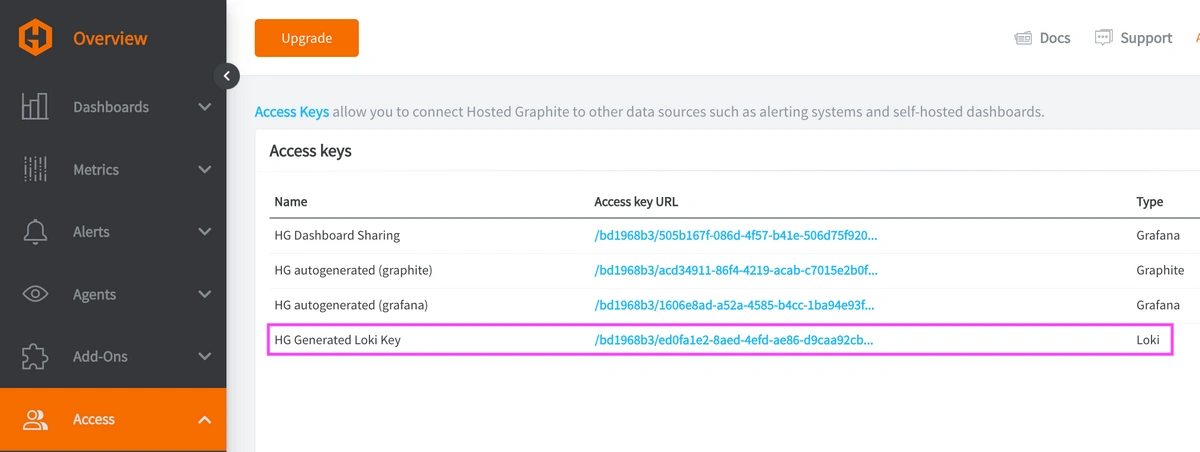
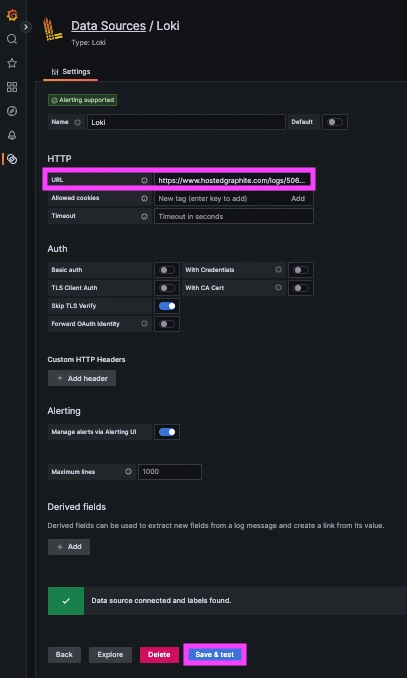
Now within the Hosted Graphite UI, you can navigate to Dashboards => Settings => Data sources => Add New Data source (Loki). You'll be able to add the URL for your HG Loki endpoint, which includes your new Loki Access Key: https://www.hostedgraphite.com/logs/<UID>/<LOKI-ACCESS-KEY>
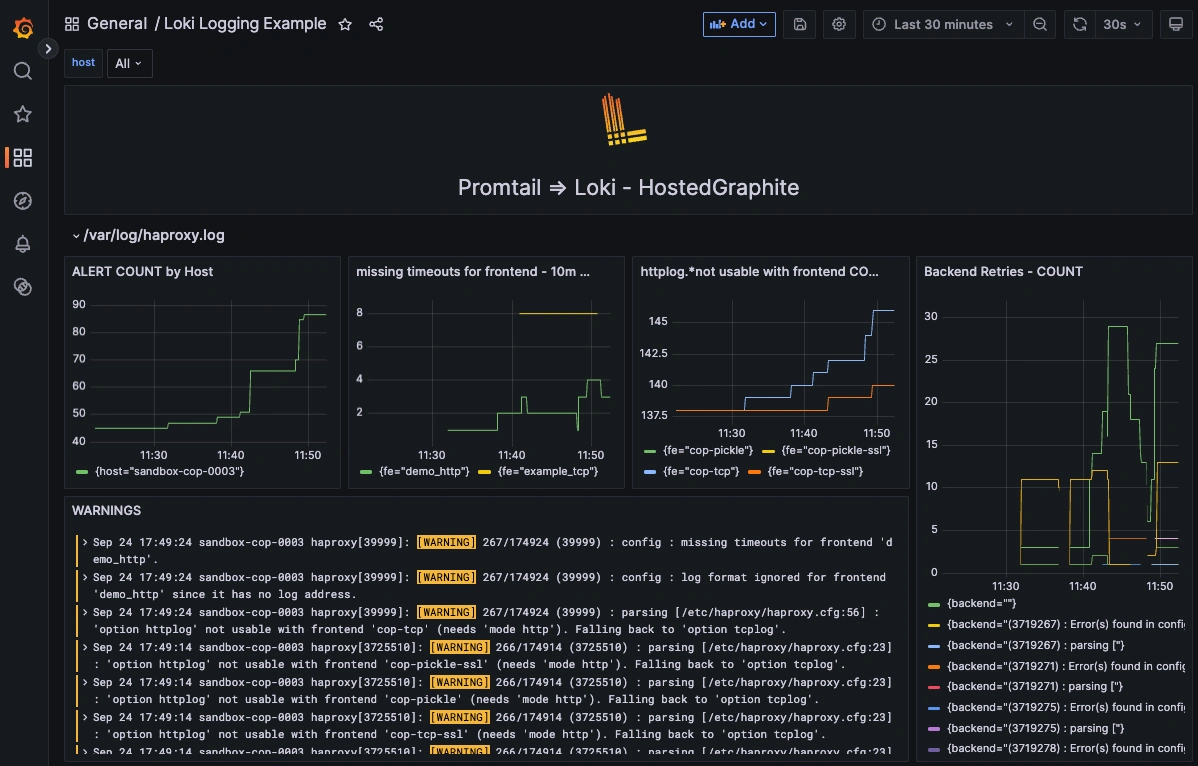
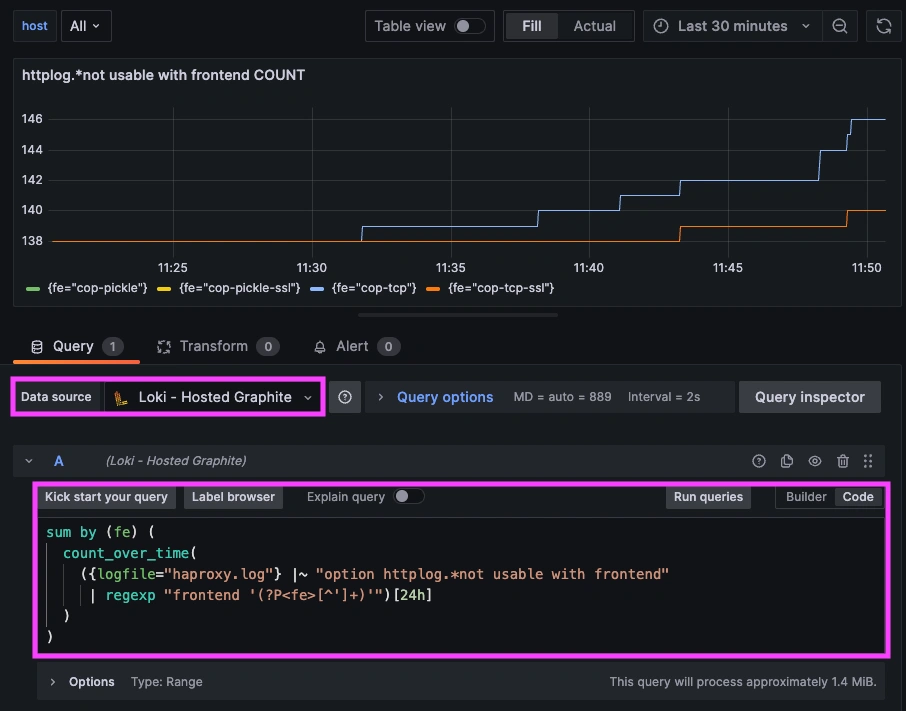
Step 4: Query HAProxy Logs in Dashboard Panels
Once system logs are forwarded to our Loki endpoint and the data source is connected in your Hosted Grafana, you can create a new dashboard panel, select Loki as your Data source, and format a query using 'code mode'.
- LogQL query that sums ALERT counts by host:
sum by (host) (
  count_over_time(
    ({job="haproxy.log"} |= "[ALERT]")[24h]
  )
)
- Query to display missing timeouts for frontend (10m):
sum by (fe) (
  count_over_time(
    ({job="haproxy-logs"} |~ "missing timeouts for frontend"
     | regexp "frontend '(?P<fe>[^']+)'")[10m]
  )
) > 0
- 24hr sum of httplog.*not usable with frontend occurrences:
sum by (fe) (
  count_over_time(
    ({job="haproxy-logs"} |~ "option httplog.*not usable with frontend"
     | regexp "frontend '(?P<fe>[^']+)'")[24h]
  )
)
Conclusion
Monitoring HAProxy isn’t just a dev-ops best practice; it’s a business safeguard. That's because HAProxy sits on the critical path for every request; its logs are the earliest indicators of churn-driving issues such as queuing and retries that lengthen response times, backend errors that erode SLAs, TLS and health-check failures that cause hard outages. Instrumenting HAProxy gives you fast detection and faster MTTR, turning potential revenue loss and support volume into brief, contained events. It also informs more intelligent capacity planning and cost control, reduces risk during releases, and strengthens security hygiene. Use HAProxy logs with Loki and get key visualizations that provide a single source of truth for customer experience. You will see problems sooner, fix them faster, prove the improvement, and make data-backed decisions that protect your business's uptime, reputation, and margin.
MetricFire's Hosted Loki logging integration is quick to set up but powerful in practice. Whether you're tracking security threats, service issues, failed jobs, or kernel anomalies, it gives you the visibility you need to stay ahead of problems and reduce the time it takes to resolve them. Reach out to the MetricFire team today and let’s build something great together!


