
Table of Contents
- Introduction
- Step 1: Setup a Log Collector on your Server
- Step 2: Configure Telegraf on Your Server With the Fail2Ban Plugin
- Step 3: Configure a Loki Data Source in Your Hosted Graphite Account
- Step 4: Visualize Fail2Ban Logs in Grafana
- Step 5: Visualize Corresponding Fail2Ban Metrics in Grafana
- Conclusion
Great systems are not just built. They are monitored.
MetricFire runs Graphite and Grafana as a fully managed service for small engineering teams, taking care of storage, scaling, and version updates so your team doesn't have to. Plans start at $19/month, billed per metric namespace rather than per host, and include engineer-staffed support. Integrations work natively with Heroku, AWS, Azure, and GCP, and data is stored with 3× redundancy in SOC2- and ISO:27001-certified data centres.
Introduction
Security threats aren’t always loud and don’t always crash systems or trigger alarms. Sometimes they creep in quietly as a steady stream of unauthorized login attempts, slow brute-force probes, or unknown IPs scanning your server for vulnerabilities. These behaviors often show up in logs before they surface in metrics but if you're only watching logs or only tracking metrics, you're missing part of the story.
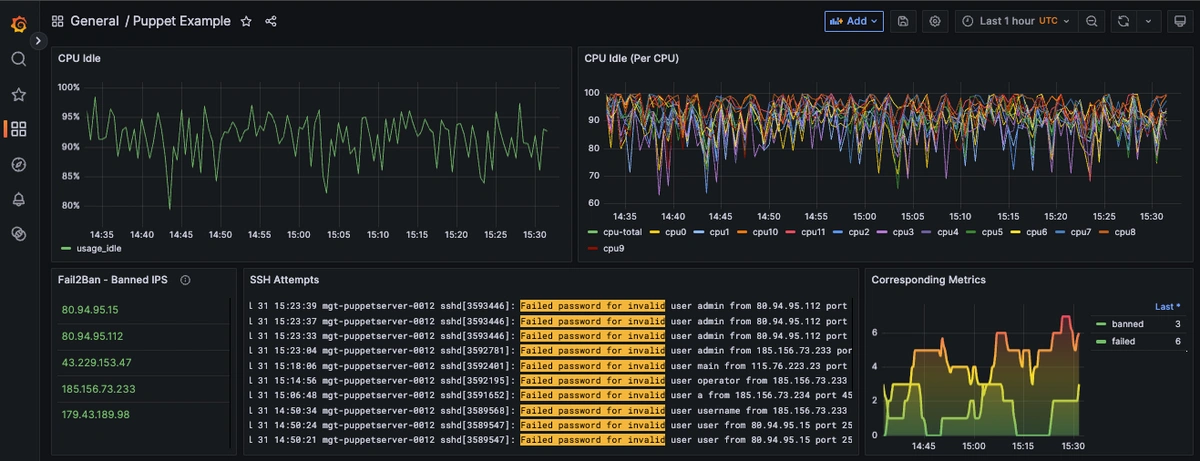
At MetricFire, we believe that effective monitoring means correlating logs and metrics in a single observability layer. Seeing something like a spike in failed SSH logins is useful, but knowing which IPs were involved, when they hit, and whether they were banned turns that insight into action. When you visualize these events side-by-side (raw logs showing banned IPs, and time-series metrics quantifying login failures), you gain both context and clarity. This leads to faster incident response, stronger forensic visibility, and a more secure infrastructure.
In this article, we’ll walk through how we installed Telegraf and Promtail on our Puppet certificate-signing server to monitor for these kinds of threats. We used Fail2Ban to scan logs for malicious SSH behavior and block bad actors in real time. Then, we piped the resulting log data to our Hosted Loki, and forwarded the corresponding Telegraf metrics for visual analysis in Grafana. The result is a security observability stack that not only defends your system, but also helps you understand what is happening and why.
Start a chat with us today if you are interested in testing MetricFire's new Logging Integration for FREE. We will help you every step of the way, from collection to visualization!
Step 1: Setup a Log Collector on your Server
We support log collection via OpenTelemetry Contrib and Promtail. In this example, we'll detail how to configure Promtail since it is an official log shipping agent for Grafana Loki. It runs as a lightweight binary that tails log files (like /var/log/syslog) and forwards them to our Hosted Loki endpoint over HTTP.
Install/unpack Promtail (Ubuntu)
wget https://github.com/grafana/loki/releases/download/v3.5.3/promtail_3.5.3_amd64.deb

sudo dpkg -i promtail_3.5.3_amd64.deb || sudo apt-get -y -f install
Configure Promtail to Forward Logs
Update your Promtail configuration file at /etc/promtail/config.yml to include the following:
server:
  http_listen_port: 9080
  grpc_listen_port: 0

positions:
  filename: /tmp/positions.yaml

clients:
  - url: https://<YOUR-API-KEY>@www.hostedgraphite.com/logs/sink

scrape_configs:
  - job_name: varlogs
    static_configs:
      - targets:
          - localhost
        labels:
          host: <HOST-NAME>
          job: varlogs
          __path__: /var/log/fail2ban.log
NOTE: Make sure to replace YOUR-API-KEY and HOST-NAME in the above config and restart the Promtail service:
sudo systemctl restart promtail
sudo systemctl status promtail
You may also need to assign permissions to allow Promtail to read your /var/log files:
sudo usermod -aG adm promtail
sudo systemctl restart promtail
Step 2: Configure Telegraf on Your Server With the Fail2Ban Plugin
What is Fail2Ban?
Fail2Ban is a log-parsing intrusion prevention system. It watches log files for patterns that indicate brute-force attacks or other malicious behavior (like repeated failed SSH login attempts) and dynamically updates your firewall to block offending IP addresses. If you don't have Fail2Ban already running in your server, here's a quick way to get it installed and running (Ubuntu):
sudo apt install fail2ban -y
sudo service fail2ban status
Out of the box, Fail2Ban will monitor services like:
-
sshd (SSH server)
-
nginx/apache (web access logs)
-
postfix/dovecot (mail servers)
-
vsftpd (Very Secure FTP Daemon)
Setup the Telegraf Collector
If you don't already have an instance of Telegraf running in your server, install our HG-CLI tool to quickly configure Telegraf:
curl -s "https://www.hostedgraphite.com/scripts/hg-cli/installer/" | sudo sh
NOTE: You will need to input your Hosted Graphite API key, and follow the prompts to select which services to collect metrics from.
Once it's installed, open the Telegraf configuration file at: /etc/telegraf/telegraf.conf and add the following section:
[[inputs.fail2ban]]
  use_sudo = true
Now you can start the Telegraf service, or run it manually to inspect the output for any errors:
telegraf --config /etc/telegraf/telegraf.conf
Step 3: Configure a Loki Data Source in Your Hosted Graphite Account
Reach out to us about trying our new Logging feature for free, and we will create a Loki Access Key in your Hosted Graphite account. If you don't already have a Hosted Graphite account, sign up for a free trial here to obtain a Hosted Graphite API key and Loki Access Key.
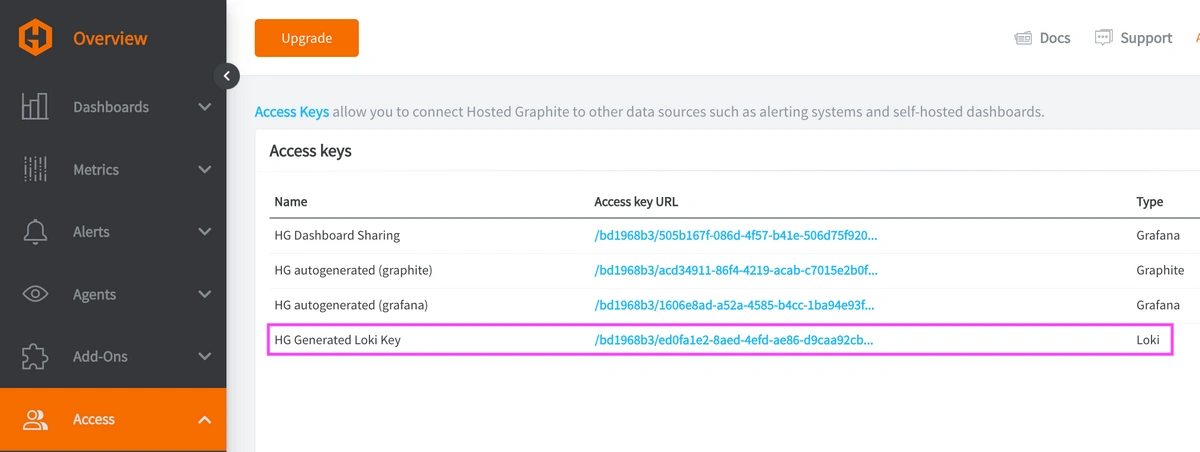
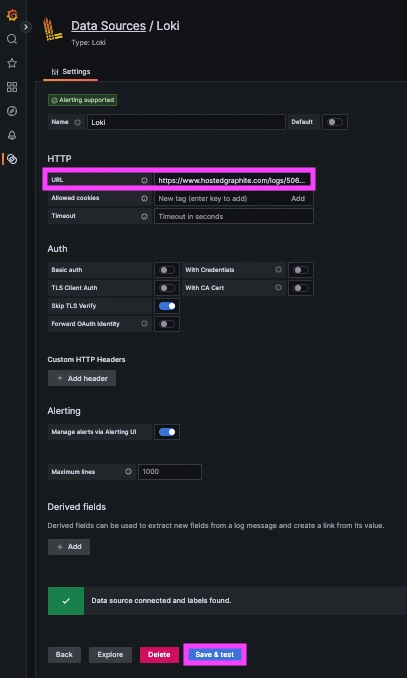
Within the Hosted Graphite UI, you can navigate to Dashboards => Settings => Data sources => Add New Data source (Loki). You'll be able to add a URL for our Loki endpoint, which includes your new Loki Access Key:
https://www.hostedgraphite.com/logs/<UID>/<LOKI-ACCESS-KEY>
Step 4: Visualize Fail2Ban Logs in Grafana
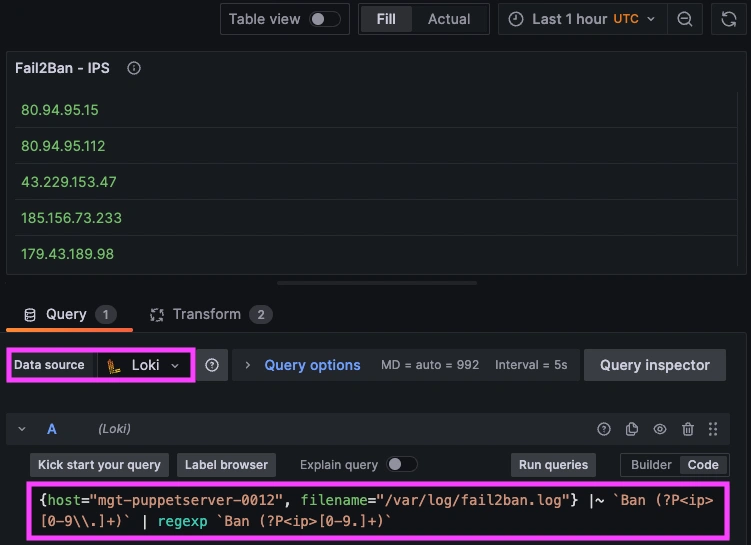
Once system logs are forwarded to our Loki endpoint and the data source is connected in your Hosted Grafana, you can create a new dashboard panel, select Loki as your Data source, and format a query using 'code mode'. Here's an example query to display your server's fail2ban.log messages and populates a panel showing which IPs were banned:
{host="HOST-NAME", filename="/var/log/fail2ban.log"} |~ `Ban (?P<ip>[0-9\\.]+)` | regexp `Ban (?P<ip>[0-9.]+)`
Here's another query to compare these banned IPs with any failed SSH attempts appearing in your syslog:
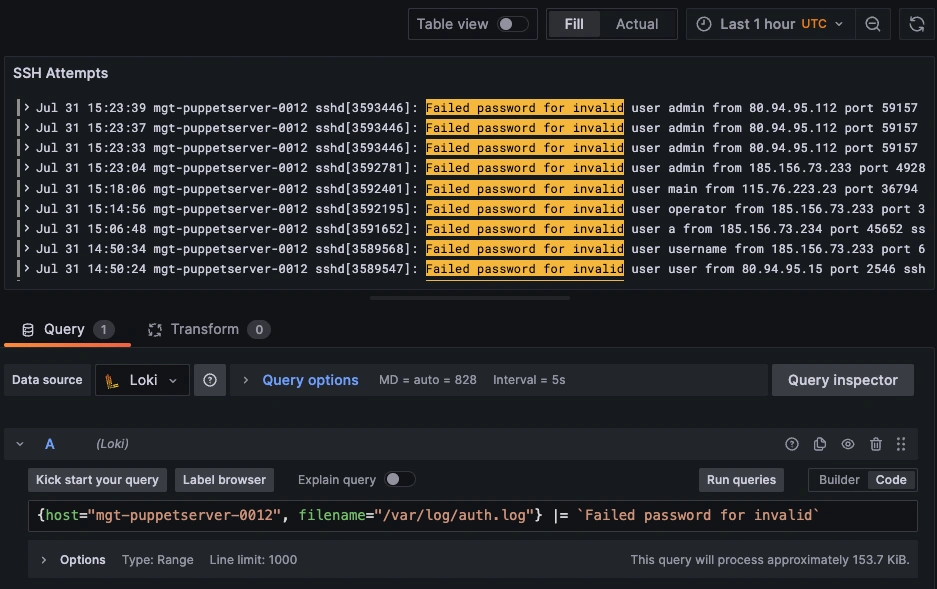
NOTE: Loki supports a powerful LogQL syntax with regex filtering, line parsing, and field extraction!
Step 5: Visualize Corresponding Fail2Ban Metrics in Grafana
Now you can create another panel using the corresponding Fail2Ban metrics collected by Telegraf (using the HostedGraphite data source). By viewing this next to your fail2ban.log panel, we can correlate metric patterns with the actual log data showing possible attackers. Here's an example query to view fail2ban metrics forwarded from your server:
groupByNode(telegraf.$host.sshd.fail2ban.*, 3, 'average')
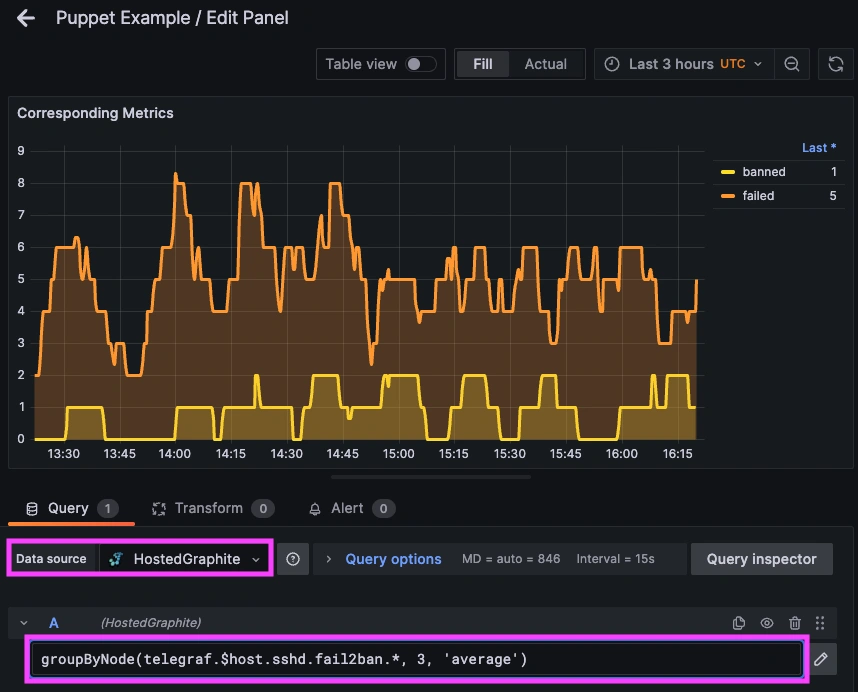
- telegraf.$host.sshd.fail2ban.failed tracks the number of failed SSH login attempts detected by Fail2Ban, highlighting potential brute-force activity or misconfigured clients.
- telegraf.$host.sshd.fail2ban.banned reflects the number of IP addresses that were actively banned due to repeated login failures, showing that Fail2Ban is taking automated action to block suspicious sources.
- Graphite's groupByNode() function aggregates all related metrics by a shared path, allowing you to combine them into a single value such as a 'total count'.
Conclusion
Visualizing logs alongside metrics helps DevOps engineers move from detection to understanding. Metrics give you the WHAT (spikes in bans, patterns over time), and Logs give you the WHY (IP addresses, timestamps, and error details). This is critical in order to spot abnormal behavior instantly, and back it up with the raw evidence needed to troubleshoot, report, or automate response actions. Services like Fail2Ban are powerful tools on their own, but combined with a solid observability stack like Hosted Graphite, Telegraf, and Promtail/Loki, it becomes part of a real-time security dashboard that your DevOps team can depend on.
By combining logs and metrics in Grafana, you can troubleshoot faster, spot patterns more easily, and get critical context around performance issues or system events. Instead of jumping between tools or manually inspecting your server logs, you can correlate a spike in metrics with the exact log line that makes sense in a single dashboard.
MetricFire's Loki-based logging integration is quick to set up but powerful in practice. Whether you're tracking security threats, service restarts, failed jobs, or kernel anomalies, it gives you the visibility you need to stay ahead of problems and reduce the time its takes to resolve them. If you’re also looking to expand this pipeline with alerts, structured log parsing, or advanced Graphite metrics, we’d love to help. Reach out to the MetricFire team today and let’s build something great together!

