
Table of Contents
- Introduction
- Step 1: Enable the MySQL Slow Query Log
- Step 2: Simulate a Slow MySQL Query
- Step 3: Install and Configure Promtail to Collect System Logs
- Step 4: Create a Loki Data Source in our Hosted Grafana
- Step 5: Visualize the Slow Query Logs
- Step 6: Configure Telegraf to Send Corresponding MySQL Metrics
- Conclusion
Great systems are not just built. They are monitored.
MetricFire runs Graphite and Grafana as a fully managed service for growing engineering teams, taking care of storage, scaling, and version updates so your team doesn't have to. Plans start at $19/month, billed per metric namespace rather than per host, and include engineer-staffed support. Integrations work natively with Heroku, AWS, Azure, and GCP, and data is stored with 3× redundancy in SOC2- and ISO:27001-certified data centres.
Introduction
When a service slows down, metrics will tell you that it’s happening but logs tell you why. For MySQL, slow queries can be a silent performance killer, gradually chewing through resources until users start complaining. By enabling MySQL’s slow query log and forwarding it to Loki (via Promtail), you can visualize query-level details right alongside your metrics on Grafana dashboards. This makes it easy to correlate what is slow (metrics) with what is causing the slowdown (logs).
In this complete observability guide, we’ll walk through enabling the MySQL slow query log, shipping logs to a Hosted Loki endpoint via Promtail, collecting corresponding MySQL performance metrics with Telegraf, and viewing both in a Hosted Grafana environment for a complete picture of database health.
Start a chat with us today if you are interested in testing MetricFire's Logging Integration for FREE. We will help you every step of the way, from collection to visualization!
Step 1: Enable the MySQL Slow Query Log
This article assumes that you are already running an instance of MySQL. These commands will tell MySQL to log any query taking longer than 0.5 seconds, and will write those entries to /var/log/mysql-slow.log (kept in the same directory as other system logs for simplicity). Run the following commands from within your server (Ubuntu example):
sudo tee /etc/mysql/mysql.conf.d/zz-slowlog.cnf >/dev/null <<'EOF'
[mysqld]
slow_query_log=1
slow_query_log_file=/var/log/mysql-slow.log
long_query_time=0.5
EOF
Create the log file, set the correct permissions, and restart MySQL to apply the changes:
sudo touch /var/log/mysql-slow.log
sudo chown mysql:mysql /var/log/mysql-slow.log

sudo systemctl restart mysql
Step 2: Simulate a Slow MySQL Query
This step is optional, but is a quick and easy way to send some test 'slow-queries' to your log output file.
Create a Sample Database and Table
From within your mysql command line, insert some dummy data to use for our slow query tests:
CREATE DATABASE IF NOT EXISTS shopdb;
USE shopdb;

CREATE TABLE IF NOT EXISTS customers (
    id INT AUTO_INCREMENT PRIMARY KEY,
    name VARCHAR(50),
    email VARCHAR(50)
);

INSERT INTO customers (name, email) VALUES
('Elliot', 'elliot@example.com'),
('Ben', 'ben@example.com'),
('Luis', 'luis@example.com');
Generate a Slow Query for Testing
Run a query that deliberately sleeps for 1 second to trigger the slow query log:
USE shopdb;
SELECT SLEEP(1) /* TEST_QUERY: mysql-slowlog-demo */,
       COUNT(*) AS total_customers
FROM customers
WHERE email LIKE '%@example.com';
Now from within your server, tail the mysql-slow.log to confirm a valid output:
sudo tail -n 20 /var/log/mysql-slow.log
Step 3: Install and Configure Promtail to Collect System Logs
We support log collection via OpenTelemetry Contrib and Promtail. In this example, we'll detail how to configure Promtail since it is an official log shipping agent for Grafana Loki. It runs as a lightweight binary that tails log files (like /var/log/*) and forwards them to our Hosted Loki endpoint over HTTP.
Install/unpack Promtail (Ubuntu)
wget https://github.com/grafana/loki/releases/download/v3.5.3/promtail_3.5.3_amd64.deb

sudo apt-get install -y ./promtail_3.5.3_amd64.deb
Configure Promtail to Forward Logs
Update your Promtail configuration file at /etc/promtail/config.yml to include the following:
server:
  http_listen_port: 9080
  grpc_listen_port: 0

positions:
  filename: /tmp/positions.yaml

clients:
  - url: https://<YOUR-API-KEY>@www.hostedgraphite.com/logs/sink

scrape_configs:
  - job_name: varlogs
    static_configs:
      - targets:
          - localhost
        labels:
          host: <HOST-NAME>
          job: varlogs
          __path__: /var/log/*.log
NOTE: Make sure to replace YOUR-API-KEY and HOST-NAME in the above config and restart the Promtail service:
sudo systemctl restart promtail
sudo systemctl status promtail
You may also need to assign permissions to allow Promtail to read your /var/log/* files:
sudo usermod -aG adm promtail
sudo systemctl restart promtail
Step 4: Create a Loki Data Source in our Hosted Grafana
REACH OUT TO US about trying our new Logging feature for FREE, and we will create a Loki Access Key in your Hosted Graphite account. If you don't already have a Hosted Graphite account, sign up for a free trial here to obtain a Hosted Graphite API key and Loki Access Key.
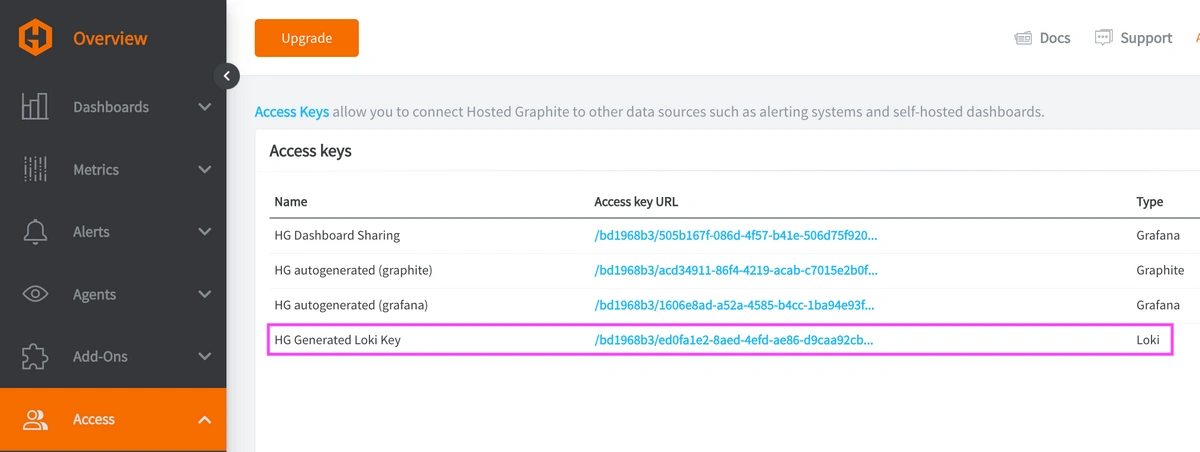
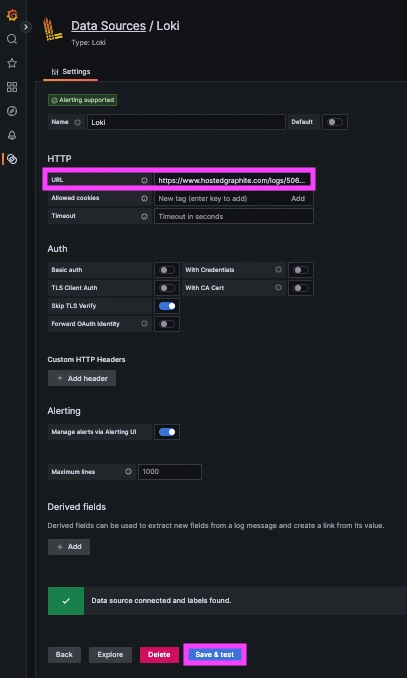
Now within the Hosted Graphite UI, you can navigate to Dashboards => Settings => Data sources => Add New Data source (Loki). You'll be able to add the URL for your HG Loki endpoint, which includes your new Loki Access Key: https://www.hostedgraphite.com/logs/<UID>/<LOKI-ACCESS-KEY>
Step 5: Visualize the Slow Query Logs
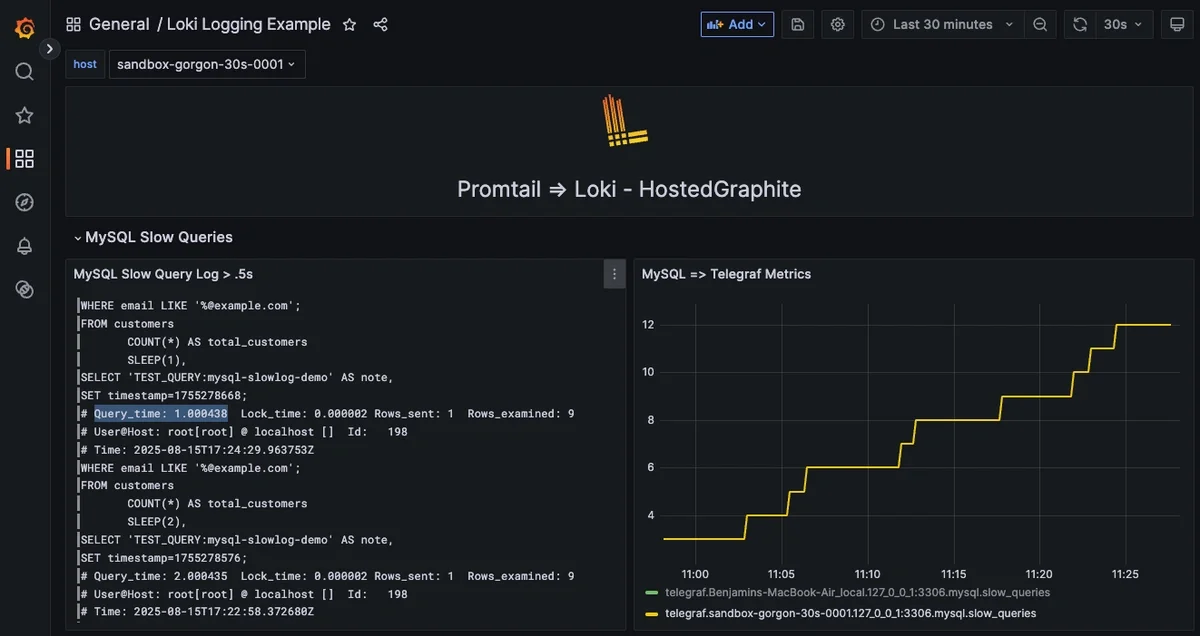
Once system logs are forwarded to our Loki endpoint and the data source is connected in your Hosted Grafana, you can create a new dashboard panel, select Loki as your Data source, and format a query using 'code mode'.
Example query: {job="varlogs", filename="/var/log/mysql-slow.log"}
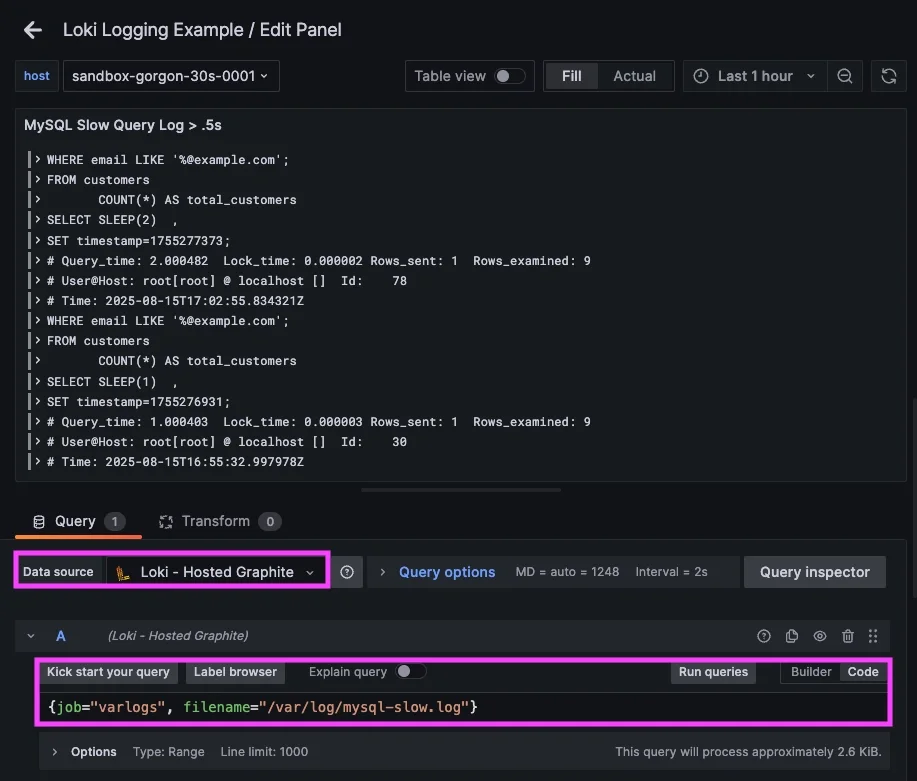
Now you can see all queries that take > .5 seconds to complete, and what the exact query is! Execute some more 'slow test queries' in MySQL and see them immediately appear on your dashboard after a panel refresh.
Step 6: Configure Telegraf to Send Corresponding MySQL Metrics
Create a Telegraf MySQL User and Assign Permissions
Before you install/configure Telegraf, you need to add a dedicated MySQL user for Telegraf with read permissions. Just run these commands from within your mysql command line:
CREATE USER IF NOT EXISTS 'telegraftest'@'localhost' IDENTIFIED BY 'password123';
CREATE USER IF NOT EXISTS 'telegraftest'@'%' IDENTIFIED BY 'password123';
GRANT PROCESS, REPLICATION CLIENT, SELECT ON *.* TO 'telegraftest'@'localhost';
GRANT PROCESS, REPLICATION CLIENT, SELECT ON *.* TO 'telegraftest'@'%';
FLUSH PRIVILEGES;
Setup the Telegraf Collector
If you don't already have an instance of Telegraf running in your server, install our handy HG-CLI tool to quickly install/configure Telegraf:
curl -s "https://www.hostedgraphite.com/scripts/hg-cli/installer/" | sudo sh
NOTE: You will need to input your Hosted Graphite API key, and follow the prompts to select which metric sets you want.
Once it's installed, open the Telegraf configuration file at: /etc/telegraf/telegraf.conf and add the following section:
[[inputs.mysql]]
  servers = ["telegraftest:password123@tcp(127.0.0.1:3306)/?tls=false"]
  metric_version = 2
Ship MySQL Metrics to Hosted Graphite
Simply save your updated conf file, and restart the Telegraf service to forward MySQL performance metrics to your HG account. Or run it manually to inspect the output for potential syntax/permission errors:
telegraf --config /etc/telegraf/telegraf.conf
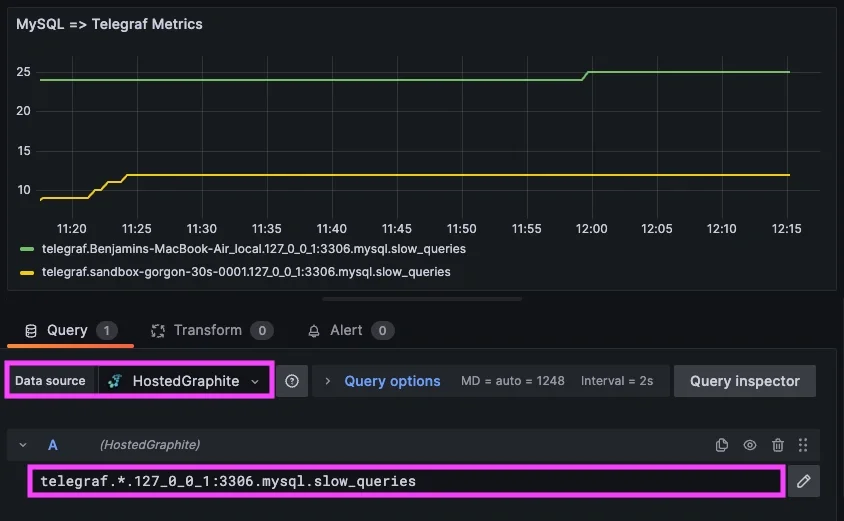
Once these metrics hit your Hosted Graphite account, you can use them to easily create custom dashboards and alerts! Example metric query: telegraf.*.127_0_0_1:3306.mysql.slow_queries
Conclusion
By the end of this walkthrough, you’ve put the two most important DB signals under the same pane of glass:
- MySQL Logs (Promtail => Hosted Loki): captures every slow statement with Query_time, Rows_examined, and the full SQL text to explain which queries caused the change.
- MySQL Metrics (Telegraf => Hosted Graphite): tracks the overall service health to spot and alert you when the performance changes.
This pairing delivers a complete feedback loop. A spike in the slow_queries data no longer starts a guessing game, because now you can see the exact offenders and how long they took to execute. That shortens the average time to repair during incidents, and guides sustainable fixes that are backed by hard data. By visualizing logs alongside metrics, you can troubleshoot faster, spot patterns more easily, and get critical context around performance issues or system events. Instead of jumping between tools or manually inspecting your server logs, you can correlate a spike in metrics with the exact log line that makes sense, all in a single dashboard.
MetricFire's Hosted Loki logging integration is quick to set up but powerful in practice. Whether you're tracking security threats, service restarts, failed jobs, or kernel anomalies, it gives you the visibility you need to stay ahead of problems and reduce the time its takes to resolve them. Reach out to the MetricFire team today and let’s build something great together!

