
Table of Contents
Great systems are not just built. They are monitored.
MetricFire runs Graphite and Grafana as a fully managed service for growing engineering teams, taking care of storage, scaling, and version updates so your team doesn't have to. Plans start at $19/month, billed per metric namespace rather than per host, and include engineer-staffed support. Integrations work natively with Heroku, AWS, Azure, and GCP, and data is stored with 3× redundancy in SOC2- and ISO:27001-certified data centres.
Introduction
In this article, we are going to look at what are the possible options available to users in terms of monitoring their applications hosted in the Google Cloud Platform. Graphite and Grafana are examples of the great tools available for monitoring time-series metrics for your cloud-hosted applications.
There are also hosted monitoring options available for Google Cloud users through MetricFire’s offering of Hosted Graphite and Hosted Grafana. We will do a thorough comparison of both methods and list the pros and cons of each.
The easiest way to get started is to jump onto MetricFire’s free trial where you can try out Graphite and Grafana in just a few minutes. You should book a demo with MetricFire’s team and talk about your monitoring strategy!
This article assumes basic familiarity with Cloud platforms such as Google Cloud, and Azure Cloud, and basics of monitoring applications. If you need to know more about Graphite and Grafana, check out our Graphite intro here, and our Grafana intro here.
Key Takeaways
- Graphite and Grafana: Powerful tools for monitoring time-series metrics in Google Cloud.
- Google Cloud Monitoring: Offers pre-built dashboards with limited customization options.
- MetricFire's Hosted Graphite and Hosted Grafana: Provides customizable monitoring options with multiple chart types and data source integration.
- Unique features of MetricFire: Intuitive alerting, extensibility through plugins, and comprehensive data views.
Introduction to Google Cloud Platform
Google Cloud is one of the most popular platforms for building and deploying cloud applications, whether that's cloud applications for startups or enterprises. Google Cloud provides all the major features of cloud services such as Compute Engine, Storage, Containers, Virtual Machines, Cloud Storage, Virtual Private Cloud, Load Balancing, Content Delivery Network (CDN), Domain Name Service (DNS), Big Data, Queue Messaging and much more. Launched in 2008, Google Cloud has multiple data centers around the world.
Getting Started with Google Cloud Platform
Once you create an account with Google Cloud Platform and login into its console at https://console.cloud.google.com/, this dashboard is presented:
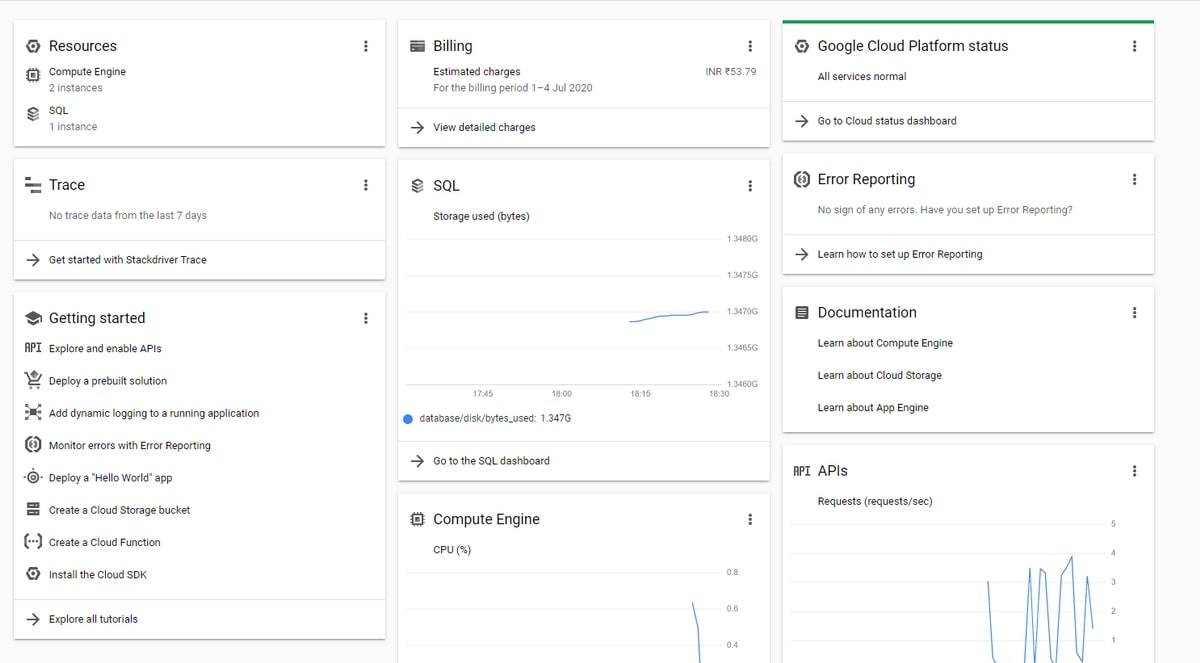
It shows the overview of the usage of your computer, databases, billing details, and helpful links.
This dashboard shows that we already have a few VM computers and a Google Cloud SQL server up and running to be monitored in this Google Cloud account.
Monitoring in Google Cloud
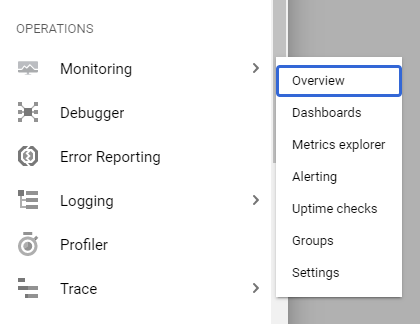
Let’s dive deep into Google Cloud Monitoring. Google Cloud Monitoring is invoked by navigating to the Operations section in the left-hand pane as shown below.
When you click Overview for the first time it will take a few minutes to build and prepare the monitoring workspace. As soon as the workspace is built, we get a dashboard showing the following information:
- Resource dashboards: A list showing different components being monitored in this Google Cloud account.
- Cloud SQL Database: CPU Utilization
- Cloud SQL Database: Queries per minute
- Cloud SQL Database: No. of connections
- Cloud SQL Database: Memory Utilization
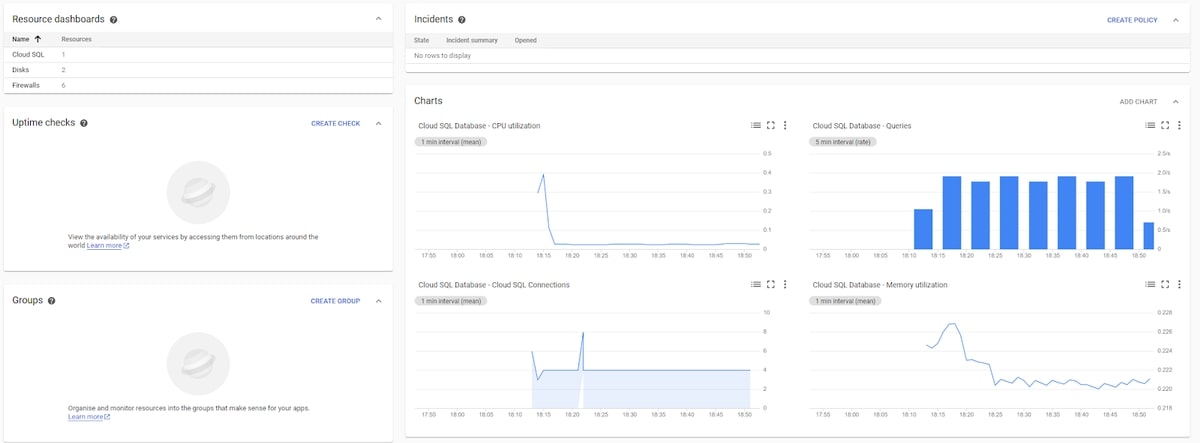
One thing I immediately noticed is that there is no dashboard for monitoring my computer, which is strange.
Let’s go into the Dashboard pane from the left-hand section. You will get the following information:
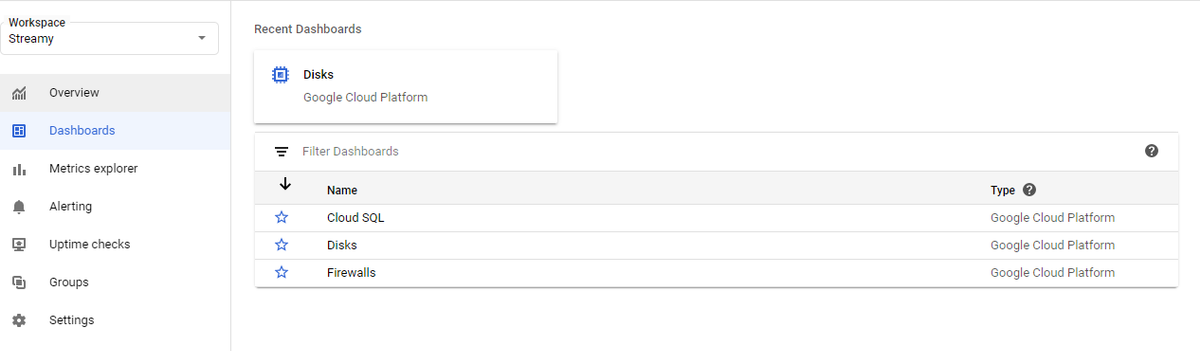
This section allows me to browse the monitoring dashboard for each of the components: Cloud SQL, Disks, and Firewalls.
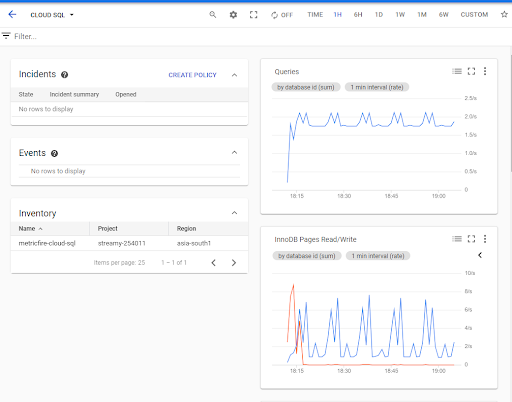
The Cloud SQL dashboard shows a little more information about my Cloud SQL instances than the Overview page. The top bar of this page is called the Chart toolbar. A few points worth mentioning about the chart toolbar:
- We can set the display period starting from 1 hour to 6 weeks. There is an option to set a custom period as well.
- Auto-Refresh can be turned off. However, there is no way to set a custom refresh interval.
- For these pre-built dashboards, there is no customization option to set chart type - for example, bar chart, pie chart, single value, etc. there is also no option to customize legends or overlay multiple series on a single chart.
- The only relevant option in these charts is to export the chart as a PNG image.
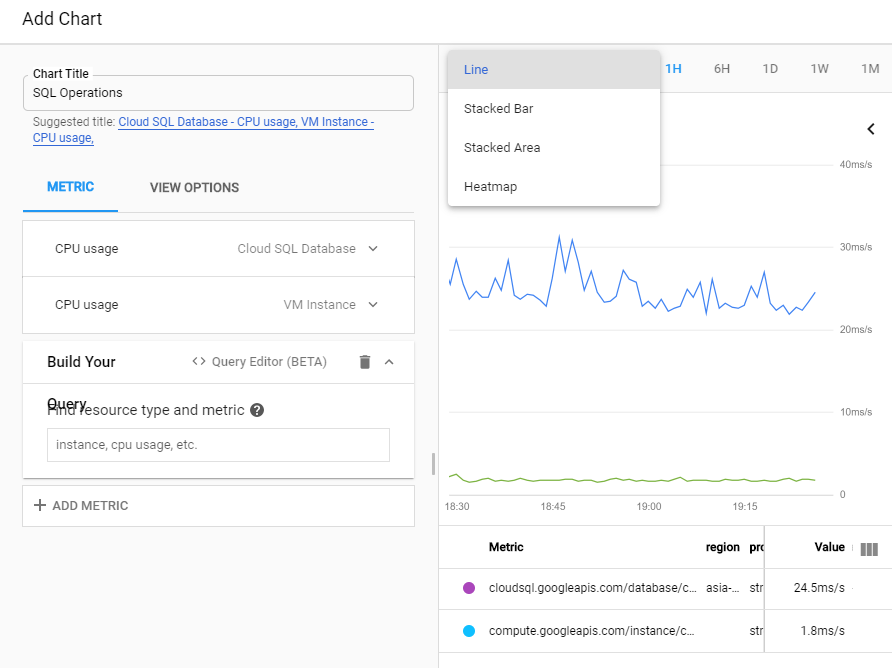
We’ll now create a custom dashboard and try to create a chart to see if we get the customization tools we are looking for.
After a lot of struggle, I was able to create a chart that overlays the CPU Usage of my Cloud SQL instance and Compute instance in one chart. Users coming from Grafana will be disappointed by only four chart options: Line, Stacked Bar, Stacked Area, and Heatmap.
If you are looking for dashboarding with massive functionality, definitely check out Grafana. You can try out Grafana in minutes by using MetricFire’s Hosted Grafana.
There is also a Query Editor which allows you to select the metrics you want to monitor through a query, however, it's in BETA and its UI is garbled (shown below).
I created a custom dashboard containing four charts each depicting CPU Utilization, Memory Utilization, Disk Utilization, and Network Utilization for all my computer and Cloud SQL instances.
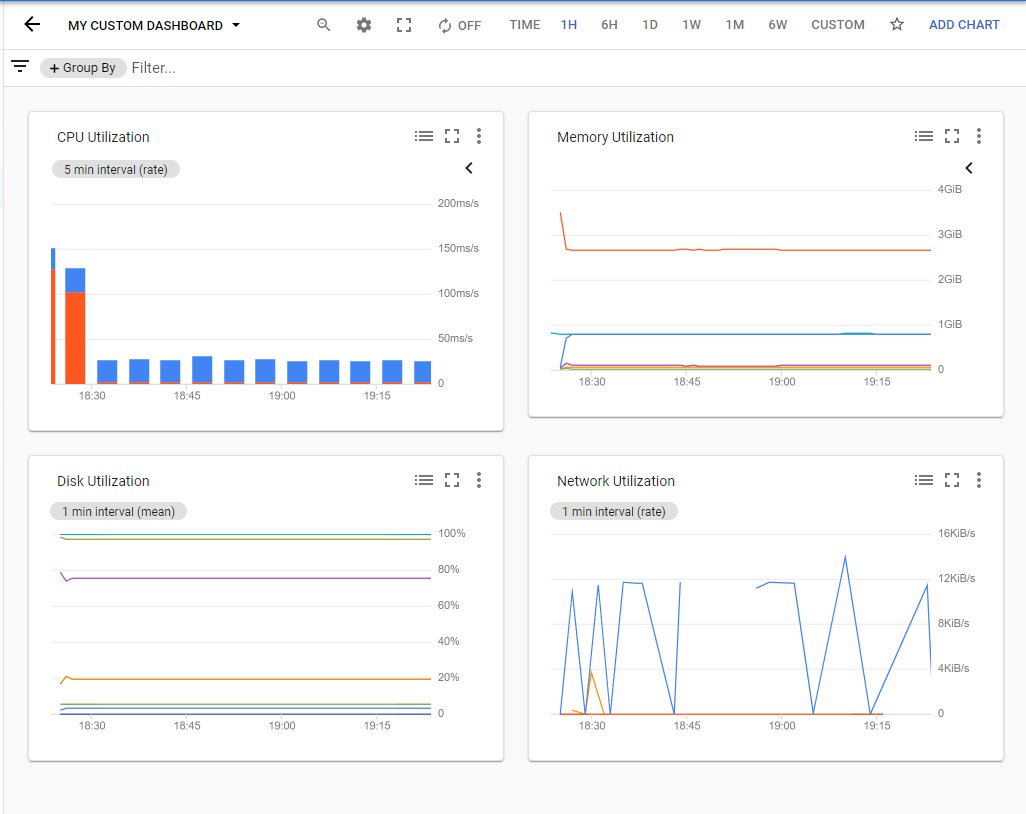
Experienced users will definitely notice the lack of customization options in Google Monitoring Dashboards and Charts such as:
- No options to choose a different measuring interval other than 1 min or 5 min
- No plotting of metrics in terms of percentiles such as p90 or p95 percentiles
- Lack of other chart types such as Gauges, Pie Chart, etc.
- No customization options for horizontal and vertical axes
Monitoring in MetricFire
MetricFire is a monitoring tool built on open-source technologies such as Graphite and Grafana and provides the scalable monitoring platforms Hosted Graphite and Hosted Grafana.
MetricFire can easily integrate with GCP by configuring your applications to send metrics over to MetricFire. MetricFire will host the storage, querying, backups, and visualizations of all your data - without you doing anything beyond configuring an agent or a StatsD/collectd type daemon.
Some of the unique features of MetricFire’s offering are:
- Multiple Chart Types and Customization Options: Hosted Grafana is built on top of Grafana, which is one of the most popular visualization tools in the market. There are loads of chart types and customization options for each chart type. Check out our article Our Favorite Grafana Dashboards to see the power of Grafana Dashboards.
- Multiple Data Sources: Hosted Grafana and Hosted Graphite can consume data from multiple data sources. It can also integrate with Google StackDriver to monitor the metrics provided by Google Cloud. If your technology stack is not entirely hosted in Google Cloud, then it makes perfect sense to have monitoring driven by MetricFire because that will provide a central place to monitor the entire tech infrastructure rather than having to look at multiple places.
For more detailed instructions, have a look at the article “Introducing Stackdriver as a data source for Grafana” in Google Cloud. Anything that is available through the open-source Grafana project is also available as a Hosted Grafana SaaS through MetricFire.
- Data Views: Hosted Graphite automatically provides different statistical views of the metrics at the most appropriate resolution which allows for fast loading times for the dashboards. Read our article Data Views on the various metrics pre-calculated (and included for free) by Hosted Graphite.
- Intuitive Alerting: It is very easy to set up alerts in Grafana when metrics breach a certain threshold level. Check out the article Grafana Alerting to see how you can set up custom alerts very easily from within the chart itself.
- Extensibility: Grafana is designed to be extensible through Plugins. It supports custom plugins and developers keep coming up with new plugins to let Grafana integrate with newer data sources. Check out our article Grafana Plugins for more information on this.
Conclusion
In this article, we saw the comparison of monitoring tools provided by Google Cloud and MetricFire’s Hosted Graphite and Hosted Grafana.
Google Cloud Monitoring provides ready-made dashboards and charts to monitor the applications hosted on Google Cloud. Creating custom dashboards and charts isn’t intuitive and there aren’t many customization options.
MetricFire provides production-ready Hosted Graphite and Hosted Grafana which come with tons of features that make monitoring applications absolutely seamless. MetricFire can monitor your GCP applications as well as your surrounding infrastructure, and do custom metrics so you can get the observability you need.
Sign up for the MetricFire free trial to set up Graphite and build Grafana dashboards now. You can also book a demo and talk to the MetricFire team about how you can best set up your monitoring stack.


