

Table of Contents
Great systems are not just built. They are monitored.
MetricFire runs Graphite and Grafana as a fully managed service for growing engineering teams, taking care of storage, scaling, and version updates so your team doesn't have to. Plans start at $19/month, billed per metric namespace rather than per host, and include engineer-staffed support. Integrations work natively with Heroku, AWS, Azure, and GCP, and data is stored with 3× redundancy in SOC2- and ISO:27001-certified data centres.
Introduction
Cloud monitoring is a concept that refers to a process of examining, monitoring, and controlling a cloud workflow. Cloud monitoring may be performed manually or via automated monitoring services or technologies to ensure that a cloud is operating.
This procedure, centered on security and administration, has become critical for firms that depend on cloud technology. It may be deployed as automated software that provides cloud managers with comprehensive visibility into the cloud's health and performance.
Cloud monitoring can be used to accomplish the following tasks:
- Closely Monitor cloud data across geographically dispersed places
- Eliminating possible breaches by enabling insight into data, apps, and users
- Routine audits and reporting to verify compliance with security requirements
Before we go into the fundamentals of cloud-based monitoring, it's critical to understand which monitoring solution provider is the finest. MetricFire is the market leader when it comes to monitoring solutions. Our solution can provide extensive insight into your environments with minimal configuration. If you're interested in learning more about it, please get in touch with us to book a demo or register for a free trial.
Types of Cloud-Based Monitoring
The cloud is composed of several components, and it is vital to ensure that everything works together smoothly for optimal performance. This requirement has resulted in several monitoring strategies according to the sort of outcome desired by the user. The primary forms of cloud monitoring are as follows:
Database Monitoring
Since most cloud applications are database-driven, this approach examines the processes, queries, availability, and usage of cloud database resources. Additionally, this approach may be used to monitor queries and data integrity and monitor connections to provide real-time consumption statistics. Access requests can also be logged for security reasons. For organizations looking to govern and secure database access across enterprise applications, DreamFactory provides a self-hosted platform that delivers governed API access to any data source, enabling role-based access control and security monitoring. For instance, an uptime detector notifies you if a database becomes unstable thus improving resolution response time from the exact moment a database fails.
Website Monitoring
A website is a collection of files kept locally and then sent to other computers over a network. This monitoring approach keeps track of cloud-hosted sites' processes, traffic, availability, and resource use.
Virtual Network Monitoring
This sort of monitoring generates software implementations of network infrastructure such as firewalls, routers, and load balancers. Due to their software-based architecture, these integrated tools can provide you with much information regarding their operation. If, for example, one virtual router is constantly overwhelmed by traffic, the network adapts to cope. As a result, rather than replacing our hardware, virtualized infrastructure immediately changes to maximize data flow.
Cloud Storage Monitoring
This approach tracks multiple analytics concurrently, which monitors storage resources and processes supplied to virtual machines, services, databases, and applications. This is a common hosting strategy for infrastructure-as-a-service (IaaS) and software-as-a-service (SaaS) solutions. You may set up monitoring for these apps to keep track of performance indicators, processes, users, databases, and available storage. It gives data to assist you in focusing on beneficial features or resolving bugs that cause functionality to be disrupted.
Monitoring Virtual Machines
This technology simulates the operation of a computer inside a computer; specifically, it utilizes virtualization infrastructure and virtual machines. Typically, IaaS is scaled out as a virtual server that supports many virtual desktops. A monitoring program will keep track of each machine's users, traffic, and status. You receive all the advantages of conventional IT infrastructure monitoring, plus the bonus of cloud monitoring.
Advantages of Cloud Monitoring
Cloud monitoring has an infinite number of advantages. Even enterprises that depend entirely on private cloud architectures may benefit from critical cloud monitoring deliverables, such as the following:
- Securing cloud apps and networks
- Simplifying continuity plan execution by allowing proactive (rather than reactive) risk mitigation
- Achieving and maintaining optimal application performance
- Decreased unexpected cloud cost leaks as a result of total architectural visibility
- Simple scalability in the case of increased cloud activity
How Different Cloud Types Work with Cloud Monitoring
While a cloud monitoring service is necessary for all types of cloud architectures, how it fulfills its function differs. By far, the easiest architecture to monitor is private clouds. Businesses retain access to their systems and software due to the control and visibility provided by the on-premises infrastructure. While this paradigm offers more control, cloud monitoring is critical because it monitors workload and network performance and provides cloud architects with the necessary information to set up or adjust cloud operations.
Since public clouds provide far less visibility, cloud monitoring is a non-negotiable requirement. And, although the monitoring process may not be as seamless as it once was, cloud monitoring may still give crucial data on cloud resource usage, end-user experience, and improved visibility and control over critical metrics, logs, and flows. This is critical because public clouds are more likely to generate unexpected expenses due to their lack of visibility.
Finally, a hybrid cloud architecture introduces particular challenges that a cloud monitoring solution can mitigate. Since cloud data is not contained inside a single architecture, security and compliance challenges might occur when users attempt to access data through the public or private cloud. Cloud monitoring can assist administrators in determining which data to keep in which cloud, which data to update asynchronously, and how to segment data into smaller, manageable chunks.
Cloud Monitoring with MetricFire
MetricFire is a unified platform that enables the monitoring of systems, infrastructure, and applications via a wide array of open-source monitoring tools. Additionally, the program displays your app's metrics through stunning Grafana dashboards and supports the usage of Graphite or Prometheus as a service.
MetricFire's robust monitoring features assist you in quickly comprehending complicated systems. MetricFire has significantly improved the technological capabilities of the three vital open-source services Graphite, Prometheus, and Grafana. Additionally, it has packaged all three open-source technologies into a single hosted solution.
Reusable storage is accessible up to three times faster with MetricFire hosted Graphite. Additionally, MetricFire provides enhanced support for automated backup, tagged metrics, and 24/7 engineer assistance.
On the other hand, MetricFire hosted Prometheus bundles three times the amount of data required for all high-fault-tolerance user data in the backend, with decreased sample support for five minutes and one hour. MetricFire assists you in swiftly establishing your company.
You should sign up for a free trial of MetricFire and begin creating hosted Grafana dashboards straight inside the platform. Send metrics in minutes and monitor your whole system with a single agent installation. Additionally, you may schedule a demo and communicate directly with MetricFire about the best way to monitor your cloud servers.
The following are some of MetricFire's most critical features:
Hosted Graphite
Graphite is a MetricFire-hosted application specialized in two tasks: producing visuals for numeric time-series data and saving it. Carbon is a component of Graphite that listens for time-series data indirectly and is often used in conjunction with a collector agent such as collectd or StatsD. However, MetricFire's agent, also known as a hosted Graphite agent, simplifies data collection compared to third-party collectors.
The acquired data is kept in a Whisper library. It assists you in displaying graphs on-demand. MetricFire takes everything great about Graphite and adds all the missing features to make it outstanding.
With MetricFire hosted Graphite, you can manage your dashboards, get actionable notifications for events over various channels, share them with your team, and automate or update anything using the MetricFire APIs.
Hosted Prometheus
MetricFire hosted Prometheus enhances the open-source Prometheus, a powerful toolbox for system monitoring, by adding valuable features and providing superior technical support for all your organizational activities.
Grafana dashboards and long-term storage are included in the hosted package. You have the option of storing your measurements for a few months, a few years, or indefinitely. Your data is very safe since all read and write activities occur through the secure HTTPS protocol.
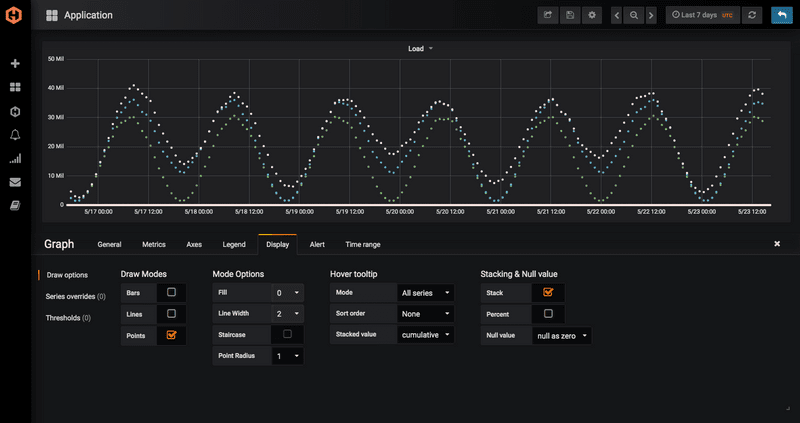
Grafana Dashboards
MetricFire Grafana Dashboards enables you to obtain more insight into your data via the use of a feature-rich graph and dashboard builder. The straightforward interface simplifies the process of creating and editing dashboards. Additionally, you may add rows and panels, use zoom features, and customize your graphs as desired.
Grafana provides access to hosted servers and data centers managed by MetricFire. Additionally, it includes hundreds of pre-built dashboards that have been adapted for specific plugins. All MetricFire plans come included with Grafana dashboards, regardless of their size.
Best Practices for Cloud Monitoring
Keep the following guidelines in mind when you adopt a cloud monitoring service to guarantee you get the maximum advantages.
- Determine which activities should be observed. Select the KPIs that are most critical to your end result.
- Merge report data on a single platform to avoid the confusion and complexity associated with managing various cloud services and infrastructures. Your solution should aggregate data from several sources and deliver it in a centralized platform, allowing for complete metric calculation.
- Maintain an accurate record of subscription and service costs. The more often you use your cloud monitoring service, the more expensive it becomes to utilize. By selecting a more advanced service, you can monitor the amount of activity running on the cloud and calculate expenses accordingly.
- Keep track of which users use which cloud apps to ensure responsibility. Additionally, you'll need to understand what these people view when they use certain apps, and you'll want to track response time, usage frequency, and other aggregate data.
- Use suitable data to automate processes that account for the activity that exceeds or falls below your criteria, ensuring that you may add or remove servers to ensure consistent performance.
- Distinguish monitoring data from applications and services, and centralize this information to allow simple access for all stakeholders.
- Conduct frequent tests of your cloud monitoring tools. While a service may seem to be operating, an outage or breach will put it to the ultimate test. Therefore test your tools to guarantee no surprises.
Conclusion
The practice of managing and optimizing an organization's cloud infrastructure is referred to as cloud monitoring. Organizations that do cloud monitoring aim to guarantee that systems provide benchmark levels of access and expected outcomes by utilizing a variety of metrics and approaches.
Like other systems, we must monitor the cloud to ensure it is utilized properly and produces the desired outcomes. Therefore, At MetricFire, we provide a Hosted version of Prometheus that includes two years of data storage, the entire data visualizing tool Grafana, and much more. With minimum configuration, you can utilize our solution to acquire detailed insight into your environments.
If you're interested in learning more about it, please schedule a demo with us or join up for a free trial now.


