
Table of Contents
Great systems are not just built. They are monitored.
MetricFire runs Graphite and Grafana as a fully managed service for growing engineering teams, taking care of storage, scaling, and version updates so your team doesn't have to. Plans start at $19/month, billed per metric namespace rather than per host, and include engineer-staffed support. Integrations work natively with Heroku, AWS, Azure, and GCP, and data is stored with 3× redundancy in SOC2- and ISO:27001-certified data centres.
Building and deploying highly scalable, distributed applications in the ever-changing landscape of software development is only half the journey. The other half is monitoring your application states and instances while recording accurate metrics.
There are moments when you wish to check how many resources are being consumed, how many files are under access by the specialized process, etc. These metrics provide valuable insights into our tech stack execution and management. This gives us leverage to understand the ultimate performance of what we have designed and eventually helps us optimize.
A vast majority of tools are already out there to get the job done, but today we will be talking about the specifics of StatsD. We will learn how to deploy your own Python StatsD client, how to employ it for monitoring your Python applications, and then eventually store the recorded metrics in a database. Afterward, if you want to see your StatsD metrics displayed on Grafana Dashboards, powered by Graphite, sign up for our free trial. But first, let’s get started with StatsD!
Key Takeaways
- Metrics provide valuable insights into the execution and management of your tech stack, helping you optimize your applications.
- StatsD is a node.js project that collects and listens to system performance metrics, offering easy integration with tools like Grafana, Graphite, and InfluxDB.
- StatsD operates on a push model, where the application sends metrics to the monitoring system as they come, as opposed to the pull model where the monitoring system scrapes data from the app's HTTP endpoint.
- StatsD metrics can be sent to Graphite for storage and visualization. Graphite is a monitoring tool that stores numeric time-series data and renders graphs on demand.
- The StatsD Python client also comes with an API that can be triggered through HTTP requests for integration.
What is StatsD?
StatsD is a node.js project that collects and listens to statistics and system performance metrics. These statistics are in turn sent over the network allowing us to collect varying kinds of metric data. A major advantage of using StatsD is the easy integration it offers with other tools like Grafana, Graphite, InfluxDB, etc.
Pros of StatsD
- Superior start-up time
- Processing of percentiles is done by the server, giving us aggregated views of multiple instances at a time (for the same service).
- It gives comparatively lower overhead on the client side.
- Employs UDP for transmitting all data preventing connectivity issues.
- Simple, effective, and easy to implement when building short-lived apps.
- Less memory utilization since metrics are only pushed to the server as they come.
But… what do you mean metrics are ‘pushed’ as they come?
Primarily, metric reporting has two execution models. In the pull model, the monitoring system "scrapes" your app at the given HTTP endpoint. In the push model, which is used by StatsD, the application sends the metrics to the monitoring system as they come. This push-based approach makes it straightforward to integrate metrics into your applications without requiring your monitoring backend to continuously poll endpoints.
Prerequisites & Installation
1. First up, we need Python 3.6 or above and pip installed in the system.
You can verify your Python installation by running the following commands in your Linux, Windows, or macOS system.
$ python --version
If not installed, check out these installation instructions for your system.
2. You will need StatsD, Flask, and Flask-StatsD, to collect Flask-related metrics automatically. Along with that, we would need virtualenv - a tool to create isolated Python environments and SQLALCHEMY, a sample database.
pip install StatsD, flask, Flask-StatsD, virtualenv, Flask-SQLAlchemy
Pip will automatically install the latest versions of these packages.
Let’s have some fun by using the StatsD package
We will start by implementing a Basic Timer:
import statsd
timer = statsd.Timer('Statsd_Tutorial_Application')
timer.start()
# we can do just about anything over here
timer.stop('TutorialTimer')
Similarly, for a Basic Counter:
import statsd
counter = statsd.Counter('Statsd_Tutorial_Application')
# again do anything random over here
counter += 1
Monitoring with Flask
For this tutorial, we’ll design a basic to-do list application on Flask and record the operational metrics.
The complete tutorial repo can be forked from GitHub.
Step 1: Import dependencies - Lines 5-12:
from flask import Flask, request
from flask import render_template
from flask import redirect
from flask_sqlalchemy import SQLAlchemy
import time
import statsd
Step 2: Start Flask App, StatsD Client, and DB - lines 14-23:
c = statsd.StatsClient('localhost',8125)
app = Flask(__name__)
app.config['SQLALCHEMY_DATABASE_URI'] = 'sqlite:///test.db'
app.config['SQLALCHEMY_TRACK_MODIFICATIONS'] = True
db = SQLAlchemy(app)
Create a task class and define it in the DB model - lines 26 - 35:
class Task(db.Model):
    id = db.Column(db.Integer, primary_key=True)
    content = db.Column(db.Text)
    done = db.Column(db.Boolean, default=False)

    def __init__(self, content):
        self.content = content
        self.done = False

db.create_all()
- Create a variable ID for the DB column that holds integers as our primary key.
- Create a content column for text.
- Create a done column for a boolean value defaulting to false to signal whether the task is completed/resolved or not.
- Initiate the content and do columns.
- Return our database in printable form.
- Initiate our new DB by creating it.
Now, we add a task - lines 42 - 57:
@app.route('/task', methods=['POST'])
def add_task():
    start=time.time()
    content = request.form['content']
    if not content:
     dur = (time.time() - start) *1000
     c.timing("errortime",dur)
     c.incr("errorcount")
        return 'Error'

    task = Task(content)
    db.session.add(task)
    db.session.commit()
    dur = (time.time() - start) *1000
    c.timing("tasktime",dur)
    c.incr("taskcount")
The code adds a task’s contents received from the form in the POST request. However, what’s more, important to be discussed over here is the metric reporting that is added.
- As soon as the function starts, the basic timer is initiated.
- If there’s an error in the content, then errors are incremented in a basic counter. Similarly, the error’s time is noted. Eventually, the error is returned.
- Once the DB has added the task, the complete duration for which the function ran is calculated and the incrementer is updated. The total duration is also updated.
Deletion of the task - lines 60 - 65:
@app.route('/delete/<int:task_id>')
def delete_task(task_id):
    task = Task.query.get(task_id)
    db.session.delete(task)
    db.session.commit()
    c.incr("deletecount")
The above code executes the deletion of a task from the DB by adding the delete count to the basic counter for incrementation.
Sending Metrics from StatsD to MetricFire
Recording these metrics with StatsD does the job for beginners. However, for a more industry-grade production-ready environment, these metrics should be handled by a service that makes storing and handling graphs easy for us. This is where Graphite comes in.
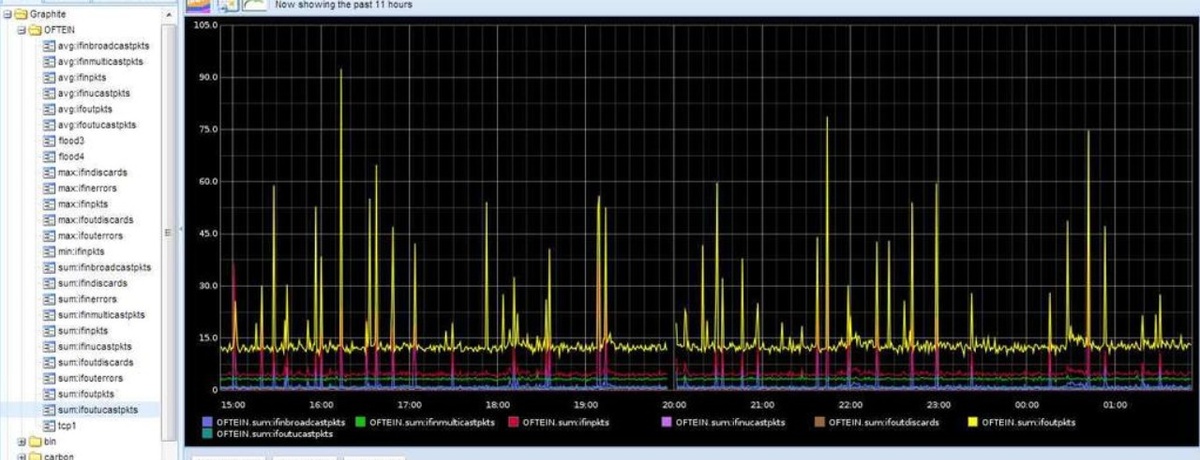
Introducing Graphite:
Graphite is designed to be a monitoring tool that is employed to track the performance of websites, applications/other services, and network servers. Graphite is one of those sensations in the tech world which essentially ignited a new generation of monitoring tools, making it much easier to not just store and retrieve, but also share and visualize time-series data.
Graphite essentially performs two operations:
- Store numeric time-series data
- Render graphs of this data on demand
Graphite is not a collection agent and shouldn’t be treated like one, rather it offers a simpler path for getting your measurements into a time-series DB. To test sending metrics from your server or local machine to an already running graphite instance, run the following single-line command:
`$ echo "foo.bar 1 `date +%s`" | nc localhost 2003`
Once installed, simply logging metrics with StatsD will make Graphite pick up on all the data logged. Now, Graphite seems to be a big deal, however, there are still certain fallbacks of Graphite that developers would like to get resolved. This is where MetricFire comes in.
Why MetricFire:
- Provides Graphite-as-a-Service
- Has added a built-in agent to fill the gaps in the current graphite edition
- Allows team accounts, to resolve previous issues with collaboration
- Custom granular dashboard permissions
- Amazing integrations with other services like AWS, Heroku, etc.
- Operations through APIs will supercharge your development
- Hourly backups of dashboard and user data
- Easy and fast scaling as required
- Proven track record in graphite monitoring
- 24/7 support from experienced engineers
- Easily available with a plug-and-play model
But if you would still prefer a self-hosted and self-managed service, wishing to have complete control over it all, then a straightforward way could be to launch graphite with StatsD and docker.
Deployment
It is possible to deploy StatsD in your favorite environment with your preferred architecture and other services/microservices. Just make sure the StatsD server is reachable by all the client-side apps that want to send metrics to the StatsD server - and StatsD won’t complain about it.
Just in: AWS Cloudwatch now also supports StatsD metrics in case you employ AWS Cloud for hosting your infrastructure.
As far as visualization for the metrics we have accumulated is concerned, Grafana is the de facto tool for it. For teams managing complex data pipelines and needing to aggregate metrics across multiple sources, Integrate.io provides a low-code platform for ETL and data transformation that can help consolidate your metric data from various systems into a unified data warehouse for deeper analysis and visualization.
If you're interested in trying it out for yourself, get our MetricFire free trial. You can start monitoring with Grafana dashboards in minutes. You can also sign up for a demo and we can talk about the best monitoring solutions for you.
StatsD API
Python StatsD client also comes with its API and can be triggered through HTTP requests if that’s how you wish to integrate it.
References
About the Authors
Written by Mrinal Wahal. Along with being a writer at Mixster, Mrinal is also a visionary computer scientist in the making who also heads his premier company Oversight. Oversight is primarily targeted toward the enhancement of Research & Innovation.
Edited by Vipul Gupta, a strong generalist, OSS python developer & documentation specialist. Apart from his love for party parrots and being a full-time student, he has been contributing to open-source both online & offline for the past 4 years. He leads several developer communities & works with the outreach team for the non-profit, Sugar Labs.
He runs his own initiative, Mixster which specializes in writing technical content for startups & organizations, just like the amazing folks at MetricFire. Available all over the web as vipulgupta2048 & always looking for opportunities. Let’s connect!