

Table of Contents
Great systems are not just built. They are monitored.
MetricFire runs Graphite and Grafana as a fully managed service for growing engineering teams, taking care of storage, scaling, and version updates so your team doesn't have to. Plans start at $19/month, billed per metric namespace rather than per host, and include engineer-staffed support. Integrations work natively with Heroku, AWS, Azure, and GCP, and data is stored with 3× redundancy in SOC2- and ISO:27001-certified data centres.
Intro
Collectd is a data collection software that allows you to fetch metrics from a machine being monitored locally and push them to Graphite. Everything is done by plugins. The collectd plugins can collect metrics on CPU, memory, Postgres, JVM, and many more metrics. Plugins can also be used to push these metrics to Graphite, aggregate data, send alerts and send notifications to email.
In this article, we'll create a test system with collectd plugins, that will monitor a Linux machine and pushes these metrics to Graphite. In the end, we will make sure that everything works on a Grafana dashboard.
To reduce setup time, use the MetricFire free trial to run Graphite and Grafana. MetricFire offers a hosted Graphite and Grafana service where you can send metrics and visualize them right away.
Key Takeaways
- Collectd is a versatile data collection software that fetches metrics from local machines and pushes them to Graphite using plugins. It monitors CPU, memory, Postgres, JVM, and more.
- Connect Graphite with Grafana for effective metric visualization and analysis using a docker-compose.yml file.
- Install and configure collectd plugins for monitoring CPU, disk, DF, swap memory, and memory.
- While collectd monitoring is powerful, scaling can be challenging. Services like MetricFire offer hosted solutions with pre-installed plugins, making monitoring efficient and cost-effective.
What is Collectd?
Collectd is software designed to collect metrics. It is also a platform that sets up and manages plugins that do all the payload. Collectd should be installed on each machine that hosts the application you need to monitor.
So, what can the plugins do? The most common plugins can monitor CPU, memory, network, and swap usage. There are also many plugins to monitor software such as Nginx, Apache, JVM, Postgres, etc.
But we also have plugins that can aggregate, alert, notify, and push metrics to a database. Collectd is really flexible because you can configure each plugin you want.
Let's check how it works in practice.
How to attach a collectd plugin to Graphite and Grafana
Having a lot of metrics is great, but it's really hard to process them without an appropriate visualization. That is why we need to attach Grafana to our system. Graphite provides its own web interface, which can be enough in some cases, but it is also useful to attach a more advanced dashboarding system.
Let's define a task:
- We will monitor a local system with these plugins:
a) CPU
b) Disk
c) DF
d) Swap Memory
e) Memory - All the data will be sent to Graphite
- We will also have a Grafana instance connected to Graphite
To protect us from tons of useless packages on the local machine, we will install only collectd locally. For all the other services we will use a Docker compose. This will also help us to deploy this system easily.
Setting up Graphite with Grafana
In this section, we will set up Graphite with Grafana, in the next section will describe the collectd installation and plugin configuration.
Let's define a docker-compose.yml file:
version: '3'
services:
 graphite:
  image: "graphiteapp/graphite-statsd"
  ports:
   - 80:80
   - 2003-2004:2003-2004
   - 2023-2024:2023-2024
   - 8080:8080
 grafana:
  image: "grafana/grafana"
  ports:
   - 3000:3000
  network_mode: host
  depends_on:
   - graphite
This configuration describes 2 services: Graphite and Grafana.
Graphite
To install Graphite we will use an image that implements Graphite with StatsD included. But for our purpose in this article, we only make use of Graphite. Also, this image exposes some ports that will be accessible from our container.
Mapped ports:
- 80 - Nginx
- 2003 - carbon receiver (plain text)
- 2004 - carbon receiver (pickle)
- 2023 - carbon aggregator (plain text)
- 2024 - carbon aggregator (pickle)
- 8080 - Graphite internal gunicorn port (without Nginx proxying)
There are also StatsD ports 8125, and 8126 that can be useful for you, but not in the context of this article. We will also skip the advanced configuration of the carbon aggregator and use only the receiver.
If you're interested in StatsD, check out our other article for more information on the differences between collectd and StatsD.
Grafana
Next, we create a Grafana service. First, we need to expose Port 3000 because it is used to access the user interface. Also, Grafana needs to make requests to Graphite and import the data, so we need to make this possible (network_mode: host). Then we specify that this service depends on Graphite.
Connecting collectd with Graphite and Grafana
collectd will collect metrics from a local PC and send them to Graphite on port number 2003. We will add Graphite as a data source to Grafana and visualize how everything works.
Run docker-compose.yml with:
docker-compose up
And restart collectd after configuration with:
sudo service collectd restart
You should wait some time to allow metrics to be collected by collectd and piped into Graphite (it's not interesting to analyze metrics from only a 1 minute time-span).
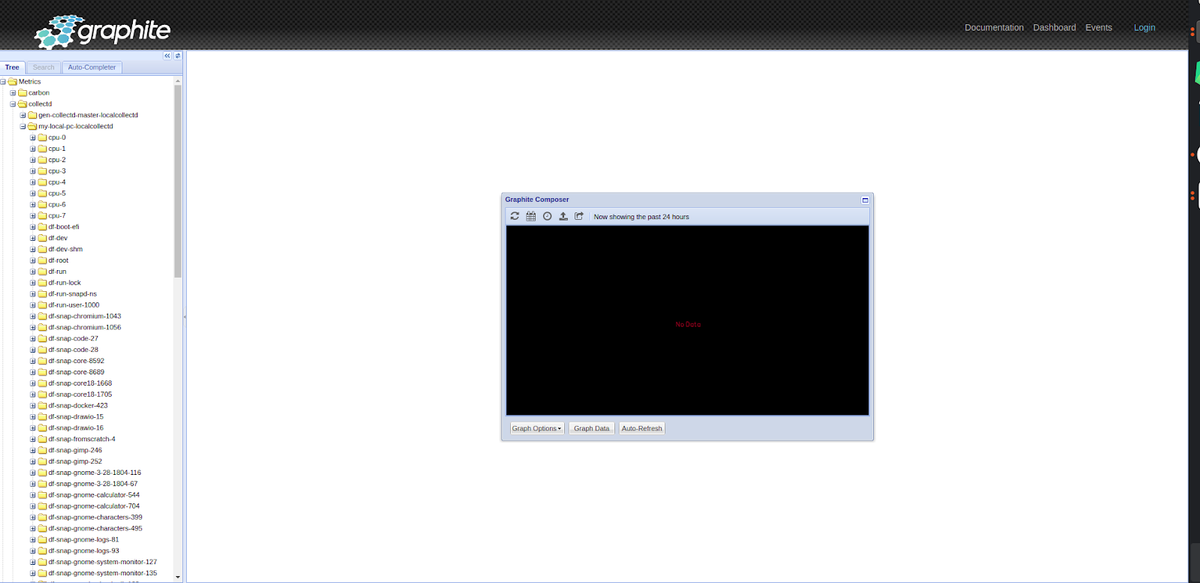
Then check Graphite by going to the address http://localhost/.
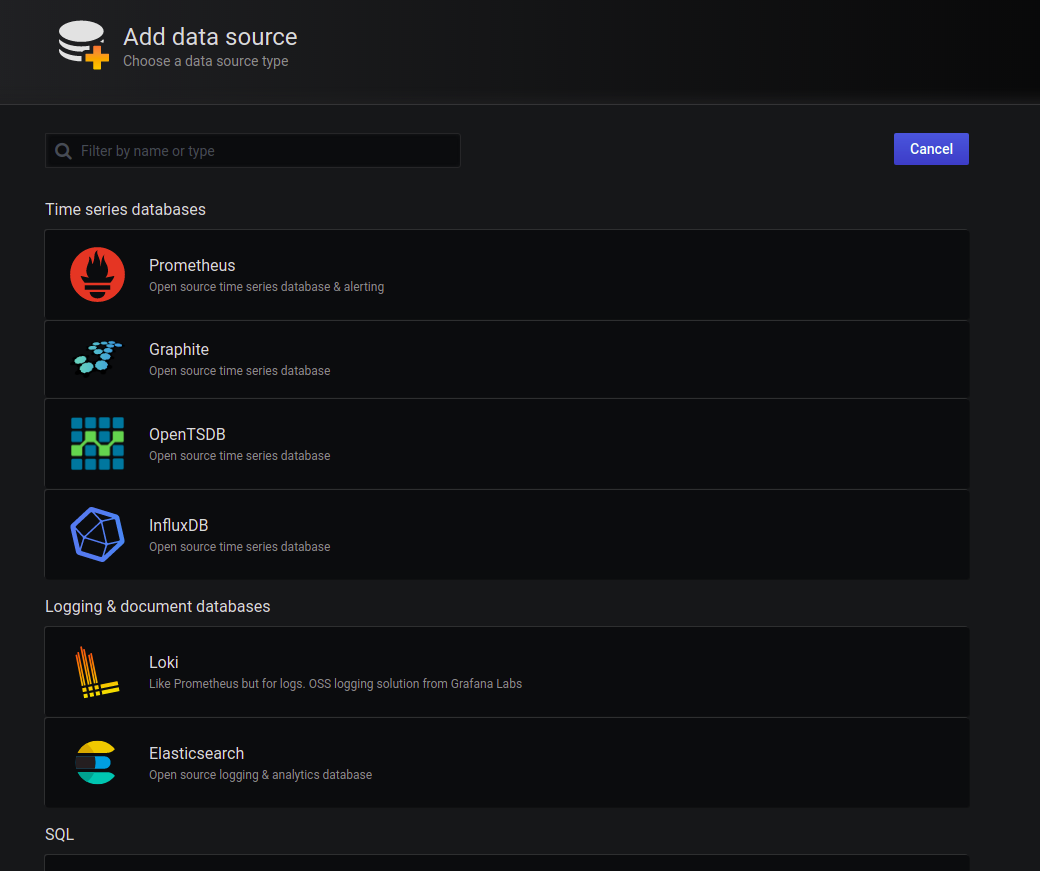
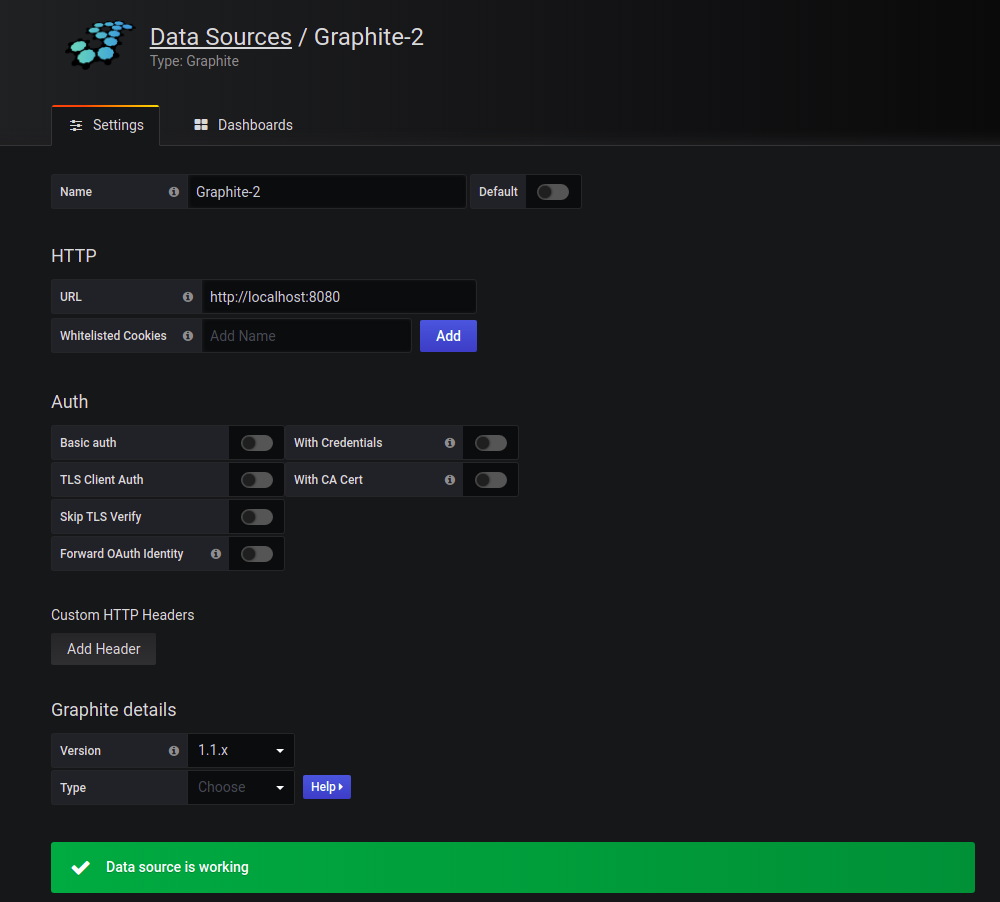
After, go to http://localhost:3000/ to login to Grafana. Then configure the new data source in Grafana. For more information on how to set up Grafana data sources, check out our article here.
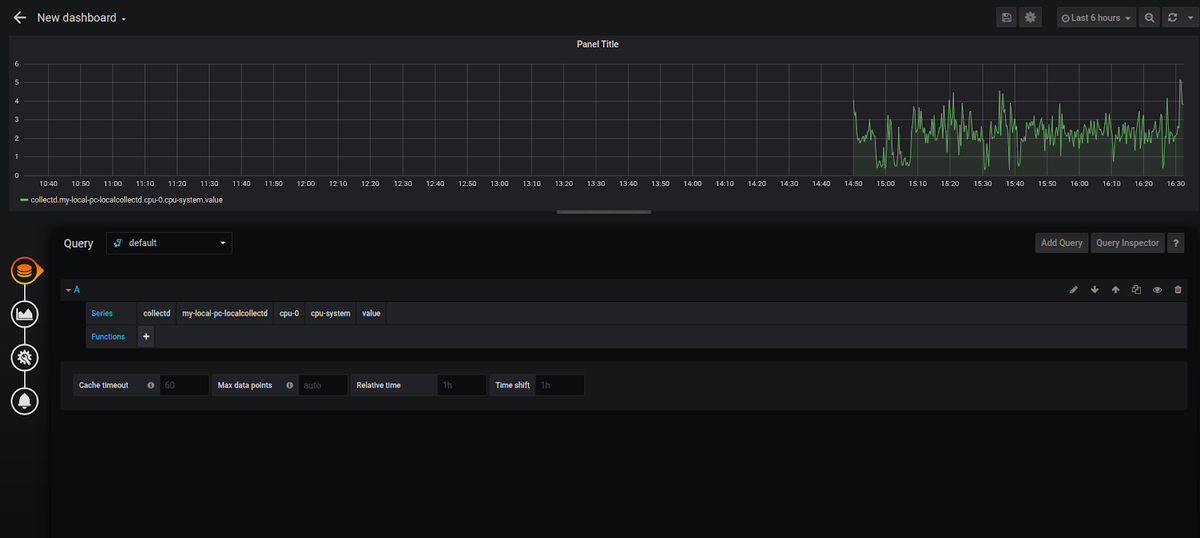
And create your first Dashboard:
Collectd Plugins for monitoring server parameters
Let's install collectd on a local machine with:
sudo apt install collectd
The next step we need to do is to configure the collectd service with the plugins. To do so, let's stop the collectd service:
sudo service collectd stop
Then, open a file with the configurations (it is a good idea to keep a backup of the previous variant):
sudo gedit /etc/collectd/collectd.conf
Here is an example of our file:
Hostname "my-local-pc.local"
FQDNLookup true

LoadPlugin cpu

LoadPlugin disk

LoadPlugin df

LoadPlugin swap

LoadPlugin memory

# LoadPlugin write_prometheus
# <Plugin "write_prometheus">
#  Port "9103"
# </Plugin>

LoadPlugin write_graphite
<Plugin write_graphite>
  <Node "Graphite">  # random name in this case
    Host "127.0.0.1"
    Port "2003"
    Protocol "tcp"
    LogSendErrors true
    Prefix "collectd." # will be used in metrics name
    Postfix "collectd." # will be used in metrics name
    StoreRates true
    AlwaysAppendDS true
    EscapeCharacter "-"
  </Node>
</Plugin>
The first row defines the name of the current host (for now we can choose a random one) and the second row controls how a hostname is chosen. When enabled, the hostname of the node is set to the fully qualified domain name (FQDN). On a real server, the first row can be skipped.
You can also specify their updating interval and much more using this file.
Then we configure the plugins that we want to use with the following syntax:
LoadPlugin <plugin_name>
<Plugin <plugin_name>> # optional for some plugins
# ... configuration
</Plugin>
For this example, we will use plugins without any special configurations. In the code example above, you can also find the plugin in configuration for sending data to the Prometheus instance commented out. The plugin is called write_prometheus, and you can find the line # <LoadPlugin write_prometheus>.
Let's describe these collectd plugins:
CPU
The CPU plugin collects the amount of time spent by the CPU in various states, most notably executing the user code, executing the system code, waiting for IO operations, and being idle.
The CPU plugin does not collect percentages. It collects jiffies, the units of scheduling. But it can be configured as follows:
<Plugin cpu>
    ReportByState = true
    ReportByCpu = true
    ValuesPercentage = true
</Plugin>
The metrics collected are system dependent. This is an example of metrics that would be collected when running on Windows:
- Iddle
- User
- System
- IRQ ( interrupt requests )
Metrics will be collected for each CPU separately. Each core is named with numbers from 0 to N.
Disk
The Disk plugin collects performance statistics of hard disks and partitions.
Example configuration:
<Plugin "disk">
  Disk "sda" # which partition to monitor
  IgnoreSelected false
</Plugin>
This is also a platform-dependent plugin. An example of metrics that would be collected from a Linux environment will contain:
- Merged (number of operations that one disk can perform at once)
- Time (the average time an I/O operation took to complete)
- Pending operations
- IO time (time required for doing IO operations)
- Weighed IO time (the measure of both I/O completion time and the backlog that may be accumulating).
DF
The DF plugin collects the file system usage information (used and free space on mounted partitions). The output is similar to the 'df' Linux command.
You can configure it to monitor only certain partitions, file system types, or mount points. You can also monitor all the data. Here is an example:
<Plugin "df">
  Device "/dev/hda1"
  FSType "ext3"
  IgnoreSelected false
</Plugin>
This metric consists of 2 values (Free and Used) for each mounted partition.
Swap
The Swap plugin shows the amount of swap used.
Example of configuration:
<Plugin swap>
  ReportByDevice false
  ReportBytes true
</Plugin>
There you can find 3 values (Free, Cached, and Used).
Memory
The Memory plugin collects the physical memory usage.
Configuration example:
<Plugin memory>
  ValuesAbsolute true
  ValuesPercentage true
</Plugin>
Under Linux you will find these metrics:
- Used
- Buffered
- Cached
- Free
Conclusion
Collectd is a platform built for managing plugins that perform all the payloads for metric collection. For example, you can use it when monitoring infrastructure or applications like JVM, Nginx, or MongoDB. The system is really flexible and configurable, and each plugin can be configured individually. The variety of collectd plugins means you can always collect, process, and push metrics to a collection system. You can also configure alerting with functions like mail notifications.
Running collectd monitoring requires some knowledge to develop and set up the monitoring architecture, which can become difficult to maintain at the production scale. In addition, some plugins are not documented well. For teams that need to integrate metrics collection with broader data workflows, Integrate.io offers low-code ETL and data pipeline solutions that can help move and transform metrics data alongside your other enterprise data. The best way to avoid costly processes and save money on infrastructure monitoring is to use services like MetricFire, where the plugins are already installed, and there is good documentation. For example, MetricFire has a Hosted Graphite Agent that allows users to skip using collectd or StatsD completely.
You should sign on to the free trial and try out our hosted collectd, Graphite, and Grafana stack. You can also book a demo and talk to us directly about your company's monitoring needs.


