

Table of Contents
Great systems are not just built. They are monitored.
MetricFire runs Graphite and Grafana as a fully managed service for growing engineering teams, taking care of storage, scaling, and version updates so your team doesn't have to. Plans start at $19/month, billed per metric namespace rather than per host, and include engineer-staffed support. Integrations work natively with Heroku, AWS, Azure, and GCP, and data is stored with 3× redundancy in SOC2- and ISO:27001-certified data centres.
Introduction
Keeping your servers online is always important for the health of your business and keeping users happy. Essentially, if you are keeping an eye on your servers, you can proactively fix problems before they blow up rather than fighting them as they arise.
Setting all this up can be a breeze or a bit of a headache, depending on your servers, what metrics you're tracking, and your expertise.
Either way, MetricFire’s got your back! We’ll walk you through how to monitor your servers, both manually and automatically, using MetricFire.
Getting Server Uptime Metrics Using MetricFire
When it comes to monitoring, self-hosting can be difficult. However, the core ideas are the same whether you are self-hosting or using another tool.
If you aren’t sure where to start, sign up for a free trial or contact our team of monitoring experts! We're always happy to discuss the configuration of your servers and help you figure out the perfect monitoring setup.
How to Deploy an Agent into Servers
Typically, deploying an agent is the easiest way to get any metric from your servers. But picking the right agent is key, since the deployment process can vary depending on your servers and what agent you choose.
We're big fans of Telegraf because it's dependable, offers numerous input plug-ins for a wide range of different metrics, and is well-maintained. OpenTelemetry is another good agent with a lot of growing potential. To find the perfect match for your business, check out our Agents Guide. The examples below will give you a rundown on deploying an agent to your servers.
NOTE: You'll need access to your servers to do this. We've seen teams get stuck because a third party manages their servers, so they are unable to install anything.
Pro-Tip: Always test your new agent setup on just one server first, then roll it out to the rest. Saves you a lot of potential headaches.
Manual Deployment
Sometimes, especially if you're working with a smaller setup, just manual deployment to each server can be the way to go. Here's a simple step-by-step example of manual agent deployment:
-
Deploy SSH into your server
-
Download the monitoring agent package
-
Configure the agent with your Hosted Graphite API key
-
Start the service and enable it
Once you have deployed the agent into your servers, configure your agents to forward metrics to your self-hosted Graphite instance or your Hosted Graphite account using supported protocols such as StatsD, TCP, or UDP.
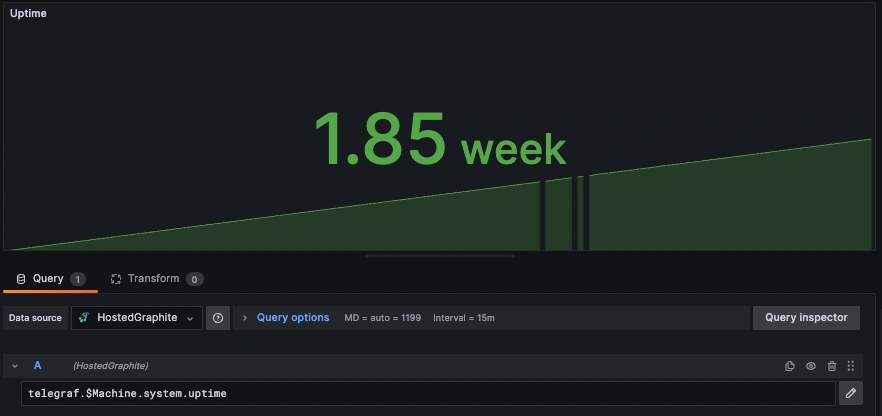
For example, if you're using Telegraf, you'll install it, configure it to Hosted Graphite with the code snippet below, install it on your servers, and turn it on:
[[outputs.graphite]]

    servers = ["carbon.hostedgraphite.com:2003"]

    prefix = "YOUR_API_KEY.telegraf"
After restarting the agent, you should see your metrics in your account, including your uptime, within a couple of minutes. Here is a video tutorial that should help with this process.
Automatic Deployment
Modern tools have changed the game when it comes to deploying monitoring agents across server fleets.
Puppet
Puppet is a configuration management tool similar to Chef or Ansible. It basically allows you to install service modules across your entire fleet of servers. So, deploying your monitoring agents becomes super easy and automatic. Here's a quick peek at what a Puppet module for Telegraf might look like:
class telegraf {

  package { 'telegraf':

    ensure => installed,

  }


  file { '/etc/telegraf/telegraf.conf':

    ensure  => file,

    source  => 'puppet:///modules/telegraf/telegraf.conf',

    notify  => Service['telegraf'],

  }


  service { 'telegraf':

    ensure  => running,

    enable  => true,

    require => Package['telegraf'],

  }

}

include telegraf
Using Your Uptime Metrics
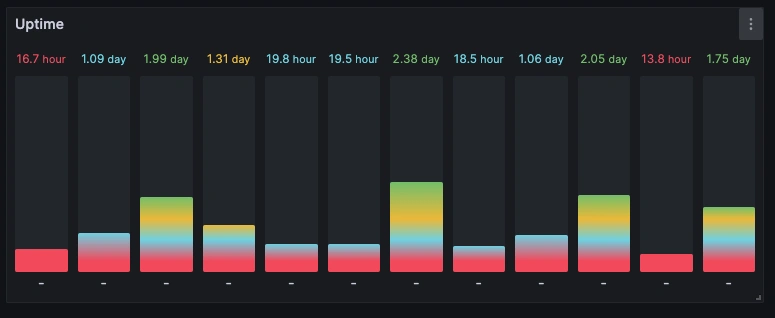
To highlight a specific metric that is vital in any server monitoring endeavour, uptime metrics are some of the most important standard metrics available.
Understanding uptime ensures that your product is consistently reliable. Seeing these metrics means that your customers are happy, and you know when and where an improvement is needed. Essentially, customers won’t even know how good of a job you are doing.
Once your agents are deployed, the next step is to collect your metrics and create custom dashboards that help you visualize the data. If you don’t have a reliable visualization tool, MetricFire offers Hosted Grafana, a reliable, easy-to-use tool for visualizing your Hosted Graphite data. You can also connect other data stores to use Hosted Grafana, or integrate with platforms like DreamFactory to provide governed API access to your monitoring data across enterprise applications!
For more information on building out your dashboards, check out this blog!
Alright, so you've got your agents running, sweet! The next step is to build some dashboards so you can actually see what's going on.
That's where MetricFire's Hosted Graphite comes in. It's a reliable and simple way to pull all your data together and turn it into easy-to-understand graphs and charts, all in a custom Graphite and Grafana setup.
Conclusion
Server monitoring is key to keeping things running smoothly and avoiding dreaded outages. Whether you're setting things up manually or letting automation do the heavy lifting, you'll want a solid monitoring strategy that fits your company's needs.
MetricFire can totally help with this! Monitoring is not a "set it and forget it" solution – it requires ongoing attention and refinement. It needs some love and attention. Start simple, automate where possible, and continuously adjust your monitoring strategy based on your evolving needs. Basically, keep it flexible and keep it up-to-date.

