
Table of Contents
- Introduction
- Key Takeaways
- What is Heroku?
- Why Monitoring Is Critical From Day One
- Keeping Track of Your App with Heroku Monitoring
- Heroku’s Compatibility with Other Technologies
- Use MetricFire’s Hosted Graphite to Monitor your Heroku App
- Why Should You Use Heroku to Host Your App?
- Step 1: Build and Deploy a Simple Flask App to Heroku
- Step 2: Add Real-Time Monitoring with MetricFire’s Hosted Graphite
- Step 3: Visualize in Grafana
- Step 4: Set Up Alerts That Matter
- Production-Ready Monitoring in Under 15 Minutes
- Want to Go Further?
- Conclusion
- Download our Heroku Cheatsheet
Great systems are not just built. They are monitored.
MetricFire runs Graphite and Grafana as a fully managed service for small engineering teams, taking care of storage, scaling, and version updates so your team doesn't have to. Plans start at $19/month, billed per metric namespace rather than per host, and include engineer-staffed support. Integrations work natively with Heroku, AWS, Azure, and GCP, and data is stored with 3× redundancy in SOC2- and ISO:27001-certified data centres.
Introduction
In our world that's always changing, making and launching apps quickly is important. Whether your business is big or small, turning new ideas into working apps is key to success. That's where Heroku comes in.
Heroku makes it remarkably easy to deploy web apps. But deploying is only the beginning. If you're running production workloads on Heroku, observability and monitoring should be built into your workflow from the start and not bolted on later.
This guide walks through not just how to build a Heroku app, but how to monitor it effectively with Hosted Graphite by MetricFire and uses best practices trusted by SaaS teams, startups, and infrastructure engineers.
Key Takeaways
- Heroku is a user-friendly cloud platform that streamlines app development by handling technical details and supporting various programming languages.
- Heroku Monitoring is a toolset for real-time app performance tracking, error detection, and resource monitoring, ensuring your app runs smoothly.
- Heroku is compatible with many programming languages, simplifies app management, and allows easy updates.
- Heroku CLI manages your app while monitoring tools include the Metrics Dashboard, Logs, and Add-ons for extended functionality.
What is Heroku?
Heroku is a handy online service that came out in 2007 and is now part of the Salesforce.com family. Simply put, Heroku is a tool that helps you build applications without worrying about all the technical stuff.
Heroku, a cloud-based platform as a service (PaaS), is more than just a platform, it's your highway from idea to URL. This versatile service supports a broad range of programming languages and offers a robust ecosystem for developers to thrive.
Think of it like this: You're a star performer, and Heroku is your backstage crew, taking care of all the technical parts so you can focus on creating awesome apps.
Why Monitoring Is Critical From Day One
Heroku handles a lot behind the scenes by provisioning dynos, managing build packs, abstracting servers. This is part of why it is such a valuable hosting platform, but you're still responsible for uptime, performance, and cost visibility.
Without real-time monitoring:
- A broken API can go unnoticed until users complain
- Your dyno hits memory limits and restarts unexpectedly
- Background jobs silently fail
- You overspend on unused dynos or hidden workloads
Every production-grade app should have metrics in place to catch these before they become business risks.
Keeping Track of Your App with Heroku Monitoring
One really helpful feature of Heroku is called Heroku Monitoring. This is a set of tools designed to help you monitor the performance of your app and ensure it's working as optimally as possible.
Think of Heroku Monitoring as a safety net for your app. It provides live updates on how your app is being used, its performance, any errors that may occur, and the resources it utilises. It's like having someone always watching over your app, ready to let you know if anything goes wrong.
Heroku's Compatibility with Other Technologies
One of the notable features of Heroku is its compatibility with all major programming languages, including Node.js, Ruby, Python, Java, PHP, and more. This means that, regardless of your app's needs, Heroku can adapt to help. Additionally, with its database service, Heroku Postgres, and numerous other add-ons for monitoring your app's health, Heroku serves as an all-in-one toolkit for app developers.
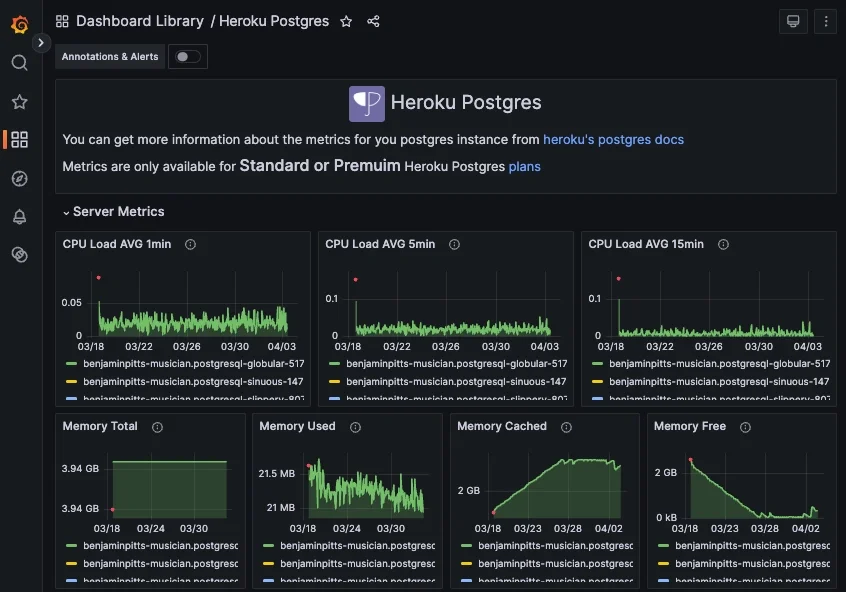
Use MetricFire's Hosted Graphite to Monitor your Heroku App
MetricFire has an innovative solution for monitoring Heroku Dynos, PostgreSQL, Redis, and Kafka add-ons. This provides Heroku users with seamless access to advanced monitoring capabilities, allowing them to closely observe the performance, health, and efficiency. These metrics are collected automatically- through the Heroku app log-drains.
By harnessing MetricFire's powerful monitoring tools, Heroku users can now gain valuable insights into their database operations, optimizing resource allocation, identifying bottlenecks, and ensuring optimal performance. This collaboration between MetricFire and Heroku presents a cutting-edge solution that empowers businesses to maintain a robust and finely-tuned PostgreSQL environment, ultimately leading to smoother operations and improved application experiences. Sign up for a free trial today!
Why Should You Use Heroku to Host Your App?
When you're starting to make apps, Heroku is a big help. Developers worldwide love it because it's easy to use, has many helpful features, and has a supportive community.
One of the best things about Heroku is that it deals with the hard parts of setting up apps. That means developers can spend more time doing what they love - writing code. It can also work with many programming languages and tech, so it's versatile.
Heroku has a lot of useful features too. It makes it easy to adjust your apps, update them, and return to an older version if needed. It also checks your app to make sure it's running well.
Step 1: Build and Deploy a Simple Flask App to Heroku
Let's begin by creating a small example app. Here we'll use Python and Flask, but this works just as well for Node.js, Ruby, Go, or Java apps.
1.1 Create the Flask App
mkdir heroku-monitoring-example && cd heroku-monitoring-example
python3 -m venv venv
source venv/bin/activate
pip install Flask gunicorn
Create app.py:
from flask import Flask
app = Flask(__name__)

@app.route("/")
def hello():
    return "Hello from Heroku!"

if __name__ == "__main__":
    app.run()
Add a requirements.txt:
Flask==2.3.2
gunicorn==20.1.0
Add a Procfile (used by Heroku to know how to run your app):
web: gunicorn app:app1.2 Create the Git Repository
git init
git add .
git commit -m "Initial commit"
1.3 Create and Deploy to Heroku
Make sure you have the Heroku CLI installed. Then:
heroku login
heroku create heroku-monitoring-example
git push heroku main
Once deployed, you'll get a live URL like:
https://heroku-monitoring-example.herokuapp.com/Visit it in your browser and confirm your app is working.
Step 2: Add Real-Time Monitoring with MetricFire's Hosted Graphite
Heroku has basic built-in monitoring, but it's limited. You don't get:
- Custom metrics
- Customizable dashboards
- External alert integrations
- Fine-grained control over what's monitored
MetricFire fills this gap with Hosted Graphite, offering:
- Heroku-native integration
- StatsD / Graphite compatibility
- Hosted Grafana dashboards
- Alerting via Slack, PagerDuty, email, etc.
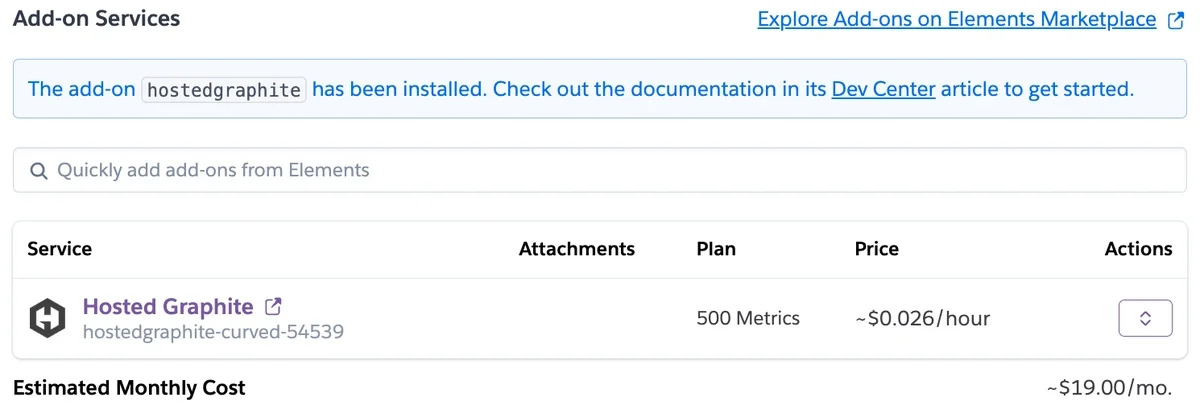
2.1 Add the Hosted Graphite Add-on
From your terminal:
heroku addons:create hostedgraphiteThis sets up a Hosted Graphite account and connects it to your Heroku app. You'll immediately start getting system-level metrics for dyno CPU, memory, and response times.
To verify:
heroku addons:open hostedgraphiteAlternatively, you can just add the Hosted Graphite add-on from within the Heroku UI:
You'll land in the MetricFire dashboard. From here, you can start building charts and exploring metrics like:
- heroku.web.memory_total
- heroku.web.load_avg_1m
- heroku.router.status.200.count
heroku.router.method.GET
2.2 Send Custom StatsD Metrics From Your App
Custom metrics help you track business KPIs or application-specific insights like:
- API call latency
- Signup completions
- Job queue length
- Rate limits hit
To send custom app metrics, you can use a StatsD client. For example, in Python:
pip install statsdIn your app.py file:
import statsd
statsd_client = statsd.StatsClient('carbon.hostedgraphite.com', 2003, prefix='YOUR_API_KEY')

@app.route("/signup")
def signup():
    statsd_client.incr('signup.success')
    return "Signed up!"
Replace YOUR_API_KEY with your Hosted Graphite API key (found in your MetricFire account).
Step 3: Visualize in Grafana
MetricFire includes a fully hosted Grafana instance with automatically created dashboards for all of your Heroku metrics. You can also:
- Build custom dashboards for metrics and events
- Set time ranges (1h, 1d, 7d, 30d, etc.)
- Share charts with your team or embed them in internal tools
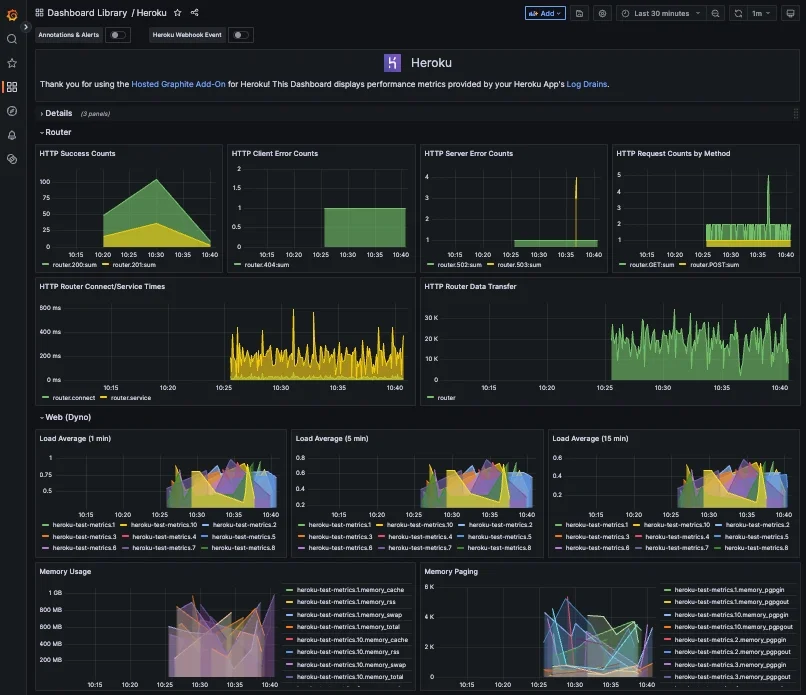
Want to monitor traffic spikes or error rates at a glance? Grafana makes it easy.
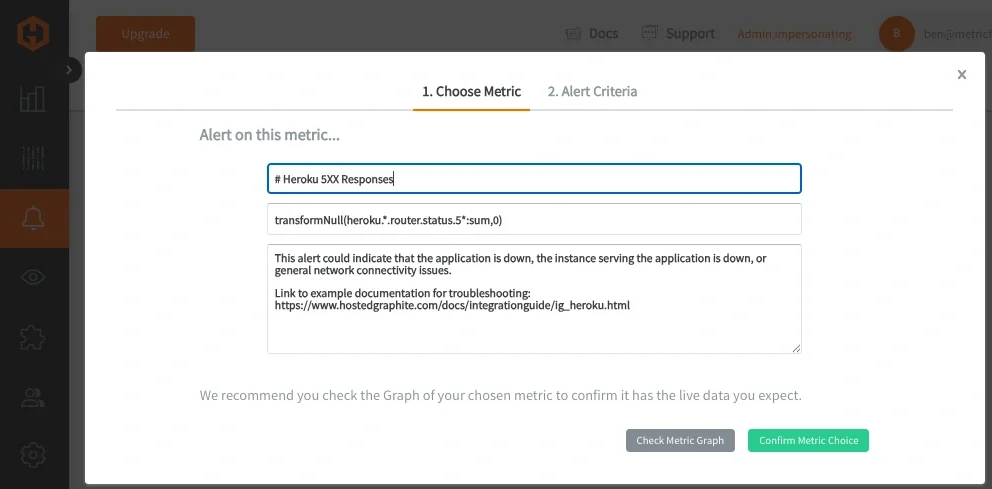
Step 4: Set Up Alerts That Matter
Nobody wants to be surprised by a 2 AM outage. MetricFire lets you configure alert custom rules for any metrics stored in your account, e.g:
- High memory usage on dynos
- Elevated 5xx error rates
- Failed signup flows
- Slow API endpoints
Send alerts to notify your team via Slack, PagerDuty, or email so you can respond fast and confidently.
Production-Ready Monitoring in Under 15 Minutes
By following this setup, you've:
- Deployed a Heroku app
- Added hosted monitoring with Hosted Graphite
- Instrumented your own metrics
- Visualized everything in Grafana
- Set up smart alerts to stay ahead of issues
This monitoring setup works for teams scaling from MVP to enterprise workloads. It's lightweight, Heroku-native, and easy to evolve as your app grows.
Want to Go Further?
- Start a free 14-day trial of MetricFire
- Add Hosted Graphite from the Heroku marketplace
- Explore our HG-CLI tool for server-based metric ingestion
If you're already using Heroku for production, give your app the observability it deserves. Real-time monitoring is one of the best investments you can make in uptime, performance, and peace of mind.
MetricFire helps Heroku teams build faster, monitor smarter, and sleep better.
Let us know if you'd like help setting up custom dashboards or migrating from another platform. We're here to support you every step of the way.
Conclusion
Getting to grips with Heroku and its tools for monitoring your app can make it much easier to develop successful apps. They simplify everything, so you can start building, launching, and managing your app without worrying about the complicated parts of launching and monitoring.
Download our Heroku Cheatsheet
If you want to learn more about Heroku, our Heroku Cheat Sheet is just what you need. It's full of useful tips, commands, and good ways to use Heroku. It's a great help for beginners and experienced developers alike. Get your copy today and take your Heroku skills to the next level!


