
Great systems are not just built. They are monitored.
MetricFire runs Graphite and Grafana as a fully managed service for growing engineering teams, taking care of storage, scaling, and version updates so your team doesn't have to. Plans start at $19/month, billed per metric namespace rather than per host, and include engineer-staffed support. Integrations work natively with Heroku, AWS, Azure, and GCP, and data is stored with 3× redundancy in SOC2- and ISO:27001-certified data centres.
This article was originally published on October 1, 2014, by Trevor Parsons, Ph.D., Chief Scientist & Co-founder of Logentries for the Hosted Graphite blog. Since then, Hosted Graphite has become MetricFire but our goal has stayed the same: Monitoring should be accessible. For more information and for updates on new features, book a time with our team!
As one of the founders of Logentries, over the past few years I have had the chance to meet thousands of our users – at tech talks, meet-ups, trade shows, or where ever takes your fancy. As a product-focused company, we believe it’s important to spend a lot of time out in the community listening to what people have to say, which tools they are using, what technologies they are running on, and, most importantly, what problems they are facing when trying to understand their systems.
One consistent murmur (or maybe more of a chant…) we continue to hear is “Graphite, graphite, graphite…”
For anyone who doesn’t know, Graphite is a widely used, near-real-time metrics-gathering system. It is written in Python and allows for metrics to be captured from multiple systems, providing the ability to take a high-level aggregated view of your data or to drive down to a single source of data.
Although typically used to capture information like CPU or memory use, Graphite is completely agnostic about the nature of the data being stored in it and we consistently talk to people who also use it for application performance metrics, and in some cases business-related data.
In fact, a very common use case for graphite is to consume metrics extracted from your log data. For example, Logstash can parse metrics out of log files and send them to Graphite where they can be stored and visualized. For teams looking to build more sophisticated data pipelines, Integrate.io provides a low-code platform for ETL and data transformation that can help connect metrics across your entire data infrastructure without heavy engineering overhead.
As a big believer in allowing people to concentrate on what they do best – which is usually developing and managing their systems, rather than building their own logging framework or monitoring infrastructure – I was excited when I first came across Hosted Graphite.
I like to think that Logentries and Hosted Graphite are Kindred Spirits. Like Logentries, Hosted graphite is all about taking the pain away from you having to roll your own monitoring solution, by providing a hosted version of Graphite. While this can be tempting when dealing with small amounts of metrics or logs, as your volumes grow, rolling your own solution becomes time-consuming and costly. My advice is generally ‘get off the complexity elevator before it's too late… do you really want to be one of those people saying, “We’d love to use a SaaS service for this, but we have simply invested too much time and resources in our own solutions…”
To make this an even easier decision, Logentries, and Hosted Graphite now allow you to easily grab interesting metrics from your logs and visualize them in your hosted graphite account through our new integration.
How does this work, you ask?
It’s dead simple. Logentries allows you to extract key metrics from your logs, for example, response time, http status codes, website form submissions, transaction values, or whichever metrics exist in your logs that you deem important.
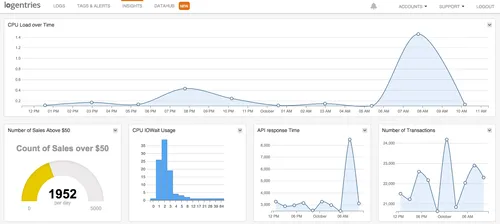
Once you identify these in your logs, Logentries can automatically extract them and roll them up into metrics dashboards, providing you with: ‘Average response time over the past day’; ‘A breakdown of http status codes’; ‘The total number of sign-ups per day’; and ‘The total number of daily transactions as part of your Logentries dashboard.

Example Logentries Dashboard
The Logentries and Hosted Graphite integration allows you to take any metrics that Logentries extracts from your logs and then visualize these in your Hosted Graphite account.

Export Your Log Metrics to Hosted Graphite
The advantage here is that you are likely sending a bunch of other valuable data into Hosted Graphite that may never make it to your logs, so it gives you a single point of correlation across all your data sources.

Logentries Metrics in Hosted Graphite
Enjoy and as always let us know at Logentries and MetricFire what you think!