
Table of Contents
Great systems are not just built. They are monitored.
MetricFire runs Graphite and Grafana as a fully managed service for growing engineering teams, taking care of storage, scaling, and version updates so your team doesn't have to. Plans start at $19/month, billed per metric namespace rather than per host, and include engineer-staffed support. Integrations work natively with Heroku, AWS, Azure, and GCP, and data is stored with 3× redundancy in SOC2- and ISO:27001-certified data centres.
Introduction
Are you trying to choose between Grafana and Splunk, but can't find enough information about their capabilities?
In this blog, we highlight the details of why a user should select Grafana OR Splunk as part of their monitoring stack and what are the user benefits of each. Also, you can check out what it's like to make your own Grafana dashboard using our MetricFire free trial. Get onto the product in minutes and see if you prefer Grafana over Splunk.
Key Takeaways
- Grafana is an open-source visualization and analytics tool that excels in representing time-series data, making it an excellent choice for monitoring and visualizing numeric data points over time.
- Splunk, on the other hand, is a versatile solution primarily used as a log aggregator that can ingest and analyze data from various sources. It offers powerful search and query capabilities, making it suitable for handling large volumes of data and logs.
- The choice between Grafana and Splunk should be based on the specific needs of your organization. Grafana is ideal for data visualization, while Splunk is more suitable for searching and querying data in extensive log volumes.
What is Grafana?
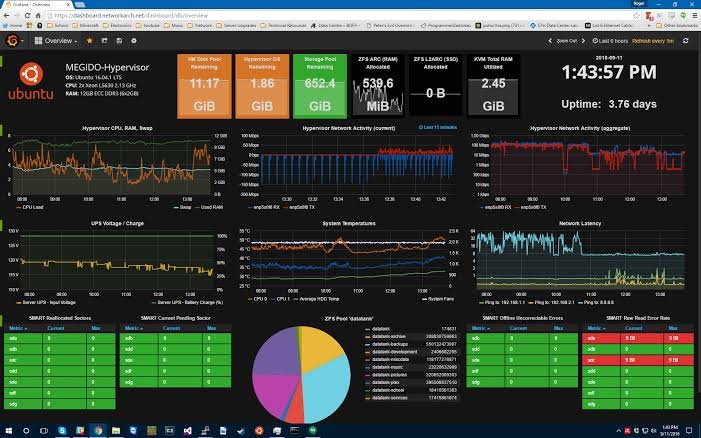
Grafana is an open-source visualization and analytics tool that lets you query, graph, and alert on your time-series metrics no matter where they are stored. This data is then represented visually in the form of panels that can be grouped to form a dashboard.
Grafana - has a very lightweight backend with minimal infrastructure and the support of over 30+ open-source and commercial data sources. It serves as the first choice of DevOps and Monitoring Engineers from across the globe who want to represent their data with minimal boundaries. Grafana can seamlessly integrate with your workflow to help explore metrics, visualize data, explore logs, evaluate data points, and notify using different channels - and it can do it all in real time. It’s an all-in-one visualization and analytics solution. If you're working with diverse data sources across your infrastructure, tools like Integrate.io can help you consolidate and transform data from databases, APIs, and warehouses into formats that Grafana can easily visualize.
Grafana uses numerous panels and charts to represent your data in the form of graphs, singlestat, pie charts, progress bars, picture graphs, and more. All of these panels come with plenty of custom settings providing users with a broad range of options to choose from, and then users can save it to a dashboard. There are various ways of creating dashboards and if insightful bring-to-life dashboards interest you, check out our article on Grafana Dashboards from Beginning to Advanced. Or, find out more with our Grafana Tutorials for beginners. Also, get a free trial with Hosted Graphite, and check out what Grafana Dashboards are like!
MetricFire is a hosted Grafana service, with a complete infrastructure and application monitoring platform that helps customers collect, store, and visualize series data from any source. Check out our free trial or book a demo and talk to us directly about your monitoring needs.
What is Splunk?
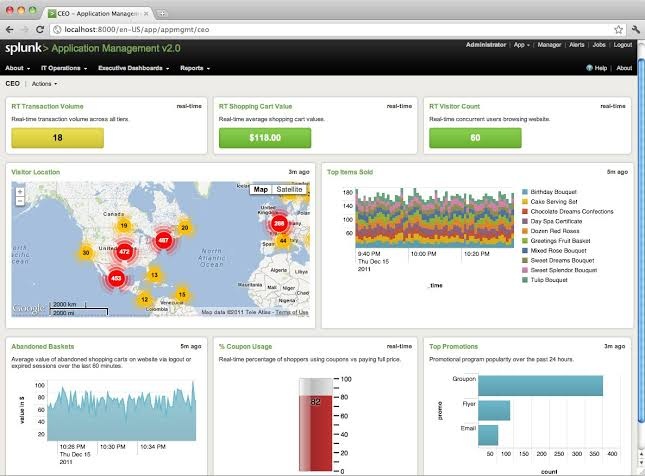
Splunk is a Software product that helps you to search, analyze, visualize, report, and alert on the machine data it collects from any system or component. It is primarily used as a log aggregator letting users search insightful data from huge volumes of indexed logs.
Splunk Enterprise Solution is capable of ingesting data from almost anywhere such as sensors, devices, applications, and websites. This data can then be filtered and ingested by indexers which in turn convert it to individual events, ready to be queried and filtered. The product can be hosted and supported in-house or could be subscribed to over the cloud. Splunk is increasingly focusing on machine learning and Artificial Intelligence, providing users with features like predictive analytics, outlier detection, and forecasting time series, which helps them detect pattern deviations and notify issues even before they occur.
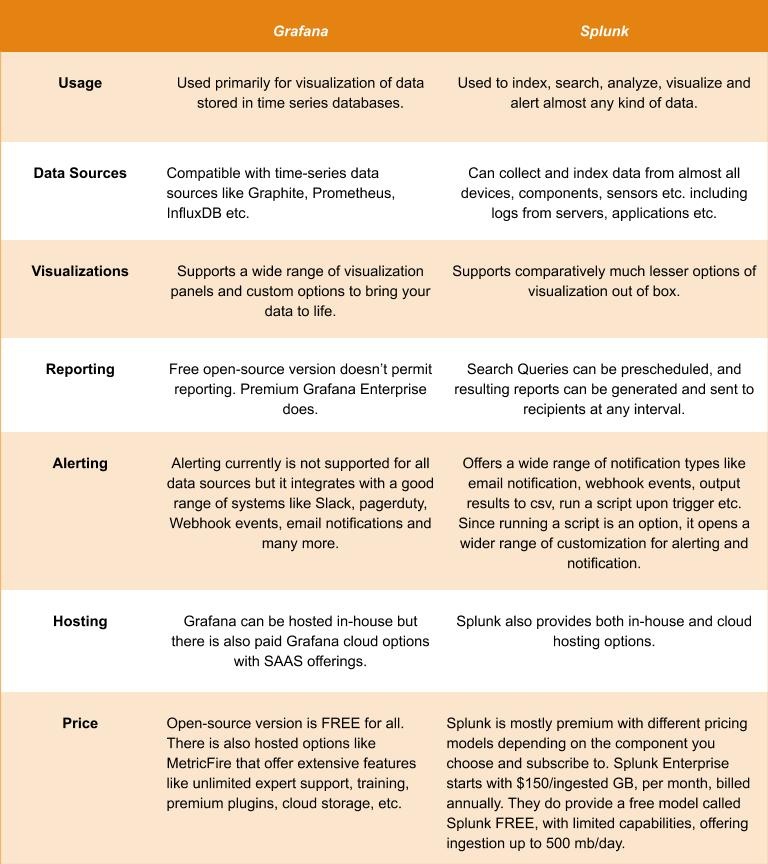
What's the difference?
When to choose what?
If you are still confused about what to select – Let’s get this straight.
Make Grafana your partner if you have data expressed as numbers over time. Grafana is best used to represent time-series data (i.e. numeric data points sequenced over intervals of time) and it can generate colorful visualizations out of them. These data can be represented in real time over various types of panels and dashboards letting the users monitor different KPIs effortlessly. Grafana is also open-source, free, and easy to manage/set up. With newer containerized technologies like docker, pre-saved images and configs could be set up in a couple of minutes with only a few commands.
Grafana is your tool if you need a product only for data visualization without spending a fortune on it. You can easily integrate it with simple and low-maintenance time-series databases like Graphite. Now, if Grafana is the right choice for you and installation and setups are just not your thing, check out Hosted Graphite. It’s a cloud-hosted offering that takes care of monitoring, graphing, and alerting at any scale. Read more on monitoring with Graphite here.
Splunk is your product if you need a more versatile solution that can ingest any kind of data or logs and give you the capabilities to query and search through the data quickly. Splunk is mostly used as a log-aggregator that continuously takes in logs or any kind of streamed data, then indexes and stores this data in indexers, and gives you the capability of searching and filtering using search heads. Splunk’s power lies in indexing data that could be in any form and could come from anywhere irrespective of whether they are formatted or not. Splunk makes it searchable for you.
However, with great power comes great maintenance and cost. Splunk is a premium licensed product and setup for an Enterprise ingesting large volumes of logs would take a good amount of expertise, effort, and strategies to make it work and be successful. Also, Splunk Enterprise solution prices customers based on the amount of data indexed, so you might want to restrict indexing to important data only, as it increases your resource cost for maintenance.
If you are a large enterprise and are susceptible to multiple daily issues with systems, infrastructure, applications, etc. that directly impact your revenue, Splunk might sound like a great investment and could help your support teams troubleshoot issues faster. With the support of Artificial Intelligence and machine learning, issues could be detected even before they occur, saving downtime and revenue loss. So, choose Splunk only if you need its power and abilities of it. As the saying goes - “Don’t buy a Ferrari just to put it in your garage”.
MetricFire offers hosted services for Graphite and Grafana. If you jump onto our MetricFire free trial, you see first-hand how we work with Grafana! Also, you can always book a demo and talk to us directly about your monitoring needs.
Summary and Conclusion
To conclude, Graana and Splunk are two different tools serving completely different purposes. Grafana would be great to visualize KPIs whereas Splunk would be great to search and query data among large volumes of logs. Grafana will display your data in live colorful dashboards with superb visuals, making your dev-ops and NOC teams happier - whereas Splunk could effectively bring down your troubleshooting time and your support engineers would be delighted to quickly detect an issue, not having to meddle through a million lines of server log. So, choose wisely for the purpose you need it. If you think Grafana is the right product for you, sign up for a demo with MetricFire or try a free trial, and learn more.