
Table of Contents
Great systems are not just built. They are monitored.
MetricFire runs Graphite and Grafana as a fully managed service for growing engineering teams, taking care of storage, scaling, and version updates so your team doesn't have to. Plans start at $19/month, billed per metric namespace rather than per host, and include engineer-staffed support. Integrations work natively with Heroku, AWS, Azure, and GCP, and data is stored with 3× redundancy in SOC2- and ISO:27001-certified data centres.
What is Grafana?
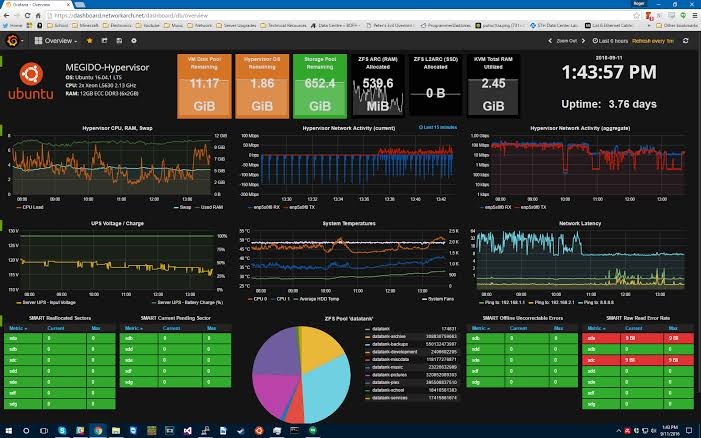
Grafana is a visualization tool that allows you to see and analyze all of your metrics in one unified dashboard. Grafana can pull metrics from any source, display that data, and then enable you to annotate and understand the data directly in the dashboard. Grafana dashboards are designed to allow you to visualize information in a ton of ways, from histograms and heatmaps to world maps. Grafana also has an alerting feature that can communicate with you through Slack, PagerDuty, and more. Dashboards can be shared, downloaded, or expanded with hundreds of plugins that make analysis easier. Grafana is open source, and Grafana as a Service is available through MetricFire.
Get on our free trial and start to make Grafana dashboards in minutes. You can see if Grafana is the right fit for you. If you have any questions you can book a demo and talk to us directly.
What is Zabbix?
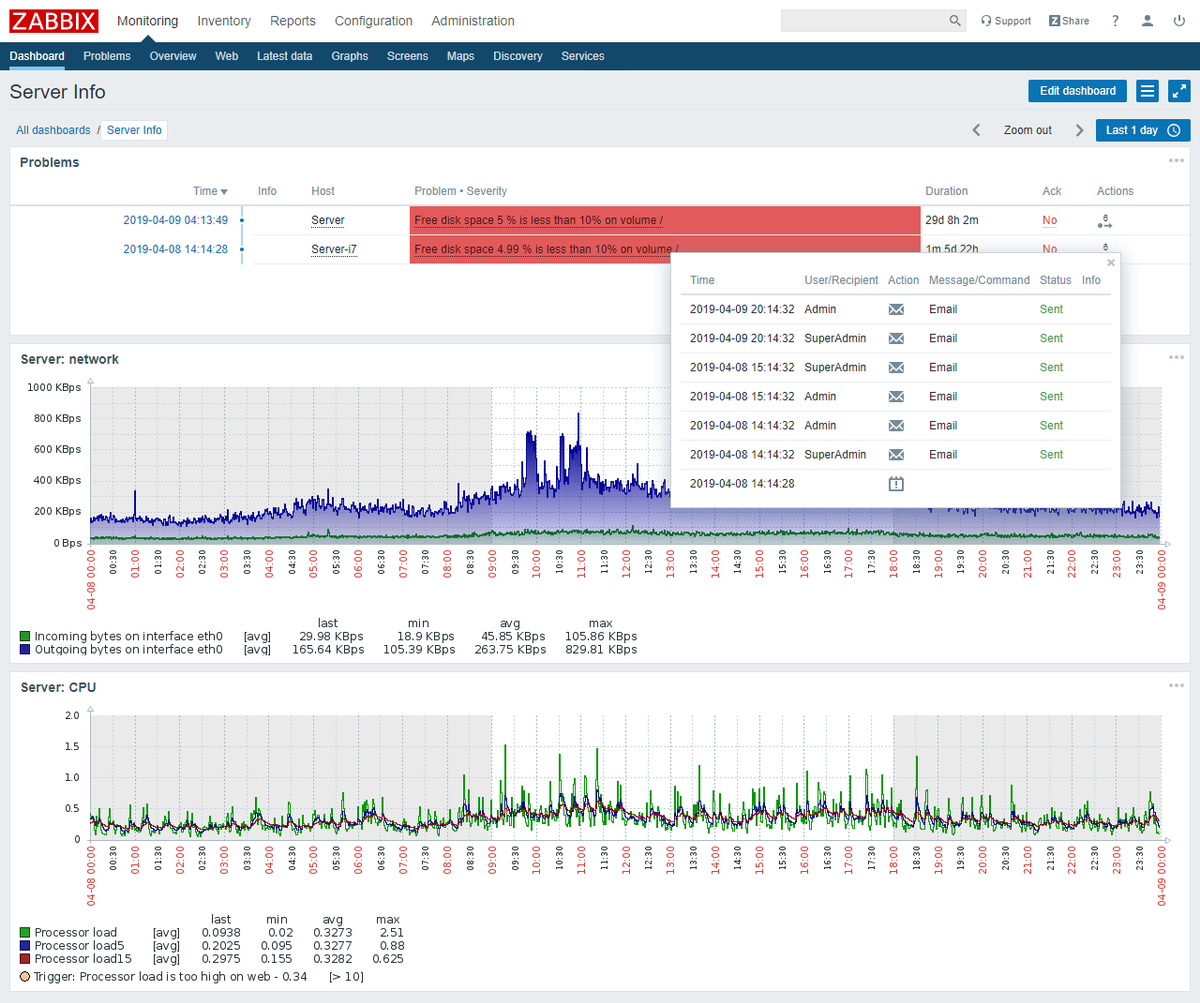
Zabbix is an open-source monitoring tool for IT systems such as networks, servers, virtual machines, and cloud services. Zabbix can collect metrics, detect problems, visualize, notify, and send notifications. There is also functionality for app monitoring. Zabbix is designed for small-scale environments, from anywhere from a few devices to a thousand. Zabbix also allows for easy distributed monitoring, where you can keep the connection and open port count low. Some large-scale installations have been made, but they require a lot of optimization. Zabbix doesn’t store data itself, but it can use a broad range of databases. For organizations managing multiple data sources and needing seamless integration across databases and systems, Integrate.io provides ETL and ELT solutions that can complement monitoring stacks by handling complex data pipelines across your infrastructure. Zabbix’s backend is written in C and the web frontend is in PHP. Zabbix as a Service is available through the Zabbix website, and there are 5 stages of pricing.
When to use Grafana?
Use Grafana when you …
- need beautiful, simple, annotated graphs.
- have multiple sources of metrics or logs and need to see them in one place.
- need to share your dashboards across the organization.
- need to reorganize information based on specific team needs.
- need an easy-to-use query builder.
- need alerting for events.
When to use Zabbix?
Use Zabbix when you …
- need an open source software with a C backend, and PHP front end.
- you want to use MySQL, MariaDB, PostgreSQL, SQLite, Oracle, or IBM DB2 to store data.
- you have a small-scale business, with less than 1000 devices.
- need monitoring, but not necessarily great visualization/support documentation.
Pricing comparison
- Grafana is open source, and free.
- Business-ready Grafana as a Service by Metricfire, including hosted graphite, starts at 16 USD a month.
- Zabbix is open-source and free.
- Zabbix Enterprise is available through Zabbix.
Key takeaways
- Grafana can integrate with a huge range of collectors, agents, and storage engines.
- Grafana is open-source and free.
- Zabbix is open-source and free.
- Zabbix is meant for monitoring, and not for visualization.
Get to know our Grafana as a Service better, and check out how Metricfire can fit into your monitoring environment! Get a free trial and start making Grafana dashboards right away. Feel free to book a demo if you have questions about what Grafana can do for you.


