


Table of Contents
Great systems are not just built. They are monitored.
MetricFire runs Graphite and Grafana as a fully managed service for growing engineering teams, taking care of storage, scaling, and version updates so your team doesn't have to. Plans start at $19/month, billed per metric namespace rather than per host, and include engineer-staffed support. Integrations work natively with Heroku, AWS, Azure, and GCP, and data is stored with 3× redundancy in SOC2- and ISO:27001-certified data centres.
Introduction
Monitoring IT resources is part of the daily activities in large and medium-sized companies, but smaller companies also benefit from the advantages of monitoring systems, memory capacity, availability, and performance. The aim of such proactivity is to ensure smooth processes - for example, IT administrators need to know days in advance that disk space is becoming too low, so they can do something about it.
There are hundreds of monitoring tools, but Graphite and Grafana are the most popular open-source monitoring tools. Fusing these tools into one solution, such as MetricFire, makes for an unstoppable monitoring platform.
The traditional monitoring tools focus on the usage of infrastructure resources such as memory and CPU, but just doing that isn't enough anymore. The need of the hour is to have a broader view of your application, servers, and platform based on metrics and wider observability. This is where MetricFire comes into play.
Grafana and Graphite are some excellent open-source tools that serve the purpose of metric collection and visualization but if you have to set up the stack by yourself then it is going to be an exhaustive task. Not to mention the underlying infrastructure cost and maintenance.
MetricFire
MetricFire hosts and maintains these open source tools for you, making it easy to visualize your metrics from an eye-pleasing Grafana interface. The need for a monitoring platform that can integrate a wide variety of monitoring-related tools has never been greater. These days, there are a lot of emerging popular infrastructure technologies like Docker, Kubernetes, and others. They are all extensible and integrate official and third-party tools, increasing both the number of features and the monitoring load. MetricFire is capable of pulling metrics from your systems into one single pane of glass.
The need for a unanimous platform such as MetricFire, to simplify the monitoring of data collection and visualization becomes critical. In addition to that, MetricFire is agnostic when it comes to the underlying technologies and platforms you monitor. For enterprises managing complex data pipelines and integrations across multiple systems, solutions like Integrate.io provide complementary capabilities for ETL and data transformation, allowing you to connect your monitoring data with operational workflows across databases, APIs, and data warehouses.
If you don’t yet have an account, you can sign up for free and unlock all the features for free for 14 days. MetricFire support personnel is happy to help find your way around.
How to send metrics to MetricFire
In this tutorial, we're going to understand how to send metrics to MetricFire.
There are two main components we need. The first one is responsible for collecting the metrics and the second one is responsible for transmitting those metrics to MetricFire for visualization and analysis. To feed MetricFire with data, there are two approaches.
- The Hosted Graphite Agent
- Telegraf, CollectD, and StatsD
Once we have reviewed the above two approaches, we will discuss how we can set up an instance for metric collection, and at the end of the tutorial, we will study the techniques to secure the process for sending out these metrics to MetricFire.
Using the Hosted Graphite Agent to send metrics
When using Hosted Graphite, there are three ways you can feed metrics to the MetricFire platform.
- Using our agent
- Using code
- The agent + the Hosted Graphite add-on
Using our agent
For the first method, we are going to use the terminal. You need to execute a cURL command on your server and it will automatically set up the required components. The command will also start sending the data to your MetricFire instance. Please note that this command contains the API key which is different for every MetricFire account.
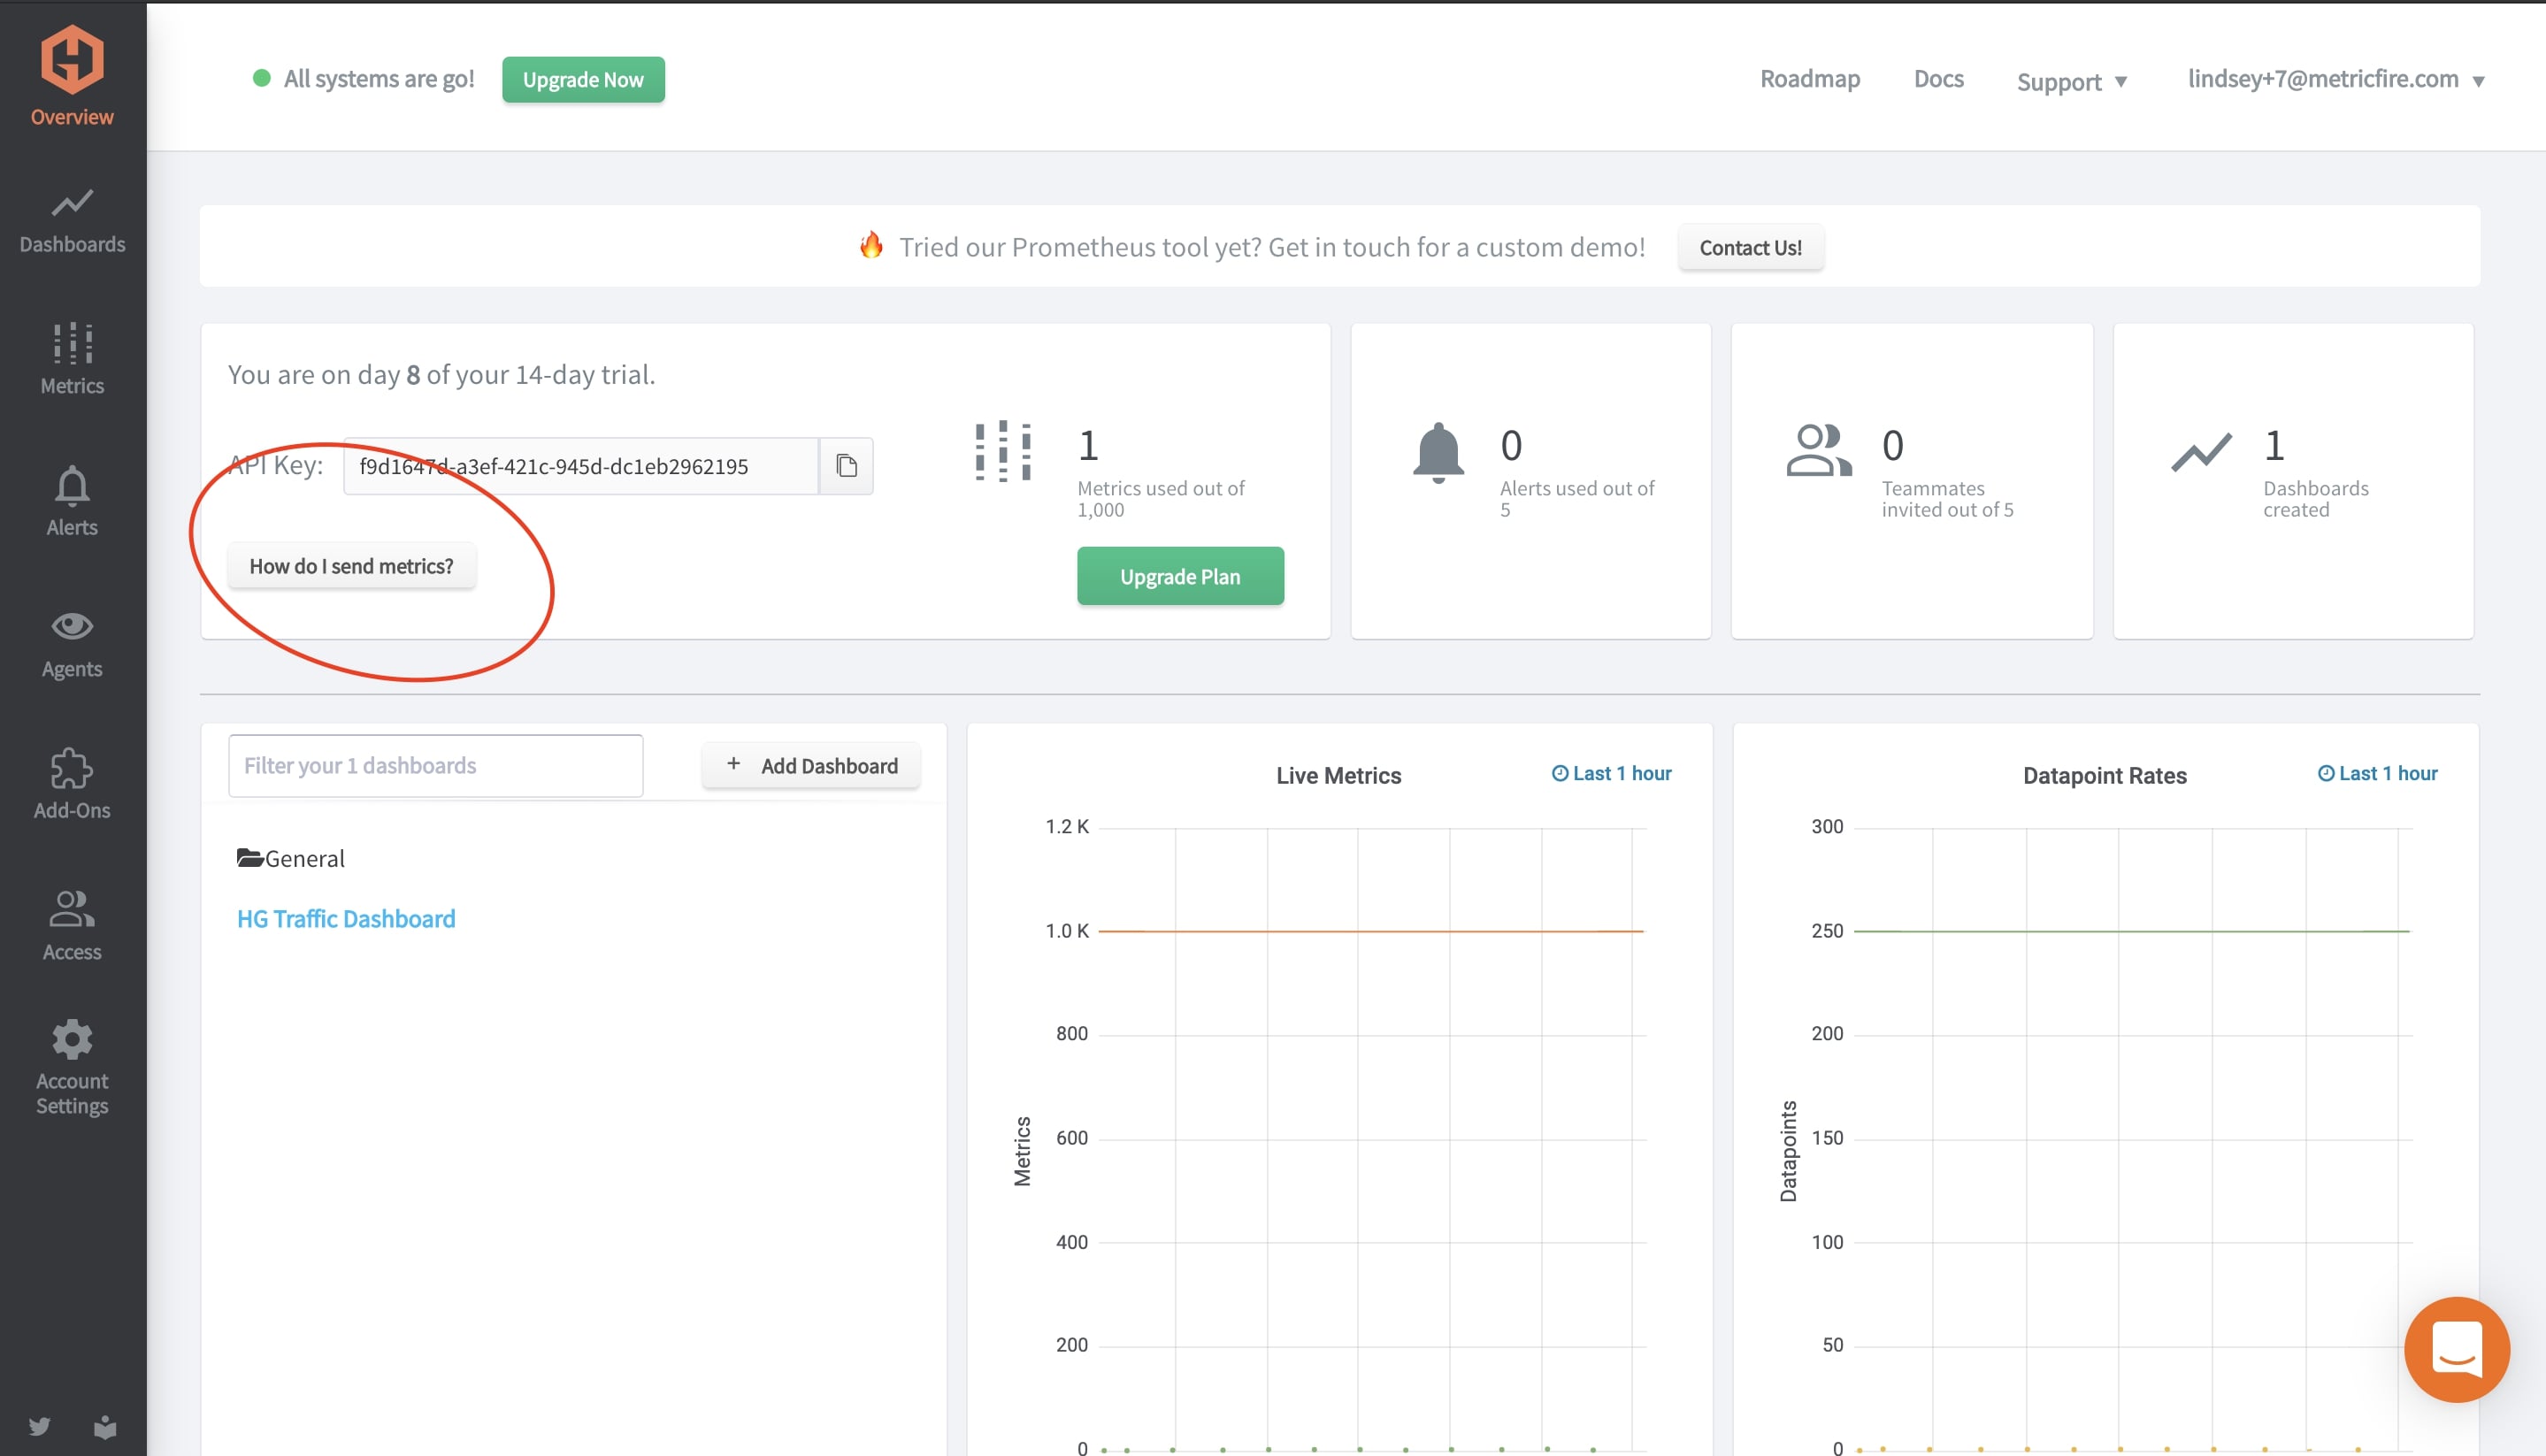
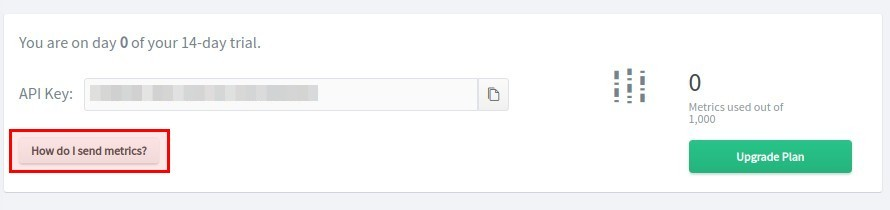
You can obtain your API key by logging into your dashboard and clicking on the “How do I send metrics” button. Copy the installation command and execute it on your server to get it hooked with your MetricFire dashboard.
This is an example of when you use a Debian-based system:
curl -s https://XXXXXXXXXXXXXXXX@www.hostedgraphite.com/agent/installer/deb/ | sudo sh
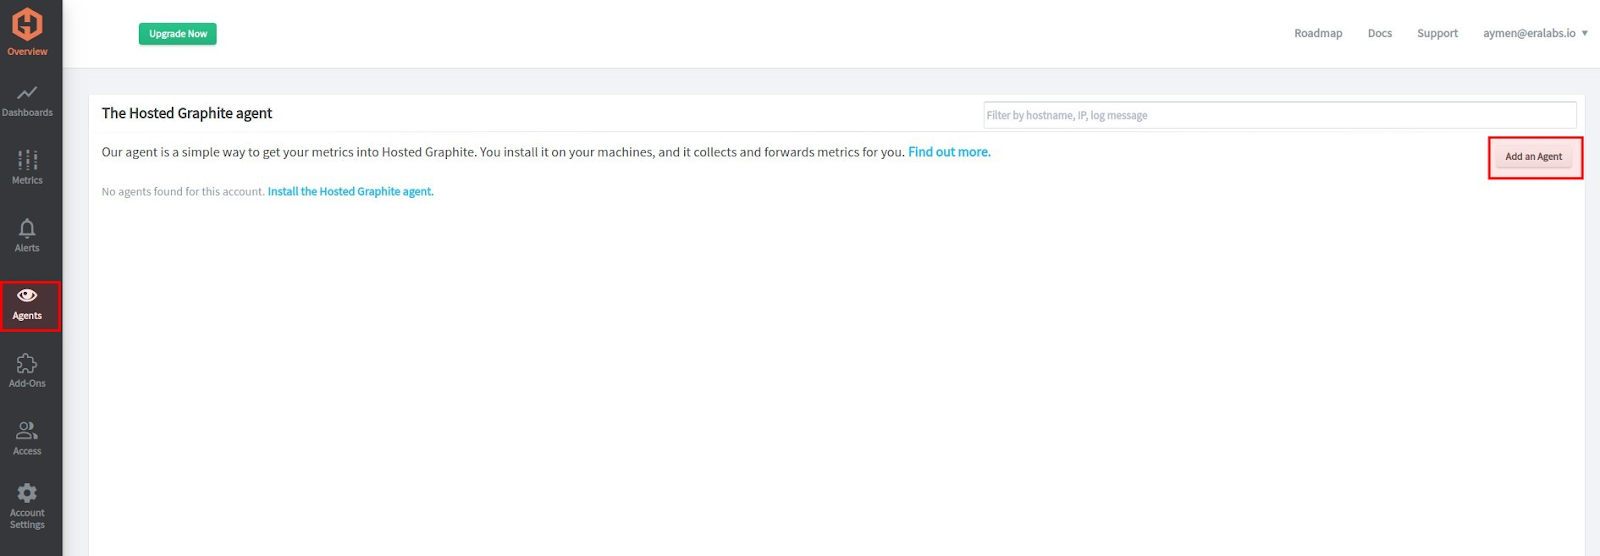
Note that you can also get the same command by clicking on “Agents” and proceeding by adding a new agent as described in the following screenshot.
Metrics from your code
Similarly, you can click on the code’s option inside the MetricFire dashboard and it will give you ready-to-use snippets for different programming languages (Python, Java, Bash, etc.).
Once you have source code available, you can easily utilize it in your application and start sending metrics to MetricFire.
The agent + the Hosted-Graphite add-on
The third option is the most interesting and probably the easiest of all. In this option, you use the Hosted Graphite add-on and the agent in combination so that the agent will automatically populate some default Grafana dashboards with your data.
Generally, you can use add-ons to allow you to get in data from 3rd party services at the click of a button. Some also generate a set of sample dashboards so you can see the information you need on detailed dashboards in a matter of minutes.
The add-on provides a dashboard for the base system metrics exported by the Graphite agent. In your MetricFire dashboard, head to the Add-on section and click on the “Hosted Graphite Agent (Base)” option to enable this add-on. Click on the “Regenerate Dashboard” button to get Grafana configured with this add-on. You might see the following message when you try to regenerate the Grafana dashboard.
This will create/overwrite a dashboard in Grafana called Hosted Graphite Agent (Base). Are you sure?
Give your blessings to the above message and you should be all set. It will tell you the command to install the agent on the system(s) from where you want to send out metrics. Once you execute the provided command, your system(s) will start sending out data to MetricFire. In case you want to see what exactly it configured on your system/server, check the status of the following service.
sudo systemctl status hg-agent
As long as the hg-agent is running on your server, it will feed your MetricFire dashboard with data.
Let’s move on to the second section of this tutorial.
Using StatsD or collectd to send metrics
Collectd and StatsD are two well-known tools used to send out metrics data. They are similar in nature but they vary in the type of data they send out. Collectd is used to collect and transmit system-related metrics (CPU, memory, disk, etc) and StatsD is used to transmit application-related statistics.
They both run using a daemon process. They keep running in the background and take care of the job of collecting metrics and sending them to your MetricFire dashboard. StatsD is written in Node.js, while collectd is developed using C language, but their integration process with MetricFire is pretty much the same.
Sending out the metrics to the external system requires following a particular format. StatsD is rich enough to have a large number of metric types. The most popular metric types for StatsD are gauges, counters, timers, histograms, meters, and sets. This comes into play after you've set up your connection to MetricFire, you can read more about it here.
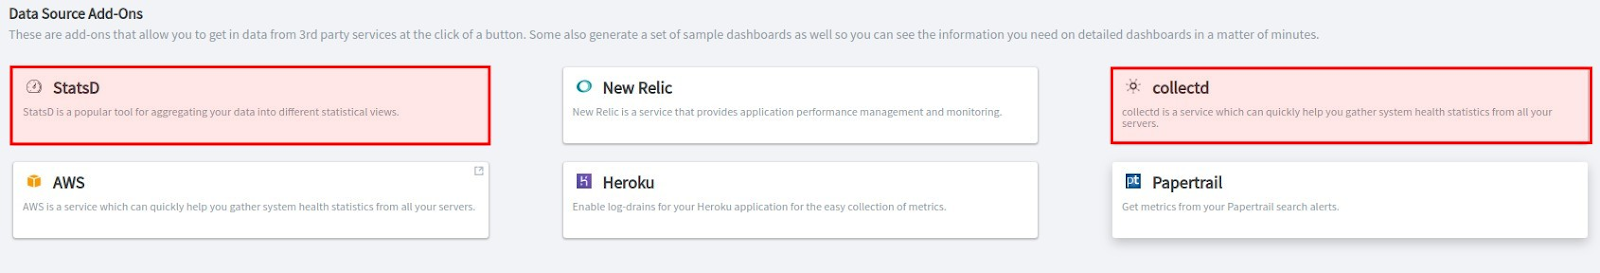
Integrating both is pretty simple. Login to your MetricFire account, go to the add-on section and you will see the add-ons available for both StatsD and collectd under the “Data Source Add-on” section.
Once you enable the add-ons, you will get important usage notices. Keep this information for when we configure our systems to use StatsD.
Example:
StatsD is enabled for your account
- Send StatsD-formatted data to statsd.hostedgraphite.com:8125
- Prefix any data with your Hosted Graphite API Key (XXXXXXXXXXXXXXXXXX).
- Most clients accept a 'prefix' or 'namespace' option to allow you to include your API key.
Once your StatsD is enabled, you can start planning which metrics to collect and send. You will be able to set up a Grafana dashboard using this information by following this tutorial.
Securing the data transmission to MetricFire
Let’s see how we can secure the process of data transmission to MetricFire.
Hosted Graphite agent
By far, the easiest way to securely send your metrics is using the Hosted Graphite agent. Once installed, it will automatically forward to Hosted Graphite over HTTPS.
If you are already using other methods like plaintext TCP or UDP carbon-format interfaces, you can keep sending your metric data in the same format via TCP over TLS, and HTTPS. In the following paragraphs, we are going to see some examples.
Sending data securely using HTTPS
For this purpose, let’s use the cURL command and provide the MetricFire HTTPS endpoint:
curl https://<API_KEY>@www.hostedgraphite.com/api/v1/sink --data-binary "metrics.tar"(You need to replace <API_KEY> with your API key.)
As you may notice, the process is the same simple one we have seen in the first parts of this tutorial. You will just need to replace HTTP with HTTPS.
HTTPS alternative: TCP over TLS
HTTPS communication has some overhead involved and TCP over TLS is the next level of security. If you choose TCP, you can configure your host systems using the following command.
echo "API-KEY.metrics.tar" | ncat --ssl carbon.hostedgraphite.com 20030
MetricFire has configured TCP over TLS endpoints on port 20030, that’s why we specified this particular port in our above command.
Other options you may consider (proxying, relaying, and non-blocking metrics)
Another option would be using tools like Stunnel, a proxy designed to add TLS encryption functionality to your existing servers without any changes in your programs' code. This is useful if you don't want to configure your application to manage TLS connections.
Last but not least, it is possible to forward your traffic securely through an existing carbon-relay, in case you are already running a carbon-relay daemon for your existing Graphite infrastructure.
Also, keep in mind that TCP may be blocking and synchronous when sending data to MetricFire from a large number of servers. In this case, you can use UDP. Our language guide will help you set up HTTP(S), TCP, and UDP for different programming languages.
Conclusion
In this tutorial, we discussed the approaches to sending out data to MetricFire service and also reviewed the methods to secure data transmissions. We also peeked into the installation and configuration instructions for StatsD, and collectd. MetricFire has bundled high-grade open-source technologies, Grafana and Graphite, and made them easy to use and maintain.
We made the complex process of metric collection and visualization easier so that you can focus on your core business.
Get your free trial today and click here to get started. Also, get the MetricFire team on a video call by booking a demo. We’re always happy to support our users to use the platform to its fullest.


