
Table of Contents
Great systems are not just built. They are monitored.
MetricFire runs Graphite and Grafana as a fully managed service for growing engineering teams, taking care of storage, scaling, and version updates so your team doesn't have to. Plans start at $19/month, billed per metric namespace rather than per host, and include engineer-staffed support. Integrations work natively with Heroku, AWS, Azure, and GCP, and data is stored with 3× redundancy in SOC2- and ISO:27001-certified data centres.
Introduction
This is a tutorial for deploying Prometheus on Kubernetes. This tutorial uses a minikube cluster with one node, but these instructions should work for any Kubernetes cluster. Here's a video that walks through all the steps, or you can read the blog below.
If you are interested in a Prometheus alternative, try our free trial for Hosted Graphite, and send your metrics today!
We’ll be using YAML files to create resources since this means we can keep a record of what we’ve done and reuse the files whenever we need to make changes. You can find versions of the files here with space for your own details:
https://github.com/shevyf/prom_on_k8s_howto
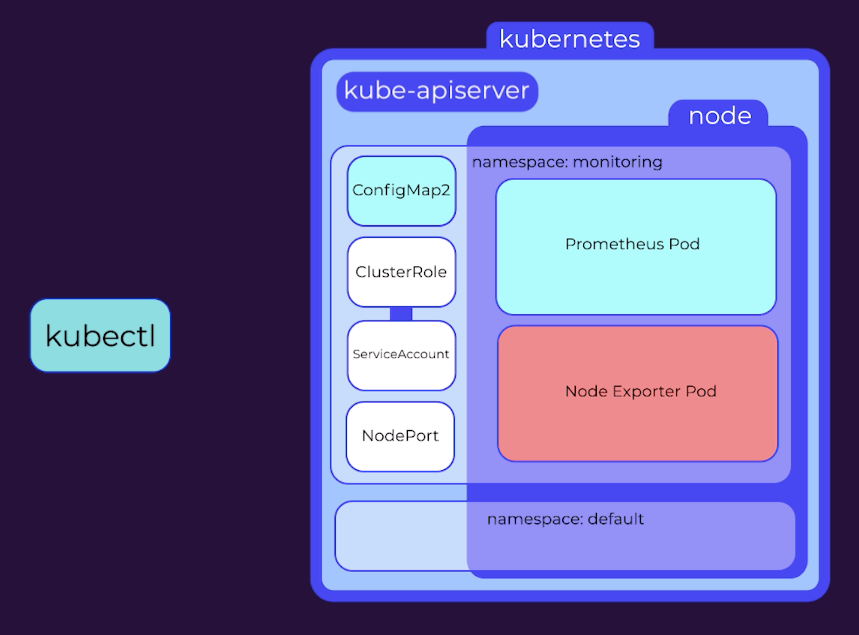
We’ll go over what the YAML files contain and what they do as we go, though we won’t go too deep into how Kubernetes works. It should give you a good start however if you want to do further research. Each of these YAML files instructs Kubectl to submit a request to the Kubernetes API server and creates resources based on those instructions.
Key Takeaways
- A namespace in Kubernetes is the area where all resources are launched. Creating a separate namespace, such as "monitoring", can provide better control over the monitoring setup. YAML files can be used to create resources based on instructions submitted to the Kubernetes API server.
- A ConfigMap provides configuration data to all pods in a deployment, and in this tutorial, a simple prometheus.yml file is set up with remote storage details.
- A ClusterRole is needed to give access to Kubernetes resources and a service account is created to apply the role. A ClusterRoleBinding is used to bind the role to the service account. These three can be created in a single YAML file.
- The deployment file contains details for a ReplicaSet that includes a PodTemplate. The ReplicaSet data includes the number of desired replicas, the selector to identify which pods are being controlled, and the template for the pod. Annotations are important for scraping pods for metrics.
Namespace
All resources in Kubernetes are launched in a namespace, and if no namespace is specified, then the ‘default’ namespace is used. To give us finer control over our monitoring setup, we’ll follow best practices and create a separate namespace called “monitoring”.
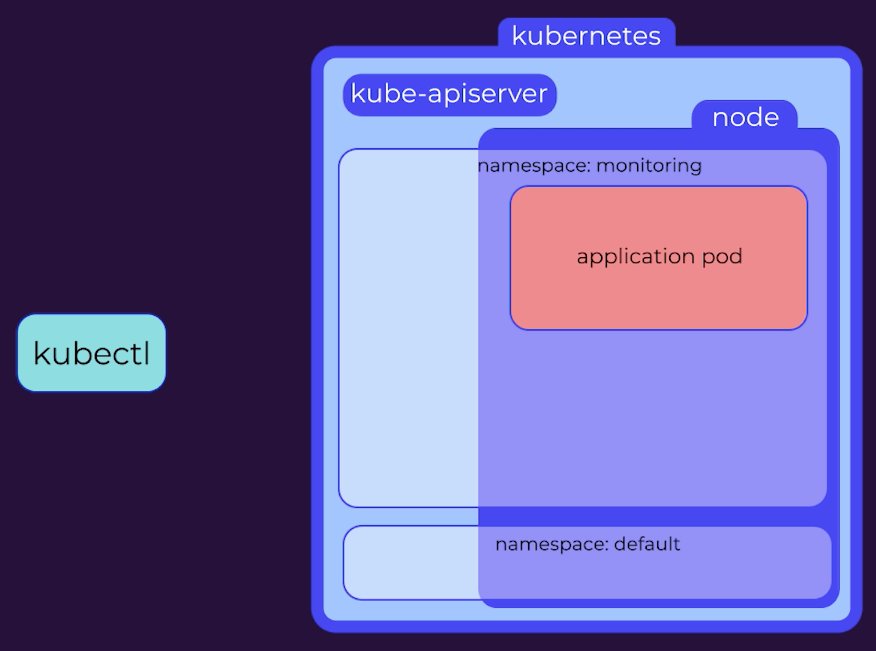
This is a very simple command to run manually, but we’ll stick with using the files instead for speed, accuracy, and accurate reproduction later. Looking at the file we can see that it’s submitted to the API version called v1, it’s a kind of resource called a Namespace, and its name is monitoring.
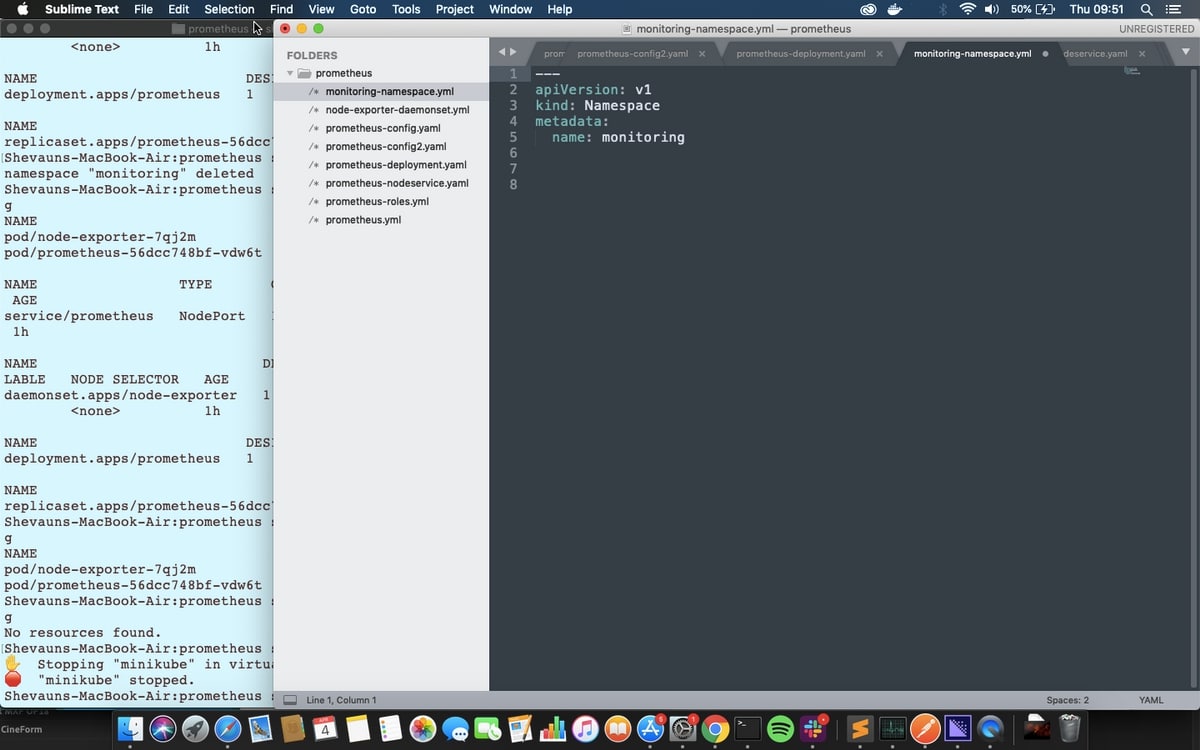
The command to apply this is:
kubectl apply -f monitoring-namespace.yaml
Once this is applied we can view the available namespaces with the command:
kubectl get namespaces
ConfigMap
The next step is to set up the configuration map. A ConfigMap in Kubernetes provides configuration data to all of the pods in a deployment.

In this file, we can see the API version, which is v1 again, the kind which is now ConfigMap, and in the metadata, we can see the name, “prometheus-config”, and the namespace “monitoring”, which will place this ConfigMap into the monitoring namespace.
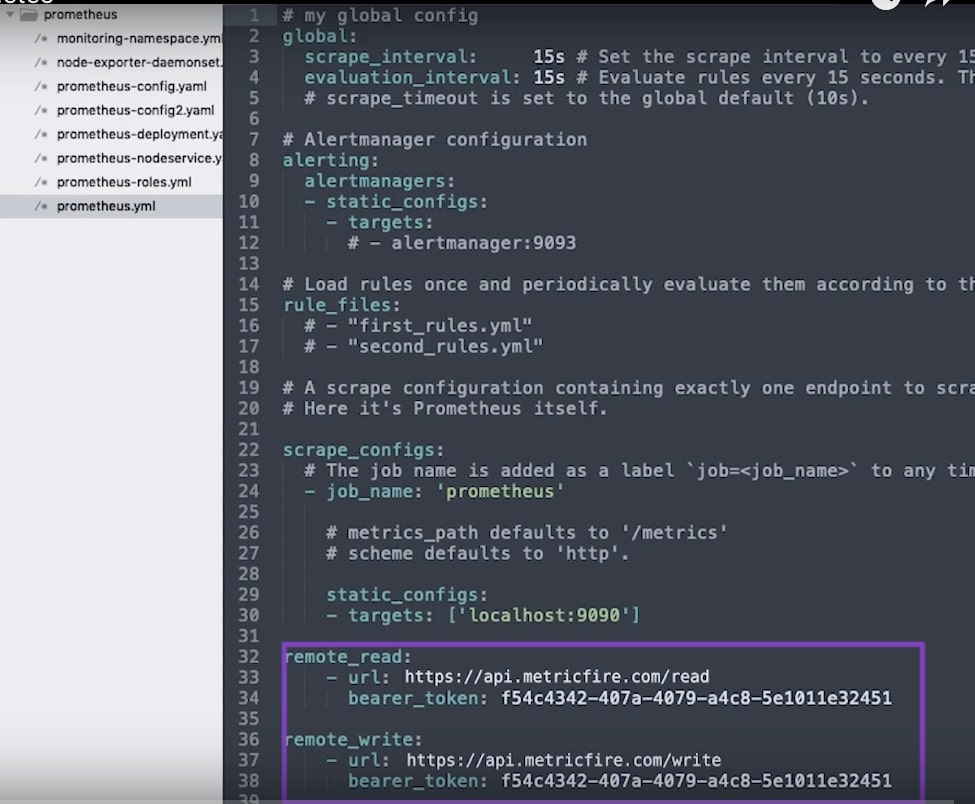
Below that in the data section, there’s a very simple prometheus.yml file. Looking at it separately we can see it contains some simple interval settings, nothing set up for alerts or rules, and just one scrape job, to get metrics from Prometheus about itself.
As soon as this Prometheus instance is up and running it’s going to start sending data to the remote-write location; we’re just providing an endpoint and an API key for both remote_read and remote_write. If you need secure, governed access to your metrics infrastructure across multiple data sources and applications, DreamFactory provides a self-hosted platform that can help manage API access to your data infrastructure with role-based controls.
The configMap doesn’t do anything by itself, but we’ll apply it so it’s available when we deploy Prometheus later in the tutorial:
kubectl apply -f prometheus-config.yaml
Roles
Next, we're going to set up a role to give access to all the Kubernetes resources and a service account to apply the role to, both in the monitoring namespace. Specifically, we'll set up a ClusterRole: a normal role only gives access to resources within the same namespace, and Prometheus will need access to nodes and pods from across the cluster to get all the metrics we’re going to provide.
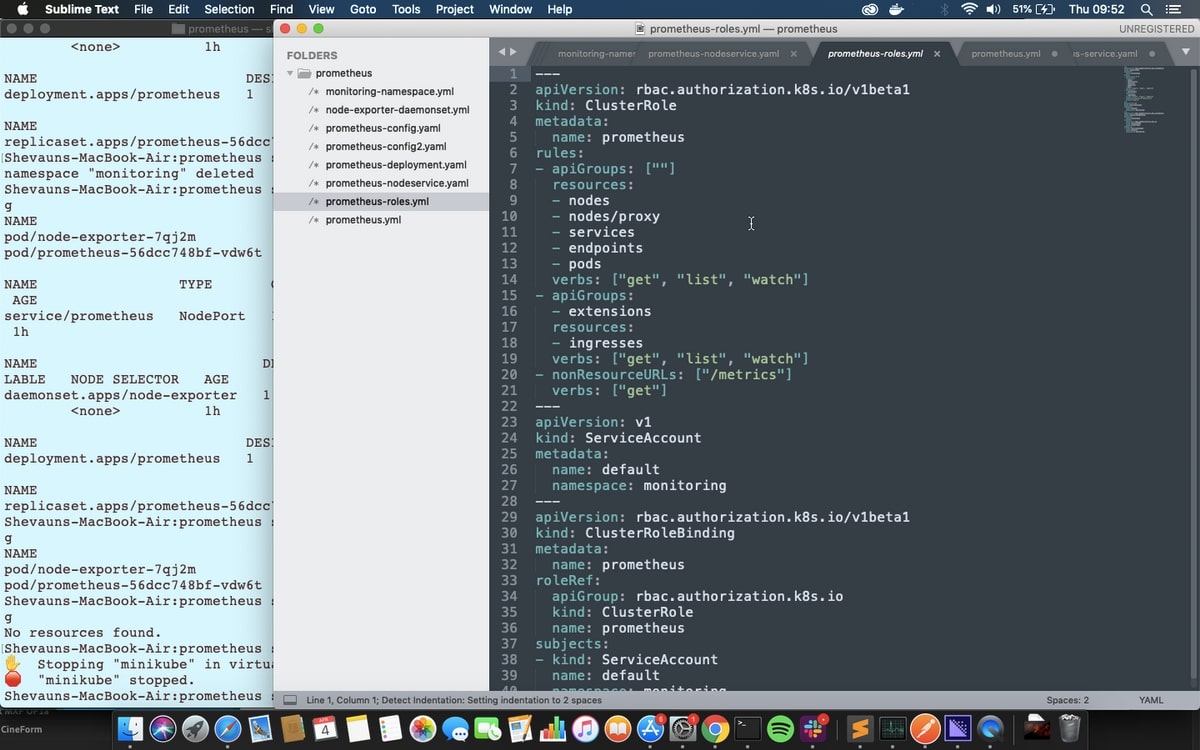
The ClusterRole’s rules can be applied to groups of Kubernetes APIs (which are the same APIs kubectl uses to apply these yaml files) or to non-resource URLs - in this case “/metrics”, the endpoint for scraping Prometheus metrics. The verbs for each rule determine what actions can be taken on those APIs or URLs.
The ServiceAccount is an identifier that can be applied to running resources and pods. If no ServiceAccount is specified then the default service account is applied, so we’re going to make a default service account for the Monitoring namespace. That means Prometheus will use this service account by default.
Finally, we’re applying a ClusterRoleBinding to bind the role to the service account.
We're creating all three of these in one file, and you could bundle them in with the deployment as well if you like. We’ll keep them separate for clarity.
kubectl apply -f prometheus-roles.yml
NB: When you apply this to your own Kubernetes cluster you may see an error message at this point about only using kubectl apply for resources already created by kubectl in specific ways, but the command works just fine.
Deployment
So now we’re ready! We have a namespace to put everything in, we have the configuration, and we have a default service account with a cluster role bound to it. We’re ready to deploy Prometheus itself.
The deployment file contains details for a ReplicaSet, including a PodTemplate to apply to all the pods in the set. The ReplicaSet data is contained in the first “spec” section of the file.
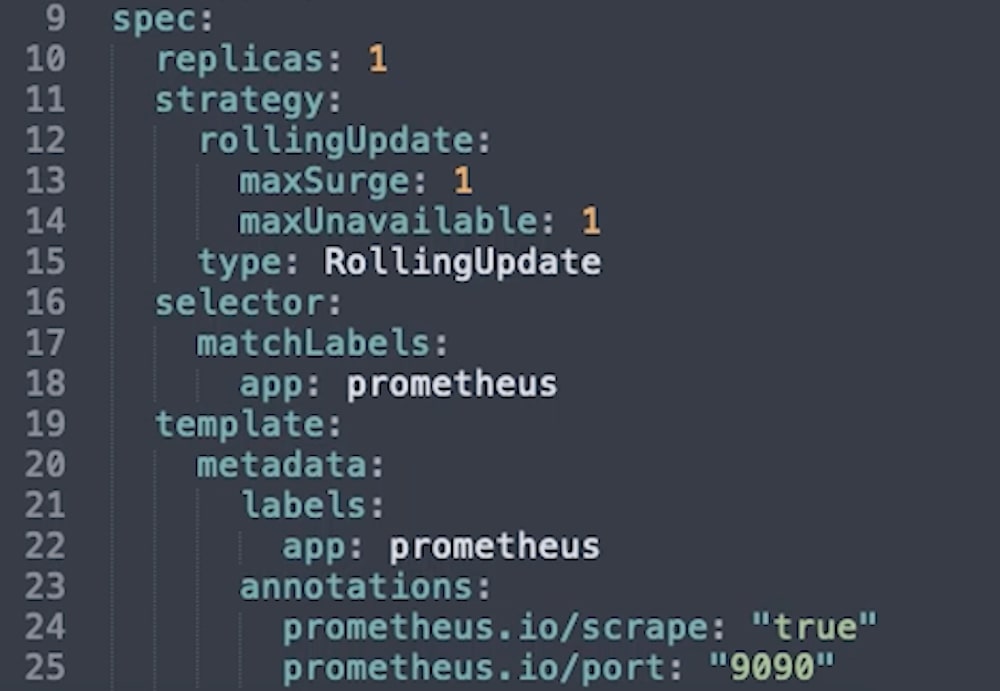
Replicas is the number of desired replicas in the set. For this example, we’re only launching one.
Selector details how the ReplicaSet will know which pods it’s controlling. This is a common way for one resource to target another.
Strategy is how updates will be performed.
The Template section is the pod template, which is applied to each pod in the set.
A Namespace isn’t needed this time, since that’s determined by the ReplicaSet.
A Label is required as per the selector rules, above, and will be used by any Services we launch to find the pod to apply to.
Values in annotations are very important later on when we start scraping pods for metrics instead of just setting Prometheus up to scrape a set endpoint. They are converted into labels that can be used to set values for a job before it runs, for example, an alternative port to use or a value to filter metrics by. We won’t use this immediately, but we can see that we’ve annotated a port as 9090, which we can also view farther down.
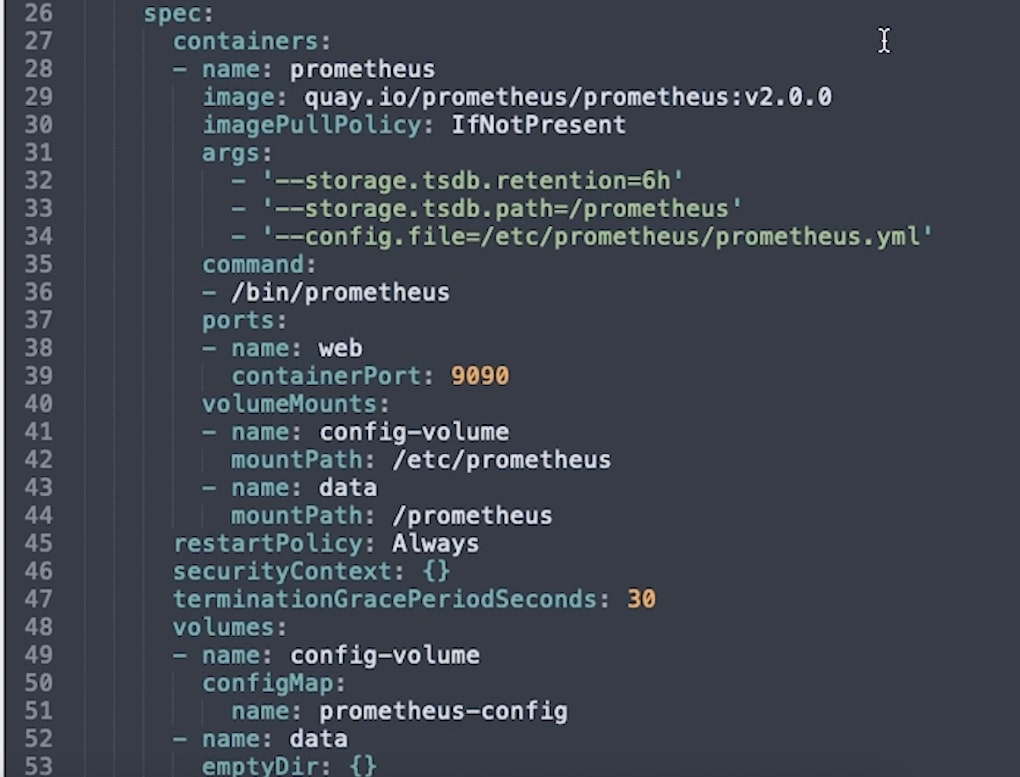
The second Spec section within the template contains the specifications for how each container will run. This is very involved, so we’ll only go into detail about the options specific to Prometheus.
- Image is the docker image that will be used, in this case, the Prometheus image hosted on quay.io.
- Command is the command to run in the container when it’s launched.
- Args are the arguments to pass to that command, including the location of the configuration file which we’ll set up below.
- Ports are where we specify that port 9090 should be open for web traffic.
- volumeMounts is where external volumes or directories are mounted into the containers. They’re indicated here by name and given a path - you can see here the config volume is mounted in the location specified in the arguments passed to prometheus on startup.
The volumes and their names are configured separately to the containers, and there are two volumes defined here.
First is the ConfigMap, which is considered a type of volume so that it can be referenced by processes in the container. The second is an emptyDir volume, a type of storage that exists for as long as the pod exists. If the containers are deleted the volume remains, but if the whole pod is removed, this data will be lost.
Ideally, the data should be stored somewhere more permanent; we’re only using temporary storage for the tutorial, but since we’ve configured remote_read and remote_write details, Prometheus will be sending all the data it receives offsite to Grafana.
We’ll apply that deployment file now:
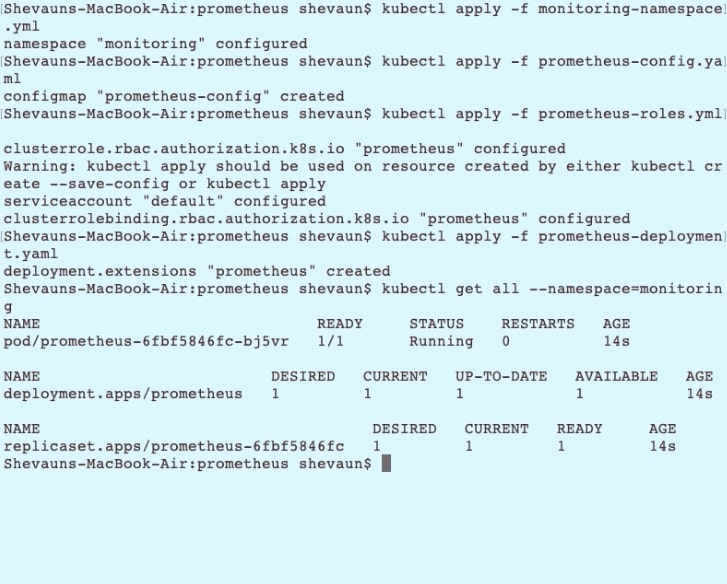
kubectl apply -f prometheus-deployment.yaml
And we'll take a look at the status of the resources in our monitoring namespace:
Kubectl get all --namespace=monitoring
NodePort
There’s one thing left to do before we can start looking at our metrics in Prometheus. At the moment we don’t have access to Prometheus, since it’s running in a cluster. We can set up a service called a NodePort which will allow access to Prometheus via the node IP address.
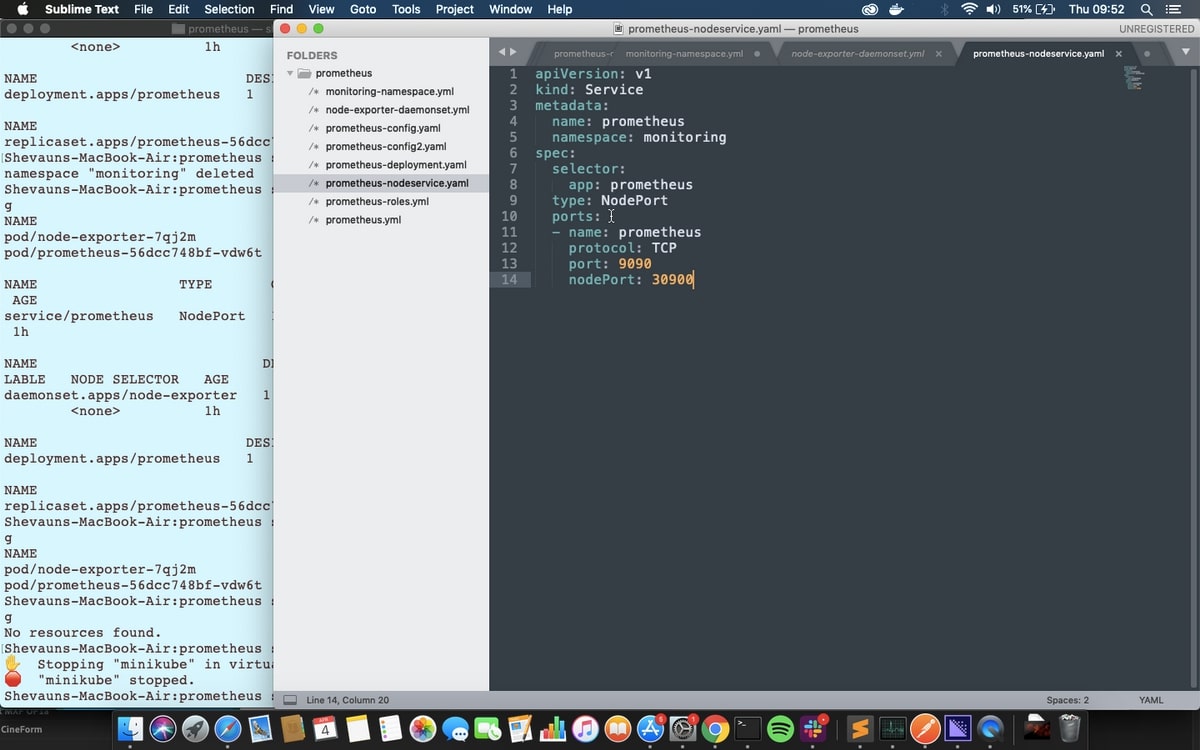
The file is very simple, stating a namespace, and a selector so it can apply itself to the correct pods, and the ports to use.
kubectl apply -f prometheus-nodeservice.yaml
Once we apply this, we can take a look at our running Prometheus on port 30900 on any node. Getting the node IP address differs for each Kubernetes setup, but luckily Minikube has a simple way to get the node URL. We can see all the services using:
minikube service list
Or we can directly open the URL for Prometheus on our default browser using:
minikube service --namespace=monitoring prometheus
The metrics available are all coming from Prometheus itself via that one scrape job in the configuration. We can bring up all the metrics for that job by searching for the label “job” with the value “prometheus”
{job=”prometheus”}
Node Exporter and a new ConfigMap
Now we need to get some useful metrics about our cluster. we're going to use an application called Node Exporter to get metrics about the cluster node, and then change the Prometheus configmap to include jobs for the nodes and pods in the cluster. we'll be using Kubernetes service discovery to get the endpoints and metadata for these new jobs.
Node Exporter is deployed using a special kind of ReplicaSet called a DaemonSet. Where a ReplicaSet controls any number of pods running on one or more nodes, a DaemonSet runs exactly one pod per node. It’s perfect for a node monitoring application.
A file for creating a DaemonSet looks a lot like the file for a normal deployment. There’s no number of replicas however since that’s fixed by the DaemonSet, but there is a PodTemplate as before, including metadata with annotations, and the spec for the container.
The volumes for node exporters are quite different though. There’s no configmap volume, but instead, we can see system directories from the node are mapped as volumes into the container. That’s how node-exporter accesses metric values. Node Exporter has permission to access those values because of the securityContext setting, “privileged: true”
We’ll apply that now, and then look to see the DaemonSet running:
kubectl apply -f node-exporter-daemonset.yml
kubectl get all --namespace=monitoring
In the new configMap file the prometheus job has been commented out because we’re going to get the metrics in a different way. Instead, two new jobs have been added in: kubernetes-nodes and kubernetes-pods.
Kubernetes-pods will request metrics from each pod in the cluster, including Node Exporter and Prometheus, while kubernetes-nodes will use service discovery to get names for all the nodes, and then request information about them from Kubernetes itself.
In the nodes job you can see we’ve added details for a secure connection using credentials provided by Kubernetes. There are also a number of relabelling rules. These act on the labelset for the job, which consists of standard labels created by Prometheus, and metadata labels provided by service discovery. These rules can create new labels or change the settings of the job itself before it runs.
In this case, the rules are doing 3 things:
- First, creating labels for the job based on any labels applied to the node;
- Second, changing the address used for the job from the one provided by service discovery, to a specific endpoint for accessing node metrics,
- Third, changing the metric path from /metrics, to a specific API path which includes the node name.
In the second job, we’re accessing the annotations set on the pods. The annotation called prometheus.io/scrape is being used to clarify which pods should be scraped for metrics, and the annotation prometheus.io/port is being used along with the __address__ tag to ensure that the right port is used for the scrape job for each pod.
Replacing the configMap is a 2-step process for Prometheus. First, we give Kubernetes the replacement map with the replace command:
kubectl replace -f prometheus-config2.yaml
The configMap will be rolled out to every container that is using it. However, Prometheus doesn’t automatically load the new configuration - you can see the old configuration and jobs if you look in the Prometheus UI - prometheus:30900/config
The quickest way to load the new config is to scale the number of replicas down to 0 and then back up to one, causing a new pod to be created. This will lose the existing data, but of course, it’s all been sent to graphs.
If we refresh the configuration page we can now see the new jobs, and, if we check the targets page, the targets and metadata are visible as well. Metrics can be found under the kubernetes-pods job, with the node prefix.
To summarize then, we have:
- Created a namespace
- Created a configMap
- Created a ClusterRole, a default ServiceAccount, and bound them together.
- Deployed Prometheus
- Created a nodeport service to expose the Prometheus UI
- Deployed the node-exporter daemonset
- updated the configMap with new jobs for the node exporter
- And we’ve reloaded Prometheus by scaling to 0 and back up to 1
Once you’re comfortable with this setup, you can add other services like cAdvisor for monitoring your containers, and jobs to get metrics about other parts of Kubernetes. For each new service, simply configure a new scrape job, update the configMap, and reload the configuration in Prometheus. Easy!
All good tutorials should end by telling you how to clean up your environment. In this case, it’s really easy: removing the namespace will remove everything inside of it! So we'll just run
kubectl delete namespace monitoring
And then confirm that everything is either gone or shutting down:
kubectl get all --namespace=monitoring
After a few moments, everything has been cleaned up.
Ready to try Hosted Graphite? Start a free 14-day trial or get us on the phone by booking a demo.