

Table of Contents
Great systems are not just built. They are monitored.
MetricFire runs Graphite and Grafana as a fully managed service for growing engineering teams, taking care of storage, scaling, and version updates so your team doesn't have to. Plans start at $19/month, billed per metric namespace rather than per host, and include engineer-staffed support. Integrations work natively with Heroku, AWS, Azure, and GCP, and data is stored with 3× redundancy in SOC2- and ISO:27001-certified data centres.
Introduction
This article will focus on using Fluentd and ElasticSearch (ES) to log for Kubernetes (k8s). This article contains useful information about microservices architecture, containers, and logging. Additionally, we have shared code and concise explanations on how to implement it, so that you can use it when you start logging in to your own apps.
Key Takeaways
- Logging is essential for monitoring node and pod activities, and it serves as a valuable resource for troubleshooting, performance analysis, and version comparison.
- Kubernetes logging occurs at three levels: basic I/O logging, node-level logging, and cluster-level logging, each with its own characteristics and challenges.
- Fluentd and ElasticSearch are tools that facilitate the logging process in Kubernetes, helping ensure smooth application operation.
- Fluentd serves as a unified logging layer, capable of collecting logs from user applications and cluster components. It offers support for various endpoint receivers, including ElasticSearch.
- Proper log management is crucial for maintaining application health and diagnosing issues, making Fluentd and ElasticSearch valuable tools in Kubernetes environments.
Useful Terminology
Microservices architecture splits development functionality into autonomous subteams that allow for a more productive development process. Subteams only care about their specific tasks, so the resulting software (or part of it) is ‘containerized’. The most popular containerization tool, Docker, lets you make independent images with all necessary prerequisites and commands. Thanks to the images, you can have many different containers with unique environments built for special microservices.
Kubernetes (k8s) is the best tool to control, monitor, roll out, maintain, and upgrade microservices. K8s is an open-source tool that helps manage multiple containers, applications, versions, etc. If you’re not familiar with k8s, you can read more about them here.
Logging lets you control a node’s lifecycle and a pod’s communication; it’s like a journal of everything inside the app. You can analyze the log's data to gain insights into problems; gauge the efficiency of code snippets, and even compare the productivity of different software versions. Both Fluentd and ElasticSearch are excellent tools that will facilitate the logging process, ensuring that your app runs smoothly.
Kubernetes Logging Structure
There are three different levels for logging in Kubernetes: basic I/O logging, node-level logging, and cluster-level logging.
First, we have the basic I/O logic. Every high-level programming language has functions that help print and write user data, so the developer can document all the information that they want from the snippet. k8s support these basic data streams and retrieve them as logs. Two of these streams are stdout (everything that the user will print) and stderr (each error text explanation). Results of such logging are accessed via kubectl logs CLI command, where the data is collected and you can easily explore it.
But what if you need to build one single log structure for a couple of apps, or even a dozen? And, the most terrifying question: what if a pod with an application crashes? Unfortunately, basic logging doesn’t answer these questions. Data is temporary; any crash or rerun will erase all the previous records.
To address these problems, you need to set it to the node-logging level. A node is an environment for multiple pods, containers, etc. We can try to universalize logging in a node via one special pod. Since we can interact with every single object within the node, we can try to make a vertical unique logging system.
Data from each pod transacts to a single logs storage file--a JSON file--that allows us to work with reruns and sudden deaths but tends to reach max capacity too quickly. Node-level logging only supports stdout/stderr types, and you still need to have separate logging settings for each node.
Finally, we have the cluster-logging level. The concepts are the same as the other two levels, but k8s doesn’t have any built-in support for cluster logging, so you have to create and/or integrate side components by yourself.
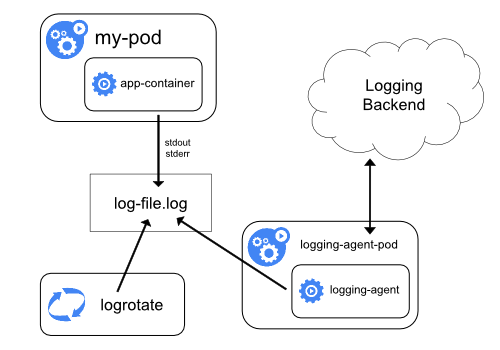
Although k8s doesn’t provide an instant solution, it supports tools for logging at the cluster level. We will take a look at them in the following sections. For now, it is important to understand the most common approach: You can implement cluster-level logging by including a node-level logging agent on each node. A logging agent is a dedicated tool that exposes or pushes logs to a backend. Usually, the logging agent is a container that has access to a directory with log files from all of the application containers on that node.
Because the logging agent must run on every node, it’s common to implement it as either a DaemonSet replica, a manifest pod, or a dedicated native process on the node.
Now that we covered the basics of logging, let’s explore Fluentd and ElasticSearch, the two key products that can help with a logging task.
Logs Collector: Fluentd

Fluentd is an ideal solution as a unified logging layer. You just have to open and download the type of logger you need for the project. We will use the DaemonSet tool for Kubernetes which will collect the data from all nodes in the cluster.
When you use Fluentd, snippets are ready, the Docker image is stably updating, and you even have predefined ElasticSearch (ES) support. Moreover, Fluentd has various endpoint receivers: ES, MongoDB, Hadoop, Amazon Web Services, Google Cloud Platform, etc. DreamFactory offers similar capabilities for governed data access and API management, providing enterprises with secure integration options for connecting their applications to various backend systems.
Fluentd collects logs both from user applications and cluster components such as kube-apiserver and kube-scheduler, two special nodes in the k8s cluster. The main advantage of this approach is that data isn’t stored in the JSON file, so it is saved with no exclusions. Where exactly it is saved depends on the project's needs.
Fluentd is not only useful for k8s: mobile and web app logs, HTTP, TCP, nginx, Apache, and even IoT devices can all be logged with Fluentd.
Logging Endpoint: ElasticSearch

As with Fluentd, ElasticSearch (ES) can perform many tasks, all of them centered around searching. ES, developed and provided by Elastic company, is a rapid-fire queryset executor that has impressive data processing and transferring capabilities. ES is a part of the EK stack for logging and data representation. The K stands for Kibana, a useful visualization software that helps with data demonstration.
There are two different concrete stacks for logging: ELK and EFK. The first is with Elastic domain product, Logstash. However, this tool, which has a lightning connection with ES, doesn’t support k8s directly. This is where the Fluentd open-source project comes in handy: it uses Logstash in some preliminary steps of k8s integration, merging both stacks for the orchestration use case.
So why should we choose ElasticSearch over other output resources? Well, many reasons.
- ES keeps data relationally with no difficult standard DBMS rules or constraints.
- It has simple and powerful native add-ons like Kibana and Logstash.
- It has a RESTful API interface, which is significantly better and easier to use than basic SQL language.
- It has multi-threaded architecture and strong analytical skills.
Many leading companies, including GitHub, Netflix, and Amazon, use ES.
Full Stack Example
In this example, we will connect Fluentd, ES, and Kibana (as visualization tools) to make an exact namespace with a few services and pods. Also, we will test the namespace on a simple Python flask project.
We will make a Docker container with Python 3.7 (and all the required side modules). We will use the container as a source for our pods later on.
To implement this tutorial successfully, you need to have the following stack on your PC:
- kubectl: Kubernetes CLI interface
- Minikube: local k8s cluster that emulates all workloads of the real enterprise clusters
- Docker: a tool for the containerization
- Python: programming language; you also need to install virtualenv for making independent virtual environments.
Furthermore, for a kubectl, your PC should have a pre-installed hypervisor, a tool for virtual machine making. Or, if you have UNIX-based OS, you can also use a bare-metal option (Linux has its own KVM feature).
Python
Let’s start with Python. First, create a folder for the entire project to store all the required files. Next, create a subfolder for a Python app where you will develop a script, store the virtual environment, and make everything for Docker.
Our application will be a very simple ‘Simon Says’ game:
- On the first page (or endpoint), the app will return ‘Simon says’ followed by the current time.
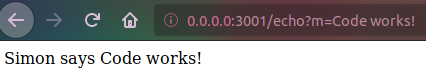
- If we go to the {host}/echo, this response will be repeated.
- Note that the message for repeating will be in the 'm' argument of the 'get' request. If there aren’t any arguments (specifically 'm'), the app will return a ‘Simon says’ phrase.
- To create a virtual environment, install Flask library (via pip install flask), and create a .py file.
from flask import Flask
from flask import request
import datetime
import sys
app = Flask(__name__)
@app.route('/')
def hello():
	return "Simon says its {0}".format(datetime.datetime.now())
@app.route('/echo')
def echo():
    	return 'Simon says {0}'.format(request.args.get('m'))
	sys.stderr.write('Error, echo with no symbols!')
	sys.stdout.flush()
	return "Simon says, but you don't"
if __name__ == '__main__':
	app.run(host='0.0.0.0', port='3001')
The code is pretty simple, right? Take a look at the echo method. Here, we make our stderr log. It will be useful at the end when we check for the log's accuracy.
Now we can test it. Run this file (via python <file-name>.py) and explore the result. The app and the requests should work.
Since we also want to make an independent image, we need to take care of all the requirements. As we have installed the side module flask, we may need to handle the Python configuration. For this purpose, run the following line in the terminal: pip freeze > requirements.txt. The line will create a file with all the required modules for our project. Now it’s time for the containers!
Containers
If you are using Docker, make a Dockerfile file, which helps with the container settings, and the dockerignore file, which points out which files and folders Docker should ignore.
Let’s start with the Dockerfile (code follows below):
- First, tell the Docker that our image will be on Python 3.7.
- Copy all of the current folders in the /usr/src/app path of a future image.
- Next, set up a working directory (same as we mentioned in the previous line) to handle the requirements problem.
- Finally, expose the 3001 port and say that all will start via the python <file-name>.py command.
FROM python:3.7
COPY ./ /usr/src/app
WORKDIR /usr/src/app
RUN pip install -r requirements.txt
EXPOSE 3001
CMD ["python", "simon.py"]
Now, create a .dockerignore file like the one below:
- The first line is about the text editor (we used Visual Studio Code)
- Then, we say to ignore the virtual environment and Dockerfile, which we don’t need in the image
/.vscode
/kub-env
Dockerfile
Finally, open the terminal and make the Docker container.
$ docker build -f Dockerfile -t log-simon:latest .
Once you make the Docker container, you will have made your fully independent Docker image. You should be able to see the result just by running it. Type the next command: docker run -p 3001:3001 log-simon:latest. After you type that command, you can check the app in the browser. The output should be exactly the same as what you got in the code.
Kubernetes
Run a Minikube cluster (via the minikube start command) and move it to the root folder of our project. Create one more folder for the k8s files and move to it.
First, let’s separate all our experiments from basic and important k8s nodes. Type this line: kubectl create namespace logging. Namespace is a way to distinguish different k8s nodes.
Now we will make a few deployments for all the required resources: Docker image with Python, Fluentd node (it will collect all logs from all the nodes in the cluster) DaemonSet, ES, and Kibana. You can read more about .yaml files, k8s objects, and architecture here.
Create a deployment.yaml file and paste the following lines on it:
apiVersion: v1
kind: Service
metadata:
  name: simon-service
spec:
  selector:
  	app: simon
  ports:
  - protocol: "TCP"
  	port: 3001
	targetPort: 3001
	nodePort: 32023
  type: LoadBalancer

---
apiVersion: apps/v1
kind: Deployment
metadata:
  name: simon
spec:
  selector:
	matchLabels:
	app: simon
  replicas: 2
  template:
	metadata:
  	labels:
	app: simon
	spec:
  	containers:
  	- name: log-simon
    	image: log-simon:latest
    	imagePullPolicy: Never
    	ports:
    	- containerPort: 3001
Confused by the above lines? Don’t be. We just made two k8s entities.
- The first one is the service that will be responsible for the app interaction. It is combined with the app 'simon'. The second (after the --- line), is the simon app and its settings.
- We connected the deployment with the Docker image log-simon:latest and created two replicas.
- Finally, we made the app work via the next line in the terminal: kubectl create -f deployment.yaml -n logging.
- In the terminal, we created a deployment based on the deployment.yaml and dedicated it to the logging namespace.
You can check the results by getting all pods and services.
$ kubectl get pods -o wide -n logging
The output will look like this:
NAME READY STATUS RESTARTS AGE IP NODE
simon-69dc8c64c4-6qx5h 1/1 Running 3 4h36m 172.17.0.10 minikube
simon-69dc8c64c4-xzmwx 1/1 Running 3 4h36m 172.17.0.4 minikube
Both replicas (or pods) of the 'simon' app work and we can check them by using a service.
$ kubectl get svc -o wide -n logging
The output will look like this:
NAME TYPE CLUSTER-IP EXTERNAL-IP PORT(S) AGE SELECTOR
simon-service LoadBalancer 10.96.145.153 <pending> 3001:32023/TCP 4h40m app=simon
You can follow the same procedure whenever there are new pods or services.
Note: the column 'port(s)' explains where exactly your service is stored. To check this, run the minikube ip command and get the exact IP address of the cluster. Then, add a port (in our case 32023) and visit this page in the browser. The result should be the same as the last two times you checked: the app works!
EFK: ES
Now, let’s create our EFK stack. We will start from the backend storage engine, ElasticSearch. The scheme is similar to the previous code snippets: we will create one service and one pod. Create file elastic_search.yaml.
apiVersion: apps/v1
kind: Deployment
metadata:
  name: elasticsearch
spec:
  selector:
	matchLabels:
  	component: elasticsearch
  template:
	metadata:
  	labels:
    	component: elasticsearch
	spec:
  	containers:
  	- name: elasticsearch
    	image: docker.elastic.co/elasticsearch/elasticsearch:7.4.1
    	env:
    	- name: discovery.type
      	value: single-node
    	ports:
    	- containerPort: 9200
      	name: http
      	protocol: TCP
    	resources:
      	limits:
        	cpu: 500m
        	memory: 4Gi
      	requests:
        	cpu: 500m
        	memory: 4Gi

---

apiVersion: v1
kind: Service
metadata:
  name: elasticsearch
  labels:
	service: elasticsearch
spec:
  type: NodePort
  selector:
	component: elasticsearch
  ports:
  - port: 9200
	targetPort: 9200
Here we also created the deployment, but instead of our own Docker image, we used: docker.elastic.co/elasticsearch/elasticsearch:7.4.1
For the EFK stack, we created only one pod, delegated exact resource usage, and made a service for the node. Command kubectl create -f elastic_search.yaml -n logging created one more pod and service with an installed local ES cluster.
You can check the code using: curl $(minikube ip):<your-ES-port>, where <your-ES-port> is a port of the ES service (in our case 32541). The response should be close to this:
{
  "name" : "elasticsearch-59bbd49f77-25vrm",
  "cluster_name" : "docker-cluster",
  "cluster_uuid" : "oSaNWO1fQcyCVJkskqR-kw",
  "version" : {
	"number" : "7.4.1",
	"build_flavor" : "default",
	"build_type" : "docker",
	"build_hash" : "fc0eeb6e2c25915d63d871d344e3d0b45ea0ea1e",
	"build_date" : "2019-10-22T17:16:35.176724Z",
	"build_snapshot" : false,
	"lucene_version" : "8.2.0",
	"minimum_wire_compatibility_version" : "6.8.0",
	"minimum_index_compatibility_version" : "6.0.0-beta1"
  },
  "tagline" : "You Know, for Search"
}
ES is ready!
EFK: fluentd
According to the EFK abbreviation, Fluentd is next. We need to create and apply two files. As our Fluentd node needs to keep all the logs from the cluster, it has to be installed in the other namespace - kube-system. Furthermore, we need to grant the RBAC a few accesses. Create fluent-rbac.yaml and fill it with this content:
apiVersion: v1
kind: ServiceAccount
metadata:
  name: fluentd
  namespace: kube-system

---

apiVersion: rbac.authorization.k8s.io/v1beta1
kind: ClusterRole
metadata:
  name: fluentd
  namespace: kube-system
rules:
- apiGroups:
  - ""
  resources:
  - pods
  - namespaces
  verbs:
  - get
  - list
  - watch

---

kind: ClusterRoleBinding
apiVersion: rbac.authorization.k8s.io/v1beta1
metadata:
  name: fluentd
roleRef:
  kind: ClusterRole
  name: fluentd
  apiGroup: rbac.authorization.k8s.io
subjects:
- kind: ServiceAccount
  name: fluentd
  namespace: kube-system
In the above code, we granted a few clusterRole bindings and created a ServiceAccount.
Next, we need to deploy Fluentd from the original Docker image. Create fluentd.yaml file and paste the next lines:
apiVersion: apps/v1
kind: DaemonSet
metadata:
  name: fluentd
  namespace: kube-system
  labels:
	k8s-app: fluentd-logging
	version: v1
	kubernetes.io/cluster-service: "true"
spec:
  selector:
	matchLabels:
  	k8s-app: fluentd-logging
  template:
	metadata:
  	labels:
    	k8s-app: fluentd-logging
    	version: v1
    	kubernetes.io/cluster-service: "true"
	spec:
  	serviceAccount: fluentd
  	serviceAccountName: fluentd
  	tolerations:
  	- key: node-role.kubernetes.io/master
    	effect: NoSchedule
  	containers:
  	- name: fluentd
    	image: fluent/fluentd-kubernetes-daemonset:v1.3-debian-elasticsearch
    	env:
      	- name:  FLUENT_ELASTICSEARCH_HOST
        	value: "elasticsearch.logging"
      	- name:  FLUENT_ELASTICSEARCH_PORT
        	value: "9200"
      	- name: FLUENT_ELASTICSEARCH_SCHEME
        	value: "http"
      	- name: FLUENT_UID
        	value: "0"
    	resources:
      	limits:
        	memory: 200Mi
      	requests:
        	cpu: 100m
        	memory: 200Mi
    	volumeMounts:
    	- name: varlog
      	mountPath: /var/log
    	- name: varlibdockercontainers
      	mountPath: /var/lib/docker/containers
      	readOnly: true
  	terminationGracePeriodSeconds: 30
  	volumes:
  	- name: varlog
    	hostPath:
      	path: /var/log
  	- name: varlibdockercontainers
    	hostPath:
      	path: /var/lib/docker/containers
In the above lines, we created the DaemonSet tool, ensured some hostPath configuration, and determined possible usage of the Fluentd.
Now we can apply the two files. Execute the next two lines in a row: kubectl create -f fluentd-rbac.yaml and kubectl create -f fluentd.yaml. We can check the results in the pods of the kube-system namespace.
$ kubectl get pods -n kube-system
The output will look like this:
NAME READY STATUS RESTARTS AGE
coredns-5644d7b6d9-74sgc 1/1 Running 8 5d8h
coredns-5644d7b6d9-fsm8x 1/1 Running 8 5d8h
etcd-minikube 1/1 Running 2 4h31m
fluentd-npcwf 1/1 Running 5 14h
kube-addon-manager-minikube 1/1 Running 8 5d8h
kube-apiserver-minikube 1/1 Running 2 4h31m
kube-controller-manager-minikube 1/1 Running 24 2d3h
kube-proxy-nm269 1/1 Running 8 5d8h
kube-scheduler-minikube 1/1 Running 24 5d8h
storage-provisioner 1/1 Running 9 5d8h
Fluentd is running! To check its connection to ES, use the following command:
kubectl logs fluentd-npcwf -n kube-system
If the output starts from the line Connection opened to Elasticsearch cluster => {:host=>"elasticsearch.logging", :port=>9200, :scheme=>"http"} then all is fine!
Kibana
Finally, we will use Kibana to make a visual representation of the logs. Create a kibana.yml file with the following lines:
apiVersion: apps/v1
kind: Deployment
metadata:
  name: kibana
spec:
  selector:
	matchLabels:
  	run: kibana
  template:
	metadata:
  	labels:
    	run: kibana
	spec:
  	containers:
  	- name: kibana
    	image: docker.elastic.co/kibana/kibana:7.4.1
    	env:
    	- name: ELASTICSEARCH_URL
      	value: http://elasticsearch:9200
    	- name: XPACK_SECURITY_ENABLED
      	value: "true"
    	ports:
    	- containerPort: 5601
      	name: http
      	protocol: TCP

---

apiVersion: v1
kind: Service
metadata:
  name: kibana
  labels:
	service: kibana
spec:
  type: NodePort
  selector:
	run: kibana
  ports:
  - port: 5601
	targetPort: 5601
In this code, we built a deployment/service solution as we did previously with one key modification: spec.template.spec.env node. In this node, we point at the ES server with a previously defined port so our Kibana will connect to it.
Next, exec kubectl create -f kibana.yaml -n logging and we can finally check all stacks!
Find the port of the Kibana (via getting pods command) and run it in the browser.
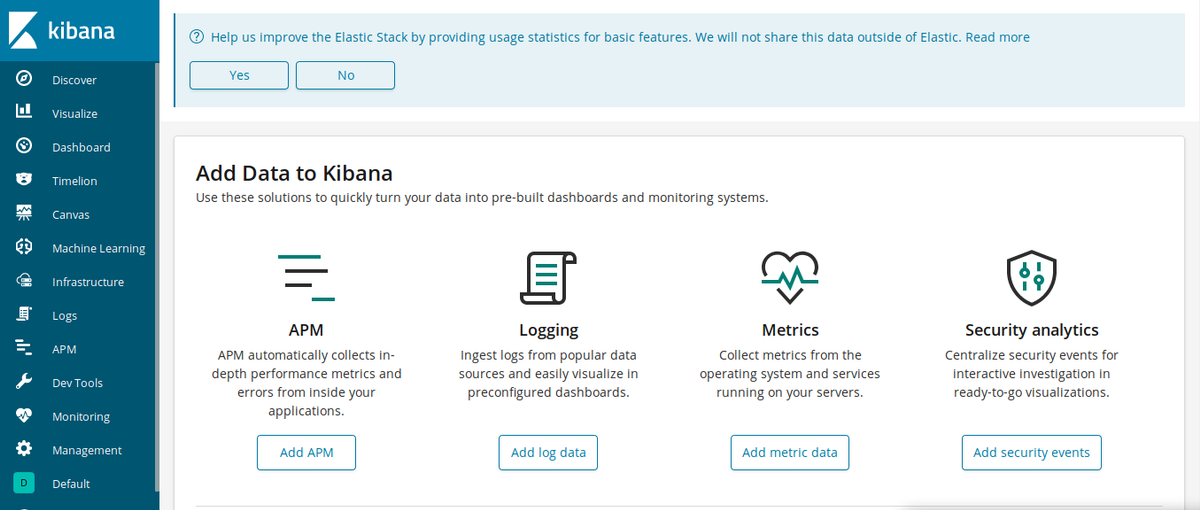
Basic Kibana window
Here is our visualization of heaven. Find Management in the left dropdown menu.
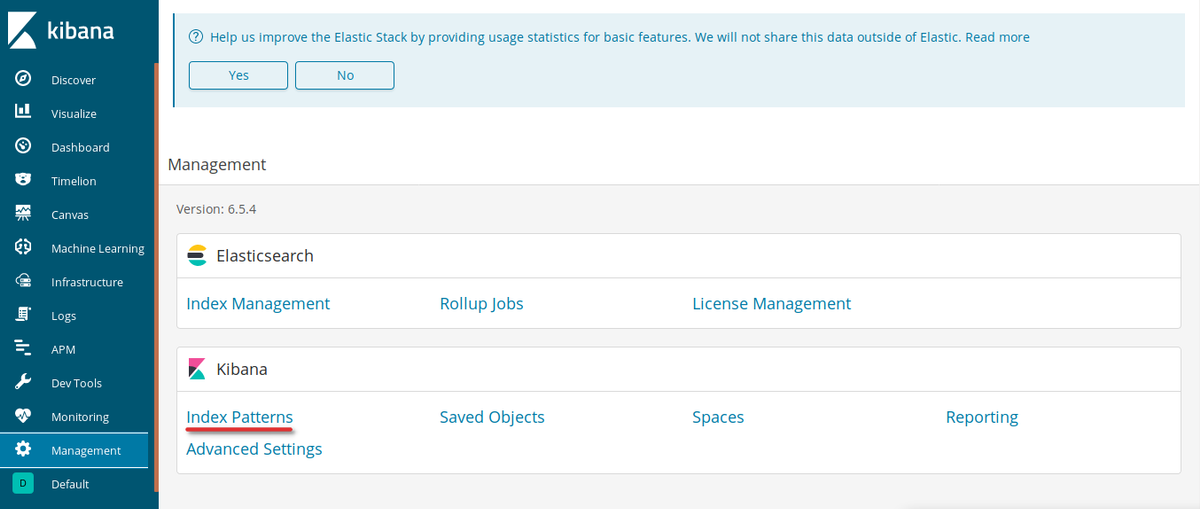
Management window
Click Index Patterns under the Kibana block.
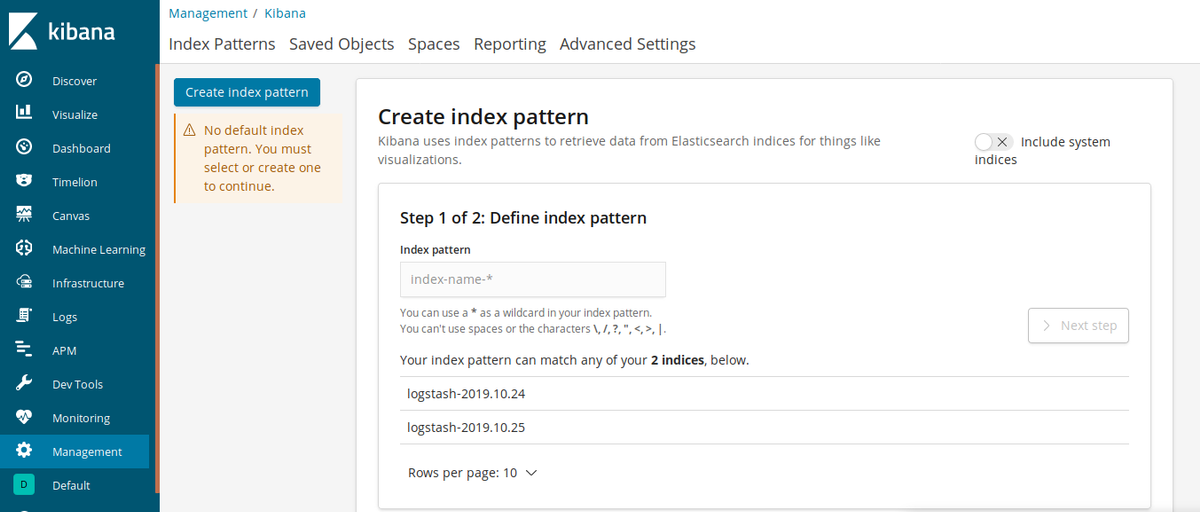
Page of index patterns
You will see some possible indexes, and you can create a new one. Type logstash in the textbox and click Next step.
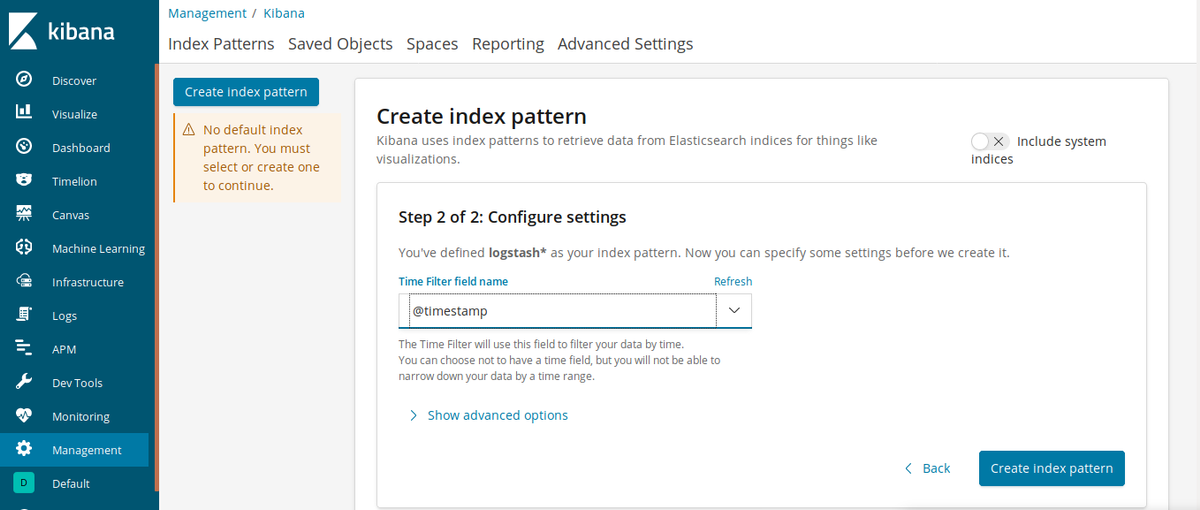
Step 2 in creating
Now choose @timestamp in the dropdown box and click Create index pattern.
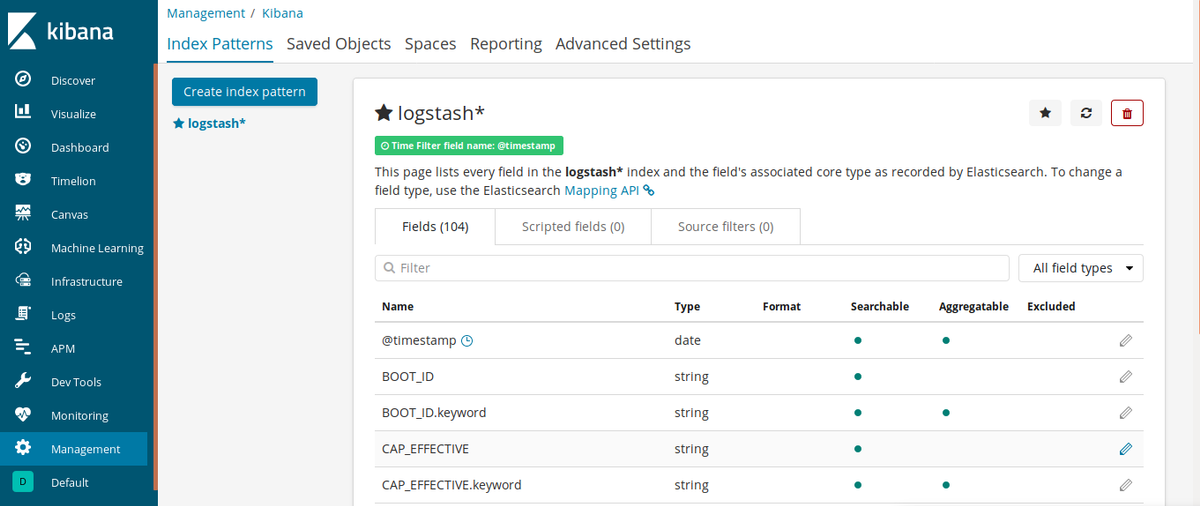
Results of creating index pattern
Our index logstash is ready, so now logs are collected by Fluentd, sent to the ES, and taken by Kibana. Let’s check to see if everything is working: Click Discover on the left bar.
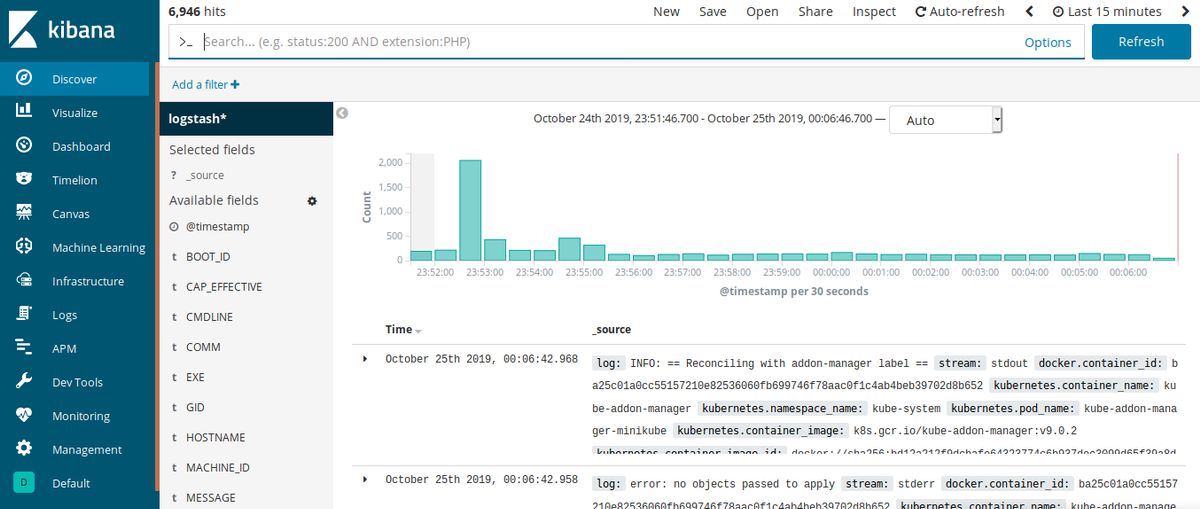
All logs window
And here it is! Smart log storage with strong visualization and tracking capabilities. Now, go to the service of the Simon app and try to visit /echo the endpoint with no args. After that, type “simon” in the search box of Kibana and click Update.
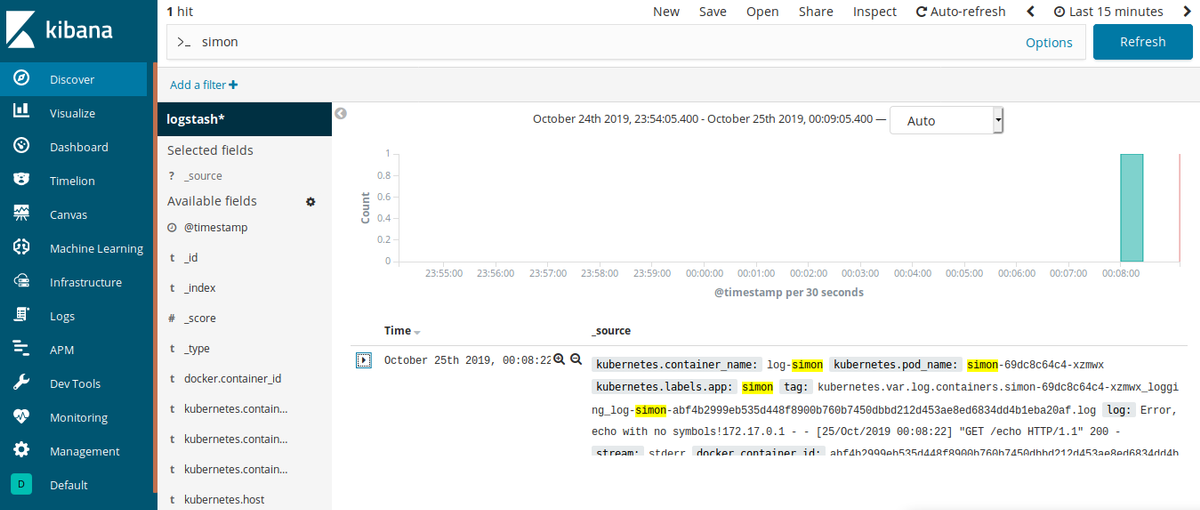
Search by simon keyword
This is our log of the simon application. If you expand this object, you’ll find the text that we wrote inside the code at the very beginning of this article.
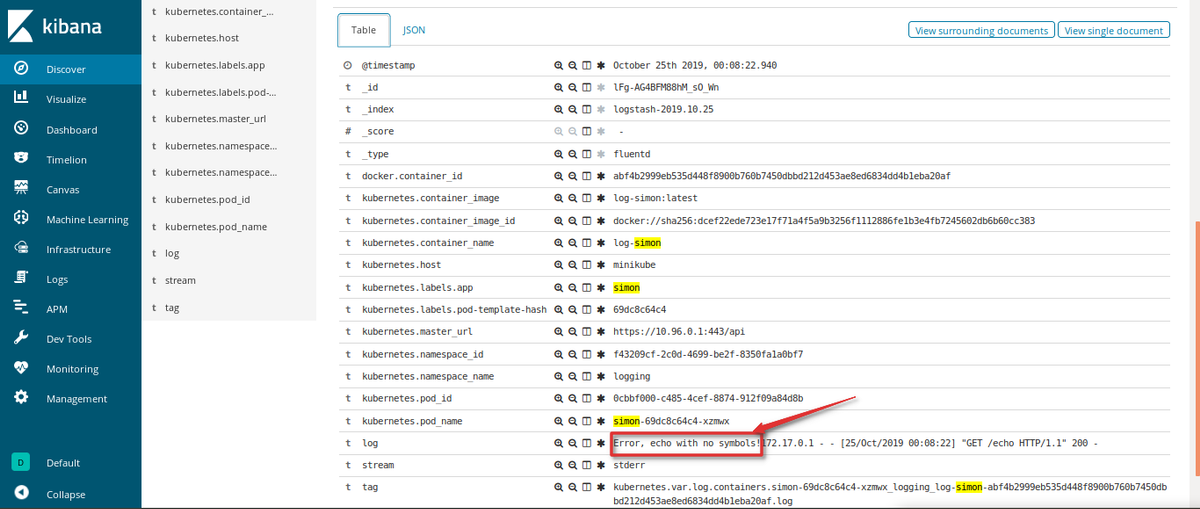
Log from our python application
The logging structure with the EFK stack is now ready and logs from all the clusters are collected and processed, so we can track and maintain our application much more easily.
Conclusion
Logging is a very powerful and indispensable instrument in programming, especially if you need to control many factors, including application health. That’s why it is impossible to imagine the k8s cluster without logging architecture.
Of course, k8s provide basic features for this purpose, but when your nodes crash or rerun, you risk losing invaluable information. Stacks that help handle and store logs independently become part of the cluster as the base nodes, and this is where Fluentd and ES can help.
These tools not only allow users to control pod/node/namespace logs but also to control all clusters. Additionally, ES and Fluentd include strong visualization features like Kibana. ES and Fluentd make data understandable, and they have dynamic filters and updates. You can set your stack once and not worry about losing your data.
Check out more about other options at MetricFire's hosted Graphite pages. MetricFire specializes in monitoring time series, while Elasticsearch dominates the logs monitoring space. Try out our product with our free trial and monitor your time-series data, or book a demo and talk to us directly about the monitoring solution that works for you.

