
Table of Contents
- Introduction
- One Click Monitoring for Heroku Applications
- Installing from the Heroku CLI or UI
- What Happens After Installation
- Visualizing and Alerting Without Extra Setup
- Additional Heroku App Monitoring Features
- Why Ease of Installation Matters
- Conclusion
Great systems are not just built. They are monitored.
MetricFire runs Graphite and Grafana as a fully managed service for growing engineering teams, taking care of storage, scaling, and version updates so your team doesn't have to. Plans start at $19/month, billed per metric namespace rather than per host, and include engineer-staffed support. Integrations work natively with Heroku, AWS, Azure, and GCP, and data is stored with 3× redundancy in SOC2- and ISO:27001-certified data centres.
Introduction
Monitoring a Heroku application should not require manual infrastructure setup, custom agents, or weeks of configuration. Hosted Graphite by MetricFire is designed to work as a one click monitoring solution that integrates directly with your Heroku app, allowing you to start collecting and visualizing metrics almost immediately.
This article walks through what installing the Hosted Graphite Heroku add on actually does, how little effort is required to get started, and what kind of visibility you gain once it is enabled.
One Click Monitoring for Heroku Applications
Hosted Graphite is available directly through the Heroku Marketplace and can be added to an application in seconds. There is no need to deploy agents, modify dyno images, or manage credentials. Once provisioned, Hosted Graphite automatically begins consuming your application’s log stream and converting relevant data into structured time series metrics.
Because Heroku already emits router and runtime information through logs, this integration works with existing Heroku apps without requiring any code changes. As soon as the add on is enabled, metrics begin flowing into your Hosted Graphite account.
Installing from the Heroku CLI or UI
You can install the Hosted Graphite add on in whichever way fits your workflow:
- Heroku CLI: Provision the add on using a single command: heroku addons:create hostedgraphite -a <app-name>
- Heroku UI: Add Hosted Graphite from the Marketplace with a few clicks through the web UI
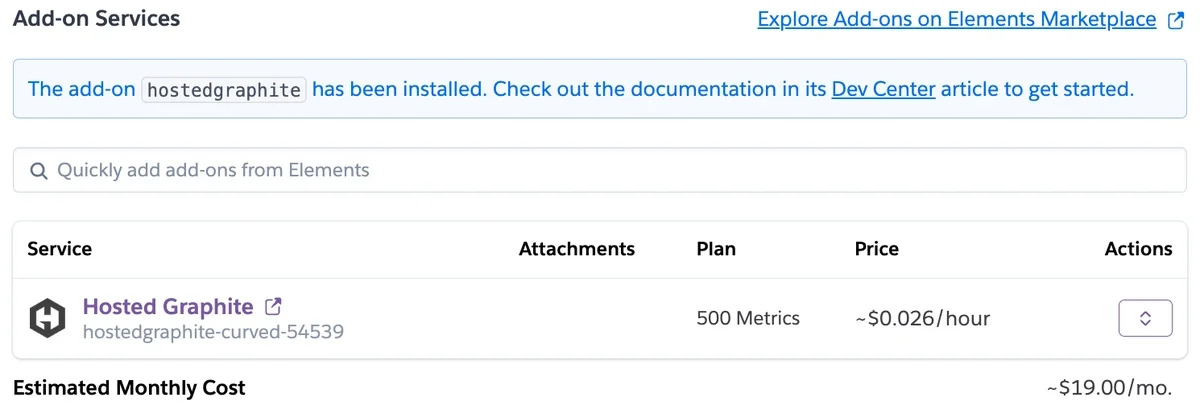
Both methods create and link a Hosted Graphite account automatically, with no additional configuration required. Hosted Graphite is designed to be affordable for real world Heroku applications, with many apps fitting comfortably on the Intro plan. At only $19 per month to start (for up to 500 stored metrics), it provides long term monitoring and alerting without the cost or complexity of running your own monitoring stack.
What Happens After Installation
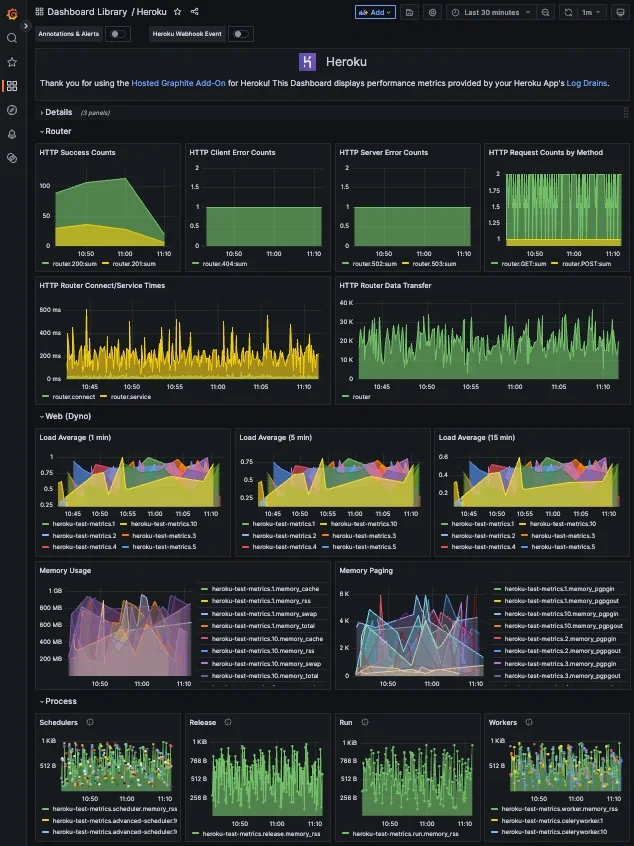
Once the add on is installed, Hosted Graphite begins processing your Heroku application data. Router logs and runtime metrics are parsed and converted into Graphite time series, making them easy to query and visualize. Out of the box, this includes:
- Router metrics such as response status code/method counts, and service times
- Dyno and process level CPU/memory metrics
- Metrics for supported Heroku add ons like Postgres, Redis, and Kafka
- Automatically created dashboards for common Heroku metrics
All metrics are stored with long term retention, allowing you to move beyond short lived platform charts and analyze trends over time.
Visualizing and Alerting Without Extra Setup
Hosted Graphite includes fully managed Grafana instances, with dashboards that are available immediately after installation. Pre built dashboards provide an overview of application health, while custom dashboards can be created to focus on specific services, endpoints, or performance questions.
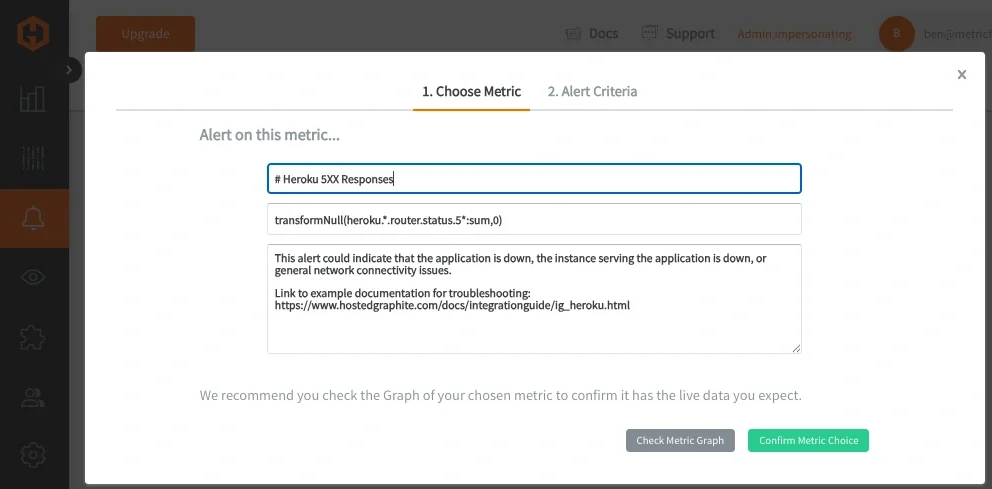
Graphite Alerting can be configured on any metric or metric set, allowing teams to detect issues such as rising error rates, increased latency, or missing data. Alerts can be delivered through common notification channels including email, Slack, PagerDuty, Microsoft Teams, and webhooks.
Additional Heroku App Monitoring Features
Hosted Graphite extends Heroku monitoring beyond basic platform metrics by supporting a range of Heroku specific features and integrations. Metrics are automatically collected for supported Heroku add ons such as Postgres, Redis, and Kafka, allowing database and queue performance to be viewed alongside application and router metrics in a single monitoring environment.
For deeper visibility into request behavior, Hosted Graphite offers an optional router path metrics feature that breaks router statistics down by individual URL paths. These metrics can be stored using either dot notation or underscore format, giving you control over metric cardinality and query flexibility. When enabled, path metrics make it possible to monitor latency, request volume, and error rates at the endpoint level rather than relying on aggregated router data.
To manage metric volume in applications with dynamic routes or multiple process types, Hosted Graphite includes router aggregation features. Path Aggregates allow metrics from routes containing variable identifiers to be combined into a single series, reducing cardinality while preserving meaningful performance data. Process Aggregates roll up metrics across multiple dyno instances of the same process type, and Host Aggregates group router metrics across related hostnames, helping keep dashboards and queries clean as applications scale.
Hosted Graphite also supports Heroku event annotations through a webhook integration. By forwarding Heroku events such as deploys, builds, configuration changes, and add on updates, teams can annotate dashboards with real time context, making it easier to correlate changes in metrics with activity in the Heroku environment.
Why Ease of Installation Matters
Hosted Graphite is designed to remove the operational overhead that usually comes with monitoring systems. When used as a Heroku add on, there is no need to provision servers, manage storage, deploy collectors, or tune databases. All of the complexity that typically comes with running Graphite such as aggregation, scaling, retention, backups, and alerting is handled automatically as part of the service.
Because Heroku already exposes application behavior through logs and runtime metrics, Hosted Graphite integrates cleanly by consuming an app’s existing log stream. Router logs, dyno metrics, and runtime data are parsed and converted into structured Graphite time series without requiring code changes or agents. This makes installation effectively a one click process rather than a multi step infrastructure project.
Once the add on is enabled, metrics are immediately available for querying, visualization, and alerting. There is no additional configuration required to start seeing data, and no need to think about how metrics are stored or retained. Hosted Graphite is built to handle large metric volumes and high cardinality data, which avoids common issues seen in self hosted Graphite setups such as query timeouts or storage limits as applications grow.
Beyond the initial setup, Hosted Graphite provides a wide range of supported APIs, integrations, and plugins that make it easy to extend monitoring as needed. Teams can send custom application metrics through the platform's REST API capabilities, integrate additional services, and build dashboards and alerts in a way that matches their workflows. When questions do come up, support is available to help with setup decisions, metric modeling, or alerting strategies, allowing teams to stay focused on running their applications rather than maintaining monitoring infrastructure.
Conclusion
Hosted Graphite makes it easy to move beyond surface level monitoring and gain a clearer, more actionable view of how your Heroku applications behave in production. With flexible metric handling, aggregation options, and long term retention, teams can adapt their monitoring as their apps evolve without adding operational overhead. The result is a monitoring setup that stays simple to manage while still providing the depth needed to support reliable, data driven decisions. Book a demo with us today and talk to one of our knowledgeable engineers that can give you a great run-down of the HG platform!


