
Table of Contents
Great systems are not just built. They are monitored.
MetricFire runs Graphite and Grafana as a fully managed service for growing engineering teams, taking care of storage, scaling, and version updates so your team doesn't have to. Plans start at $19/month, billed per metric namespace rather than per host, and include engineer-staffed support. Integrations work natively with Heroku, AWS, Azure, and GCP, and data is stored with 3× redundancy in SOC2- and ISO:27001-certified data centres.
Introduction
Monitoring doesn't always need to be complex. In this guide, we'll show you how to transform raw logs into usable metrics using a lightweight, open-source setup with no ELK stack and minimal effort. We'll use Loki, Python, and Telegraf to convert logs into Graphite metrics you can easily monitor or alert on. This is ideal for system administrators, DevOps beginners, or anyone interested in building more innovative monitoring pipelines from scratch. If you don't already have a Hosed Graphite account with MetricFire, sign up for a free 14-day trial HERE.
Key Takeaways
-
Metrics from Logs: Turning logs into metrics allows for easier trend analysis, alerting, and visualization, which bridges the gap between detailed log data and actionable insights.
-
Lightweight Stack: Using open-source tools like Loki, Python, and Telegraf avoids the complexity and resource demands of larger log management platforms like the ELK stack.
-
Customizable Parsing: A Python script gives you complete control over how logs are parsed and which metrics are extracted, and is perfect for adapting to unique operational requirements.
-
Telegraf as a Bridge: Telegraf simplifies the process by executing your custom script and forwarding the resulting metrics directly to Graphite (or any other supported output).
-
Better Observability: Combining logs and metrics improves system observability, enabling earlier detection of anomalies and faster incident response.
-
Cost-Efficient Monitoring: This setup is ideal for teams looking to expand observability without significantly increasing costs or tool sprawl.
Tools Overview
-
Loki: A log database from Grafana Labs that's super lightweight compared to Elasticsearch.
-
Python: We'll write a small script to parse logs into metrics.
-
Telegraf: A metrics agent that will run our script and forward metrics to a Hosted Graphite account.
Follow the examples below (for Linux) to create Graphite metrics from your system logs. We're aware that this setup has several moving parts, so check out Part 2 of our 'logs to metrics' series, where we detail how to accomplish this with a slightly less complex setup - by using Grok with Telegraf.
Install and Configure Loki
Loki is a log-structured database built by Grafana Labs. Think of it like Prometheus for logs, as it indexes labels instead of raw log content, making it fast and efficient. In this setup, we’ll run Loki locally, store logs on disk, and query them over HTTP using a simple Python script. No Promtail, no Elasticsearch, and no cloud buckets needed!
sudo wget https://github.com/grafana/loki/releases/download/v2.9.4/loki-linux-amd64.zip -O /usr/local/bin/loki.zip

cd /usr/local/bin
sudo unzip loki.zip
sudo mv loki-linux-amd64 loki
sudo chmod +x loki
Create a Loki config file at /etc/loki/loki-config.yaml with basic settings:
auth_enabled: false

server:
  http_listen_port: 3100

ingester:
  lifecycler:
    ring:
      kvstore:
        store: inmemory
      replication_factor: 1

schema_config:
  configs:
    - from: 2024-01-01
      store: boltdb-shipper
      object_store: filesystem
      schema: v13
      index:
        prefix: index_
        period: 24h

storage_config:
  boltdb_shipper:
    active_index_directory: /tmp/loki/index
    cache_location: /tmp/loki/cache
    cache_ttl: 24h
  filesystem:
    directory: /tmp/loki/chunks

limits_config:
  max_entries_limit_per_query: 5000

table_manager:
  retention_deletes_enabled: true
  retention_period: 24h

compactor:
  working_directory: /tmp/loki/compactor
Create the required data directories and assign root permissions:
sudo mkdir -p /tmp/loki/index
sudo mkdir -p /tmp/loki/cache
sudo mkdir -p /tmp/loki/chunks
sudo mkdir -p /tmp/loki/compactor

sudo chown -R root:root /tmp/loki
Run Loki manually, to listen on localhost:3100
sudo /usr/local/bin/loki -config.file=/etc/loki/loki-config.yaml
Create a Simple Python Parser
This Python script reads the last 500 lines of /var/log/syslog and counts the frequency of common system events, such as successful or failed SSH logins, sudo command usage, and cron job executions. It outputs these counts as Graphite-formatted metrics, which Telegraf can forward to your Hosted Graphite account. This provides a lightweight method for tracking key system activities (such as login attempts or job schedules) without requiring a comprehensive logging stack.
Just create a new Python file at: /etc/telegraf/parse_loki_metrics.py
#!/usr/bin/env python3

import time
import re
from collections import deque

LOG_PATH = "/var/log/syslog"

# Patterns and counters for most common log events
patterns = {
    "logs.sshd.success": r"sshd.*Accepted password",
    "logs.sshd.failure": r"sshd.*Failed password",
    "logs.sudo.command": r"sudo: .*COMMAND=",
    "logs.cron.job": r"CRON\[.*\]:"
}

metrics = {key: 0 for key in patterns}

try:
    with open(LOG_PATH, "r") as f:
        recent_lines = deque(f, maxlen=500)
        for line in recent_lines:
            for metric, pattern in patterns.items():
                if re.search(pattern, line):
                    metrics[metric] += 1

    ts = int(time.time())
    for key, val in metrics.items():
        print(f"{key} {val} {ts}")

except Exception as e:
    print(f"logs.script_error 1 {int(time.time())}  # error: {e}")
Make the script executable:
sudo chmod +x /etc/telegraf/parse_loki_metrics.py
Configure Telegraf to Run the Script
If you don't already have an instance of Telegraf running in your server, install our HG-CLI tool to quickly and easily get Telegraf up and running:
curl -s "https://www.hostedgraphite.com/scripts/hg-cli/installer/" | sudo sh
Now, just open your Telegraf configuration file at: /etc/telegraf/telegraf.conf and add the following section:
[[inputs.exec]]
  commands = ["/etc/telegraf/parse_loki_metrics.py"]
  timeout = "15s"
  data_format = "graphite"
  name_prefix = "syslog-metrics."
If your syslog can only be accessed with sudo permissions, you may need to update the Telegraf 'command' line to something like this:
commands = ["/bin/bash -c '/usr/bin/python3 /etc/telegraf/parse_loki_metrics.py'"]
Once you restart the Telegraf service, the Exec Input Plugin will execute your Python script, read the output, and forward the data to your Hosted Graphite account, it's that easy!
telegraf --config /etc/telegraf/telegraf.conf
Visualize Your Metrics
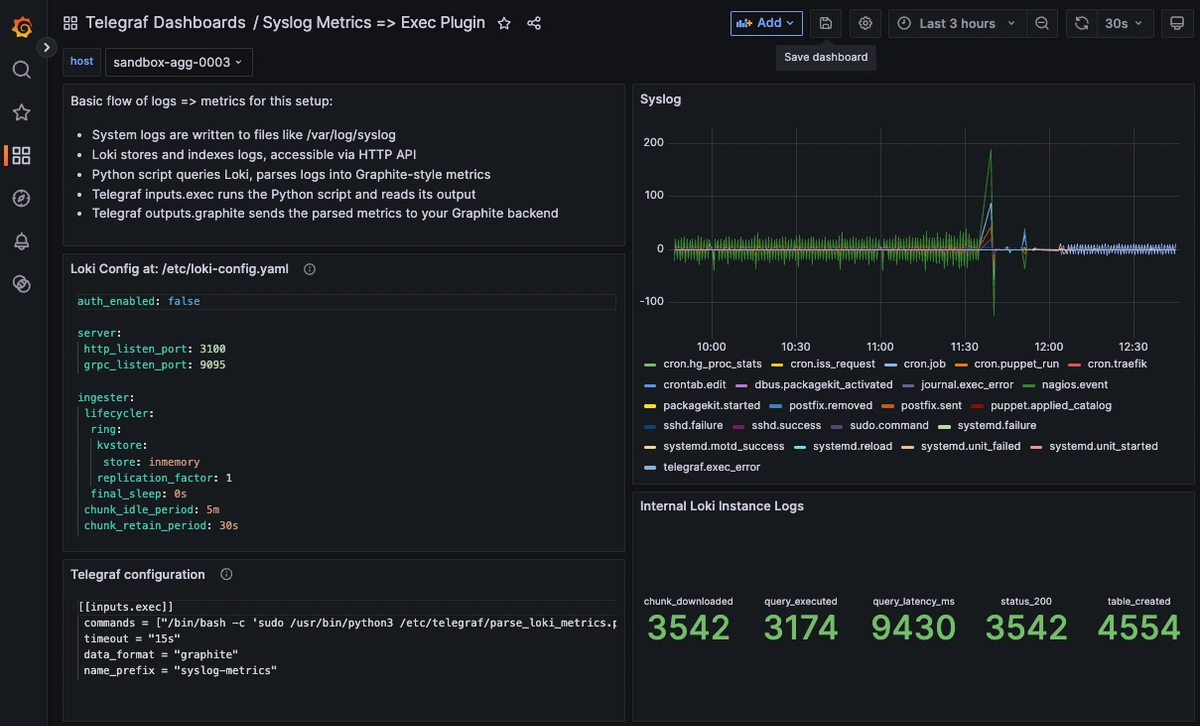
Once Loki and Telegraf are both running in your server, metrics will be forwarded to your Hosted Graphite account and can be located in the Metrics Search UI (with the telegraf.syslog-metrics.* prefix).
See our Dashboard docs on how to use these metrics to create visualizations in our Hosted Grafana, here's an example of syslog and Loki performance logs as metrics:
Benefits of This Approach
-
Lightweight: Avoids the overhead of more complex stacks like ELK
-
Customizable: Tailor the Python parser to extract metrics most relevant to your needs.
-
Scalable: Suitable for both small setups and larger infrastructures.
Conclusion
By completing this setup, you've built a powerful pipeline that transforms raw system logs into structured, real-time metrics, all using lightweight, open-source tools. Instead of sifting through endless log lines manually, you can now monitor key activities like SSH logins, cron jobs, and system events directly from your Graphite dashboards. This gives you instant visibility into system health without the complexity (or cost) of a full ELK stack.
In a DevOps role, having log observability isn't just nice to have; it’s crucial. Monitoring logs as metrics helps you spot failures more quickly, detect suspicious activity earlier, and automate your incident response. It empowers you to move from reactive troubleshooting to proactive system management. Best of all, this approach is lightweight enough to scale from a single server to an entire fleet without breaking your infrastructure budget.
Want to learn more? Reach out to us today and start a conversation. Happy monitoring!

