
Table of Contents
Great systems are not just built. They are monitored.
MetricFire runs Graphite and Grafana as a fully managed service for growing engineering teams, taking care of storage, scaling, and version updates so your team doesn't have to. Plans start at $19/month, billed per metric namespace rather than per host, and include engineer-staffed support. Integrations work natively with Heroku, AWS, Azure, and GCP, and data is stored with 3× redundancy in SOC2- and ISO:27001-certified data centres.

Introduction
One of the major advantages of using Kubernetes for container orchestration is that it makes it really easy to scale our application horizontally and account for increased load. Natively, horizontal pod autoscalers can scale the deployment based on CPU and Memory usage but in more complex scenarios we would want to account for other metrics before making scaling decisions.
Enter Prometheus Adapter. Prometheus is the standard tool for monitoring deployed workloads and the Kubernetes cluster itself. Prometheus Adapter helps us to leverage the metrics collected by Prometheus and use them to make scaling decisions. These metrics are exposed by an API service and can be readily used by our Horizontal Pod Autoscaling object.
Key Takeaways
- Kubernetes offers easy horizontal scaling for applications, but it typically relies on CPU and Memory metrics. In more complex scenarios, additional metrics are needed to make scaling decisions.
- Prometheus Adapter is a tool that leverages metrics collected by Prometheus, the standard monitoring tool for Kubernetes. It allows you to use these metrics for making scaling decisions.
- The Prometheus Adapter is deployed as a service in a Kubernetes cluster, usually with a single replica for smaller clusters, but it can be scaled for larger clusters. Node Affinities and Pod-AntiAffinity properties can be used for distribution.
- The key metric for autoscaling is nginx_vts_server_requests_total, which will be used to determine whether to scale the Nginx deployment.
- A ConfigMap is used to specify which metrics the Prometheus Adapter should collect. It's recommended to fetch only the necessary metrics for efficient scaling.
Deployment
Architecture Overview
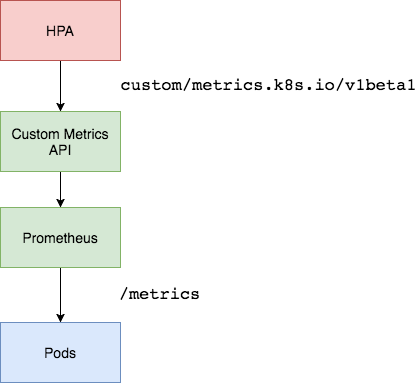
We will be using the Prometheus Adapter to pull custom metrics from our Prometheus installation and then let the horizontal pod autoscaler use it to scale the pods up or down. The Prometheus Adapter will be running as deployment exposed using a service in our cluster. Generally, a single replica of the Adapter is enough for small to medium sized clusters. However, if you have a very large cluster then you can run multiple replicas of Prometheus Adapter distributed across nodes using Node Affinities and Pod-AntiAffinity properties.
Prerequisites
- Running a Kubernetes cluster with at-least 3 nodes. We will be using a GKE cluster for this tutorial.
- Basic knowledge about horizontal pod autoscaling.
- Prometheus deployed in-cluster or accessible using an endpoint.
We will be using a Prometheus-Thanos Highly Available deployment. More about it can be read here.
Deploying the Sample Application
Let’s first deploy a sample app over which we will be testing our Prometheus metrics autoscaling. We can use the manifest below to do it:
apiVersion: v1
kind: Namespace
metadata:
  name: nginx
---
apiVersion: extensions/v1beta1
kind: Deployment
metadata:
  namespace: nginx
  name: nginx-deployment
spec:
  replicas: 1
  template:
    metadata:
      annotations:
        prometheus.io/path: "/status/format/prometheus"
        prometheus.io/scrape: "true"
        prometheus.io/port: "80"
      labels:
        app: nginx-server
    spec:
      affinity:
        podAntiAffinity:
          preferredDuringSchedulingIgnoredDuringExecution:
          - weight: 100
            podAffinityTerm:
              labelSelector:
                matchExpressions:
                - key: app
                  operator: In
                  values:
                  - nginx-server
              topologyKey: kubernetes.io/hostname
      containers:
      - name: nginx-demo
        image: vaibhavthakur/nginx-vts:1.0
        imagePullPolicy: Always
        resources:
          limits:
            cpu: 2500m
          requests:
            cpu: 2000m
        ports:
        - containerPort: 80
          name: http
---
apiVersion: v1
kind: Service
metadata:
  namespace: nginx
  name: nginx-service
spec:
  ports:
  - port: 80
    targetPort: 80
    name: http
  selector:
    app: nginx-server
  type: LoadBalancer
This will create a namespace named nginx and deploy a sample nginx application in it. The application can be accessed using the service and also exposes nginx vts metrics at the endpoint /status/format/prometheus over port 80. For the sake of our setup we have created a dns entry for the ExternalIP which maps to nginx.gotham.com.
root$ kubectl get deploy
NAME               READY   UP-TO-DATE   AVAILABLE   AGE
nginx-deployment   1/1     1            1           43d

root$ kubectl get pods
NAME                                READY   STATUS    RESTARTS   AGE
nginx-deployment-65d8df7488-c578v   1/1     Running   0          9h

root$ kubectl get svc
NAME            TYPE        CLUSTER-IP      EXTERNAL-IP   PORT(S)   AGE
nginx-service   ClusterIP   10.63.253.154   35.232.67.34      80/TCP    43d

root$ kubectl describe deploy nginx-deployment
Name:                   nginx-deployment
Namespace:              nginx
CreationTimestamp:      Tue, 08 Oct 2019 11:47:36 -0700
Labels:                 app=nginx-server
Annotations:            deployment.kubernetes.io/revision: 1
                        kubectl.kubernetes.io/last-applied-configuration:
                          {"apiVersion":"extensions/v1beta1","kind":"Deployment","metadata":{"annotations":{},"name":"nginx-deployment","namespace":"nginx"},"spec":...
Selector:               app=nginx-server
Replicas:               1 desired | 1 updated | 1 total | 1 available | 0 unavailable
StrategyType:           RollingUpdate
MinReadySeconds:        0
RollingUpdateStrategy:  1 max unavailable, 1 max surge
Pod Template:
  Labels:       app=nginx-server
  Annotations:  prometheus.io/path: /status/format/prometheus
                prometheus.io/port: 80
                prometheus.io/scrape: true
  Containers:
   nginx-demo:
    Image:      vaibhavthakur/nginx-vts:v1.0
    Port:       80/TCP
    Host Port:  0/TCP
    Limits:
      cpu:  250m
    Requests:
      cpu:        200m
    Environment:  <none>
    Mounts:       <none>
  Volumes:        <none>
Conditions:
  Type           Status  Reason
  ----           ------  ------
  Available      True    MinimumReplicasAvailable
OldReplicaSets:  <none>
NewReplicaSet:   nginx-deployment-65d8df7488 (1/1 replicas created)
Events:          <none>


root$ curl nginx.gotham.com
<!DOCTYPE html>
<html>
<head>
<title>Welcome to nginx!</title>
<style>
    body {
        width: 35em;
        margin: 0 auto;
        font-family: Tahoma, Verdana, Arial, sans-serif;
    }
</style>
</head>
<body>
<h1>Welcome to nginx!</h1>
<p>If you see this page, the nginx web server is successfully installed and
working. Further configuration is required.</p>

<p>For online documentation and support please refer to
<a href="http://nginx.org/">nginx.org</a>.<br/>
Commercial support is available at
<a href="http://nginx.com/">nginx.com</a>.</p>

<p><em>Thank you for using nginx.</em></p>
</body>
</html>
These are all the metrics currently exposed by the application:
$ curl nginx.gotham.com/status/format/prometheus
# HELP nginx_vts_info Nginx info
# TYPE nginx_vts_info gauge
nginx_vts_info{hostname="nginx-deployment-65d8df7488-c578v",version="1.13.12"} 1
# HELP nginx_vts_start_time_seconds Nginx start time
# TYPE nginx_vts_start_time_seconds gauge
nginx_vts_start_time_seconds 1574283147.043
# HELP nginx_vts_main_connections Nginx connections
# TYPE nginx_vts_main_connections gauge
nginx_vts_main_connections{status="accepted"} 215
nginx_vts_main_connections{status="active"} 4
nginx_vts_main_connections{status="handled"} 215
nginx_vts_main_connections{status="reading"} 0
nginx_vts_main_connections{status="requests"} 15577
nginx_vts_main_connections{status="waiting"} 3
nginx_vts_main_connections{status="writing"} 1
# HELP nginx_vts_main_shm_usage_bytes Shared memory [ngx_http_vhost_traffic_status] info
# TYPE nginx_vts_main_shm_usage_bytes gauge
nginx_vts_main_shm_usage_bytes{shared="max_size"} 1048575
nginx_vts_main_shm_usage_bytes{shared="used_size"} 3510
nginx_vts_main_shm_usage_bytes{shared="used_node"} 1
# HELP nginx_vts_server_bytes_total The request/response bytes
# TYPE nginx_vts_server_bytes_total counter
# HELP nginx_vts_server_requests_total The requests counter
# TYPE nginx_vts_server_requests_total counter
# HELP nginx_vts_server_request_seconds_total The request processing time in seconds
# TYPE nginx_vts_server_request_seconds_total counter
# HELP nginx_vts_server_request_seconds The average of request processing times in seconds
# TYPE nginx_vts_server_request_seconds gauge
# HELP nginx_vts_server_request_duration_seconds The histogram of request processing time
# TYPE nginx_vts_server_request_duration_seconds histogram
# HELP nginx_vts_server_cache_total The requests cache counter
# TYPE nginx_vts_server_cache_total counter
nginx_vts_server_bytes_total{host="_",direction="in"} 3303449
nginx_vts_server_bytes_total{host="_",direction="out"} 61641572
nginx_vts_server_requests_total{host="_",code="1xx"} 0
nginx_vts_server_requests_total{host="_",code="2xx"} 15574
nginx_vts_server_requests_total{host="_",code="3xx"} 0
nginx_vts_server_requests_total{host="_",code="4xx"} 2
nginx_vts_server_requests_total{host="_",code="5xx"} 0
nginx_vts_server_requests_total{host="_",code="total"} 15576
nginx_vts_server_request_seconds_total{host="_"} 0.000
nginx_vts_server_request_seconds{host="_"} 0.000
nginx_vts_server_cache_total{host="_",status="miss"} 0
nginx_vts_server_cache_total{host="_",status="bypass"} 0
nginx_vts_server_cache_total{host="_",status="expired"} 0
nginx_vts_server_cache_total{host="_",status="stale"} 0
nginx_vts_server_cache_total{host="_",status="updating"} 0
nginx_vts_server_cache_total{host="_",status="revalidated"} 0
nginx_vts_server_cache_total{host="_",status="hit"} 0
nginx_vts_server_cache_total{host="_",status="scarce"} 0
nginx_vts_server_bytes_total{host="*",direction="in"} 3303449
nginx_vts_server_bytes_total{host="*",direction="out"} 61641572
nginx_vts_server_requests_total{host="*",code="1xx"} 0
nginx_vts_server_requests_total{host="*",code="2xx"} 15574
nginx_vts_server_requests_total{host="*",code="3xx"} 0
nginx_vts_server_requests_total{host="*",code="4xx"} 2
nginx_vts_server_requests_total{host="*",code="5xx"} 0
nginx_vts_server_requests_total{host="*",code="total"} 15576
nginx_vts_server_request_seconds_total{host="*"} 0.000
nginx_vts_server_request_seconds{host="*"} 0.000
nginx_vts_server_cache_total{host="*",status="miss"} 0
nginx_vts_server_cache_total{host="*",status="bypass"} 0
nginx_vts_server_cache_total{host="*",status="expired"} 0
nginx_vts_server_cache_total{host="*",status="stale"} 0
nginx_vts_server_cache_total{host="*",status="updating"} 0
nginx_vts_server_cache_total{host="*",status="revalidated"} 0
nginx_vts_server_cache_total{host="*",status="hit"} 0
nginx_vts_server_cache_total{host="*",status="scarce"} 0
Among these we are particularly interested in nginx_vts_server_requests_total. We will be using the value of this metric to determine whether or not to scale our nginx deployment.
Create SSL Certs and the Kubernetes Secret for Prometheus Adapter
We can use the Makefile below to generate openssl certs and corresponding Kubernetes secret:
# Makefile for generating TLS certs for the Prometheus custom metrics API adapter

SHELL=bash
UNAME := $(shell uname)
PURPOSE:=metrics
SERVICE_NAME:=custom-metrics-apiserver
ALT_NAMES:="custom-metrics-apiserver.monitoring","custom-metrics-apiserver.monitoring.svc"
SECRET_FILE:=custom-metrics-api/cm-adapter-serving-certs.yaml

certs: gensecret rmcerts

.PHONY: gencerts
gencerts:
	@echo Generating TLS certs
	@docker pull cfssl/cfssl
	@mkdir -p output
	@touch output/apiserver.pem
	@touch output/apiserver-key.pem
	@openssl req -x509 -sha256 -new -nodes -days 365 -newkey rsa:2048 -keyout $(PURPOSE)-ca.key -out $(PURPOSE)-ca.crt -subj "/CN=ca"
	@echo '{"signing":{"default":{"expiry":"43800h","usages":["signing","key encipherment","'$(PURPOSE)'"]}}}' > "$(PURPOSE)-ca-config.json"
	@echo '{"CN":"'$(SERVICE_NAME)'","hosts":[$(ALT_NAMES)],"key":{"algo":"rsa","size":2048}}' | docker run  -v ${HOME}:${HOME} -v ${PWD}/metrics-ca.key:/go/src/github.com/cloudflare/cfssl/metrics-ca.key -v ${PWD}/metrics-ca.crt:/go/src/github.com/cloudflare/cfssl/metrics-ca.crt -v ${PWD}/metrics-ca-config.json:/go/src/github.com/cloudflare/cfssl/metrics-ca-config.json -i cfssl/cfssl gencert -ca=metrics-ca.crt -ca-key=metrics-ca.key -config=metrics-ca-config.json - | docker run --entrypoint=cfssljson -v ${HOME}:${HOME} -v ${PWD}/output:/go/src/github.com/cloudflare/cfssl/output -i cfssl/cfssl -bare output/apiserver

.PHONY: gensecret
gensecret: gencerts
	@echo Generating $(SECRET_FILE)
	@echo "apiVersion: v1" > $(SECRET_FILE)
	@echo "kind: Secret" >> $(SECRET_FILE)
	@echo "metadata:" >> $(SECRET_FILE)
	@echo " name: cm-adapter-serving-certs" >> $(SECRET_FILE)
	@echo " namespace: monitoring" >> $(SECRET_FILE)
	@echo "data:" >> $(SECRET_FILE)
ifeq ($(UNAME), Darwin)
	@echo " serving.crt: $$(cat output/apiserver.pem | base64)" >> $(SECRET_FILE)
	@echo " serving.key: $$(cat output/apiserver-key.pem | base64)" >> $(SECRET_FILE)
endif
ifeq ($(UNAME), Linux)
	@echo " serving.crt: $$(cat output/apiserver.pem | base64 -w 0)" >> $(SECRET_FILE)
	@echo " serving.key: $$(cat output/apiserver-key.pem | base64 -w 0)" >> $(SECRET_FILE)
endif

.PHONY: rmcerts
rmcerts:
	@rm -f apiserver-key.pem apiserver.csr apiserver.pem
	@rm -f metrics-ca-config.json metrics-ca.crt metrics-ca.key

.PHONY: deploy
deploy:
	kubectl create -f ./custom-metrics-api
Once you have created the make file, just run the following command:
make certs
and it will create ssl certificates and the corresponding Kubernetes secret for you. Make sure that monitoring namespace exists before you create the secret. This secret will be using the Prometheus Adapter which we will deploy next.
Create Prometheus Adapter ConfigMap
Use the manifest below to create the Prometheus Adapter configmap:
apiVersion: v1
kind: ConfigMap
metadata:
  name: adapter-config
  namespace: monitoring
data:
  config.yaml: |
    rules:
    - seriesQuery: 'nginx_vts_server_requests_total'
      resources:
        overrides:
          kubernetes_namespace:
            resource: namespace
          kubernetes_pod_name:
            resource: pod
      name:
        matches: "^(.*)_total"
        as: "${1}_per_second"
      metricsQuery: (sum(rate(<<.Series>>{<<.LabelMatchers>>}[1m])) by (<<.GroupBy>>))
This config map only specifies a single metric. However, we can always add more metrics. You can refer to this link to add more metrics. It is highly recommended to fetch only those metrics which we need for the horizontal pod autoscaler. This helps in debugging and also these add-ons generate very verbose logs which get ingested by our logging backend. Fetching metrics which are not needed will not only load the service but also spam the logging backend with un-necessary logs. If you want to learn in detail about the config map, please read here.
Create Prometheus Adapter Deployment
Use the following manifest to deploy Prometheus Adapter:
apiVersion: apps/v1
kind: Deployment
metadata:
  labels:
    app: custom-metrics-apiserver
  name: custom-metrics-apiserver
  namespace: monitoring
spec:
  replicas: 1
  selector:
    matchLabels:
      app: custom-metrics-apiserver
  template:
    metadata:
      labels:
        app: custom-metrics-apiserver
      name: custom-metrics-apiserver
    spec:
      serviceAccountName: monitoring
      containers:
      - name: custom-metrics-apiserver
        image: quay.io/coreos/k8s-prometheus-adapter-amd64:v0.4.1
        args:
        - /adapter
        - --secure-port=6443
        - --tls-cert-file=/var/run/serving-cert/serving.crt
        - --tls-private-key-file=/var/run/serving-cert/serving.key
        - --logtostderr=true
        - --prometheus-url=http://thanos-querier.monitoring:9090/
        - --metrics-relist-interval=30s
        - --v=10
        - --config=/etc/adapter/config.yaml
        ports:
        - containerPort: 6443
        volumeMounts:
        - mountPath: /var/run/serving-cert
          name: volume-serving-cert
          readOnly: true
        - mountPath: /etc/adapter/
          name: config
          readOnly: true
      volumes:
      - name: volume-serving-cert
        secret:
          secretName: cm-adapter-serving-certs
      - name: config
        configMap:
          name: adapter-config
This will create our deployment which will spawn the Prometheus Adapter pod to pull metrics from Prometheus. It should be noted that we have set the argument --prometheus-url=http://thanos-querier.monitoring:9090/. This is because we have deployed a Thanos backed Prometheus cluster in the monitoring namespace in the same Kubernetes cluster as Prometheus Adapter. You can change this argument to point to your Prometheus deployment.
If you notice the logs for this container, you can see that it is fetching the metric defined in the config file:
I1122 00:26:53.228394       1 api.go:74] GET http://thanos-querier.monitoring:9090/api/v1/series?match%5B%5D=nginx_vts_server_requests_total&start=1574381213.217 200 OK
I1122 00:26:53.234234       1 api.go:93] Response Body: {"status":"success","data":[{"__name__":"nginx_vts_server_requests_
total","app":"nginx-server","cluster":"prometheus-ha","code":"1xx","host":"*","instance":"10.60.64.39:80","job":"kubernetes
-pods","kubernetes_namespace":"nginx","kubernetes_pod_name":"nginx-deployment-65d8df7488-sbp95","pod_template_hash":"65d8df
7488"},{"__name__":"nginx_vts_server_requests_total","app":"nginx-server","cluster":"prometheus-ha","code":"1xx","host":"*"
,"instance":"10.60.64.8:80","job":"kubernetes-pods","kubernetes_namespace":"nginx","kubernetes_pod_name":"nginx-deployment-
65d8df7488-mwzxg","pod_template_hash":"65d8df7488"},{"__name__":"nginx_vts_server_requests_total","app":"nginx-server",
"cluster":"prometheus-ha","code":"1xx","host":"_","instance":"10.60.64.39:80","job":"kubernetes-pods","kubernetes_namespace
":"nginx","kubernetes_pod_name":"nginx-deployment-65d8df7488-sbp95","pod_template_hash":"65d8df7488"},{"__name__":"nginx_
vts_server_requests_total","app":"nginx-server","cluster":"prometheus-ha","code":"1xx","host":"_","instance":"10.60.64.8:80
","job":"kubernetes-pods","kubernetes_namespace":"nginx","kubernetes_pod_name":"nginx-deployment-65d8df7488-mwzxg",
"pod_template_hash":"65d8df7488"},{"__name__":"nginx_vts_server_requests_total","app":"nginx-server","cluster":"prometheus-
ha","code":"2xx","host":"*","instance":"10.60.64.39:80","job":"kubernetes-pods","kubernetes_namespace":"nginx","kubernetes_
pod_name":"nginx-deployment-65d8df7488-sbp95","pod_template_hash":"65d8df7488"},{"__name__":"nginx_vts_server_requests_
total","app":"nginx-server","cluster":"prometheus-ha","code":"2xx","host":"*","instance":"10.60.64.8:80","job":"kubernetes-
pods","kubernetes_namespace":"nginx","kubernetes_pod_name":"nginx-deployment-65d8df7488-mwzxg","pod_template_hash":
"65d8df7488"},{"__name__":"nginx_vts_server_requests_total","app":"nginx-server","cluster":"prometheus-ha","code":"2xx",
"host":"_","instance":"10.60.64.39:80","job":"kubernetes-pods","kubernetes_namespace":"nginx","kubernetes_pod_name":
"nginx-deployment-65d8df7488-sbp95","pod_template_hash":"65d8df7488"},{"__name__":"nginx_vts_server_requests_total",
"app":"nginx-server","cluster":"prometheus-ha","code":"2xx","host":"_","instance":"10.60.64.8:80","job":"kubernetes-pods"
,"kubernetes_namespace":"nginx","kubernetes_pod_name":"nginx-deployment-65d8df7488-mwzxg","pod_template_hash":
"65d8df7488"},{"__name__":"nginx_vts_server_requests_total","app":"nginx-server","cluster":"prometheus-ha","code":"3xx",
"host":"*","instance":"10.60.64.39:80","job":"kubernetes-pods","kubernetes_namespace":"nginx","kubernetes_pod_name":
"nginx-deployment-65d8df7488-sbp95","pod_template_hash":"65d8df7488"},{"__name__":"nginx_vts_server_requests_total",
"app":"nginx-server","cluster":"prometheus-ha","code":"3xx","host":"*","instance":"10.60.64.8:80","job":"kubernetes-pods"
,"kubernetes_namespace":"nginx","kubernetes_pod_name":"nginx-deployment-65d8df7488-mwzxg","pod_template_hash":
"65d8df7488"},{"__name__":"nginx_vts_server_requests_total","app":"nginx-server","cluster":"prometheus-ha","code":"3xx",
"host":"_","instance":"10.60.64.39:80","job":"kubernetes-pods","kubernetes_namespace":"nginx","kubernetes_pod_name":
"nginx-deployment-65d8df7488-sbp95","pod_template_hash":"65d8df7488"},{"__name__":"nginx_vts_server_requests_total",
"app":"nginx-server","cluster":"prometheus-ha","code":"3xx","host":"_","instance":"10.60.64.8:80","job":"kubernetes-pods"
,"kubernetes_namespace":"nginx","kubernetes_pod_name":"nginx-deployment-65d8df7488-mwzxg","pod_template_hash":
"65d8df7488"},{"__name__":"nginx_vts_server_requests_total","app":"nginx-server","cluster":"prometheus-ha","code":"4xx",
"host":"*","instance":"10.60.64.39:80","job":"kubernetes-pods","kubernetes_namespace":"nginx","kubernetes_pod_name":
"nginx-deployment-65d8df7488-sbp95","pod_template_hash":"65d8df7488"},{"__name__":"nginx_vts_server_requests_total",
"app":"nginx-server","cluster":"prometheus-ha","code":"4xx","host":"*","instance":"10.60.64.8:80","job":"kubernetes-pods"
,"kubernetes_namespace":"nginx","kubernetes_pod_name":"nginx-deployment-65d8df7488-mwzxg","pod_template_hash":
"65d8df7488"},{"__name__":"nginx_vts_server_requests_total","app":"nginx-server","cluster":"prometheus-ha","code":"4xx",
"host":"_","instance":"10.60.64.39:80","job":"kubernetes-pods","kubernetes_namespace":"nginx","kubernetes_pod_name":
"nginx-deployment-65d8df7488-sbp95","pod_template_hash":"65d8df7488"},{"__name__":"nginx_vts_server_requests_total",
"app":"nginx-server","cluster":"prometheus-ha","code":"4xx","host":"_","instance":"10.60.64.8:80","job":"kubernetes-pods"
,"kubernetes_namespace":"nginx","kubernetes_pod_name":"nginx-deployment-65d8df7488-mwzxg","pod_template_hash":
"65d8df7488"},{"__name__":"nginx_vts_server_requests_total","app":"nginx-server","cluster":"prometheus-ha","code":"5xx",
"host":"*","instance":"10.60.64.39:80","job":"kubernetes-pods","kubernetes_namespace":"nginx","kubernetes_pod_name":
"nginx-deployment-65d8df7488-sbp95","pod_template_hash":"65d8df7488"},{"__name__":"nginx_vts_server_requests_total",
"app":"nginx-server","cluster":"prometheus-ha","code":"5xx","host":"*","instance":"10.60.64.8:80","job":"kubernetes-pods"
,"kubernetes_namespace":"nginx","kubernetes_pod_name":"nginx-deployment-65d8df7488-mwzxg","pod_template_hash":
"65d8df7488"},{"__name__":"nginx_vts_server_requests_total","app":"nginx-server","cluster":"prometheus-ha","code":"5xx",
"host":"_","instance":"10.60.64.39:80","job":"kubernetes-pods","kubernetes_namespace":"nginx","kubernetes_pod_name":
"nginx-deployment-65d8df7488-sbp95","pod_template_hash":"65d8df7488"},{"__name__":"nginx_vts_server_requests_total",
"app":"nginx-server","cluster":"prometheus-ha","code":"5xx","host":"_","instance":"10.60.64.8:80","job":"kubernetes-pods"
,"kubernetes_namespace":"nginx","kubernetes_pod_name":"nginx-deployment-65d8df7488-mwzxg","pod_template_hash":
"65d8df7488"},{"__name__":"nginx_vts_server_requests_total","app":"nginx-server","cluster":"prometheus-ha","code":
"total","host":"*","instance":"10.60.64.39:80","job":"kubernetes-pods","kubernetes_namespace":"nginx","kubernetes_pod_
name":"nginx-deployment-65d8df7488-sbp95","pod_template_hash":"65d8df7488"},{"__name__":"nginx_vts_server_requests_total"
,"app":"nginx-server","cluster":"prometheus-ha","code":"total","host":"*","instance":"10.60.64.8:80","job":
"kubernetes-pods","kubernetes_namespace":"nginx","kubernetes_pod_name":"nginx-deployment-65d8df7488-mwzxg",
"pod_template_hash":"65d8df7488"},{"__name__":"nginx_vts_server_requests_total","app":"nginx-server","cluster":
"prometheus-ha","code":"total","host":"_","instance":"10.60.64.39:80","job":"kubernetes-pods","kubernetes_namespace":
"nginx","kubernetes_pod_name":"nginx-deployment-65d8df7488-sbp95","pod_template_hash":"65d8df7488"},{"__name__":
"nginx_vts_server_requests_total","app":"nginx-server","cluster":"prometheus-ha","code":"total","host":"_","instance":
"10.60.64.8:80","job":"kubernetes-pods","kubernetes_namespace":"nginx","kubernetes_pod_name":"nginx-deployment-
65d8df7488-mwzxg","pod_template_hash":"65d8df7488"}]}
Creating Prometheus Adapter API Service
The manifest below will create an API service so that our Prometheus Adapter is accessible by Kubernetes API and thus metrics can be fetched by our Horizontal Pod Autoscaler.
apiVersion: v1
kind: Service
metadata:
  name: custom-metrics-apiserver
  namespace: monitoring
spec:
  ports:
  - port: 443
    targetPort: 6443
  selector:
    app: custom-metrics-apiserver
---
apiVersion: apiregistration.k8s.io/v1beta1
kind: APIService
metadata:
  name: v1beta1.custom.metrics.k8s.io
spec:
  service:
    name: custom-metrics-apiserver
    namespace: monitoring
  group: custom.metrics.k8s.io
  version: v1beta1
  insecureSkipTLSVerify: true
  groupPriorityMinimum: 100
  versionPriority: 100
Testing the Setup
Let’s check all of the custom metrics that are available:
root$ kubectl get --raw "/apis/custom.metrics.k8s.io/v1beta1" | jq .

{
  "kind": "APIResourceList",
  "apiVersion": "v1",
  "groupVersion": "custom.metrics.k8s.io/v1beta1",
  "resources": [
    {
      "name": "pods/nginx_vts_server_requests_per_second",
      "singularName": "",
      "namespaced": true,
      "kind": "MetricValueList",
      "verbs": [
        "get"
      ]
    },
    {
      "name": "namespaces/nginx_vts_server_requests_per_second",
      "singularName": "",
      "namespaced": false,
      "kind": "MetricValueList",
      "verbs": [
        "get"
      ]
    }
  ]
}
We can see that nginx_vts_server_requests_per_second metric is available.
Now, let’s check the current value of this metric:
root$ kubectl get --raw "/apis/custom.metrics.k8s.io/v1beta1/namespaces/nginx/pods/*/nginx_vts_server_requests_per_second" | jq .

{
  "kind": "MetricValueList",
  "apiVersion": "custom.metrics.k8s.io/v1beta1",
  "metadata": {
    "selfLink": "/apis/custom.metrics.k8s.io/v1beta1/namespaces/nginx/pods/%2A/nginx_vts_server_requests_per_second"
  },
  "items": [
    {
      "describedObject": {
        "kind": "Pod",
        "namespace": "nginx",
        "name": "nginx-deployment-65d8df7488-v575j",
        "apiVersion": "/v1"
      },
      "metricName": "nginx_vts_server_requests_per_second",
      "timestamp": "2019-11-19T18:38:21Z",
      "value": "1236m"
    }
  ]
}
Create an HPA which will utilize these metrics. We can use the manifest below to do it:
apiVersion: autoscaling/v2beta1
kind: HorizontalPodAutoscaler
metadata:
  name: nginx-custom-hpa
  namespace: nginx
spec:
  scaleTargetRef:
    apiVersion: extensions/v1beta1
    kind: Deployment
    name: nginx-deployment
  minReplicas: 2
  maxReplicas: 10
  metrics:
  - type: Pods
    pods:
      metricName: nginx_vts_server_requests_per_second
      targetAverageValue: 4000m
Once you have applied this manifest, you can check the current status of HPA as follows:
root$ kubectl describe hpa
Name:               nginx-custom-hpa
Namespace:          nginx
Labels:             <none>
Annotations:        autoscaling.alpha.kubernetes.io/metrics:
                      [{"type":"Pods","pods":{"metricName":"nginx_vts_server_requests_per_second","targetAverageValue":"4"}}]
                    kubectl.kubernetes.io/last-applied-configuration:
                      {"apiVersion":"autoscaling/v2beta1","kind":"HorizontalPodAutoscaler","metadata":{"annotations":{},"name":"nginx-custom-hpa","namespace":"n...
CreationTimestamp:  Thu, 21 Nov 2019 11:11:05 -0800
Reference:          Deployment/nginx-deployment
Min replicas:       2
Max replicas:       10
Deployment pods:    0 current / 0 desired
Events:             <none>
Now, let's generate some load on our service. We will be using a utility called vegeta for this.
In a separate terminal run this following command:
echo "GET http://nginx.gotham.com/" | vegeta attack -rate=5 -duration=0 | vegeta report
If you simultaneously monitor the nginx pods and the horizontal pod autoscaler, you should see something like this:
root$ kubectl get -w pods
NAME                                READY   STATUS    RESTARTS   AGE
nginx-deployment-65d8df7488-mwzxg   1/1     Running   0          9h
nginx-deployment-65d8df7488-sbp95   1/1     Running   0          4m9s
NAME                                AGE
nginx-deployment-65d8df7488-pwjzm   0s
nginx-deployment-65d8df7488-pwjzm   0s
nginx-deployment-65d8df7488-pwjzm   0s
nginx-deployment-65d8df7488-pwjzm   2s
nginx-deployment-65d8df7488-pwjzm   4s
nginx-deployment-65d8df7488-jvbvp   0s
nginx-deployment-65d8df7488-jvbvp   0s
nginx-deployment-65d8df7488-jvbvp   1s
nginx-deployment-65d8df7488-jvbvp   4s
nginx-deployment-65d8df7488-jvbvp   7s
nginx-deployment-65d8df7488-skjkm   0s
nginx-deployment-65d8df7488-skjkm   0s
nginx-deployment-65d8df7488-jh5vw   0s
nginx-deployment-65d8df7488-skjkm   0s
nginx-deployment-65d8df7488-jh5vw   0s
nginx-deployment-65d8df7488-jh5vw   1s
nginx-deployment-65d8df7488-skjkm   2s
nginx-deployment-65d8df7488-jh5vw   2s
nginx-deployment-65d8df7488-skjkm   3s
nginx-deployment-65d8df7488-jh5vw   4s

root$ kubectl get hpa
NAME               REFERENCE                     TARGETS   MINPODS   MAXPODS   REPLICAS   AGE
nginx-custom-hpa   Deployment/nginx-deployment   5223m/4   2         10        3          5m5s
It can be clearly seen that the horizontal pod autoscaler scaled up our pods to meet the needs, and when we interrupt the vegeta command we can see the vegeta report. It clearly shows that all our requests were served by the application.
root$ echo "GET http://nginx.gotham.com/" | vegeta attack -rate=5 -duration=0 | vegeta report
^CRequests      [total, rate, throughput]  224, 5.02, 5.02
Duration      [total, attack, wait]      44.663806863s, 44.601823883s, 61.98298ms
Latencies     [mean, 50, 95, 99, max]    63.3879ms, 60.867241ms, 79.414139ms, 111.981619ms, 229.310088ms
Bytes In      [total, mean]              137088, 612.00
Bytes Out     [total, mean]              0, 0.00
Success       [ratio]                    100.00%
Status Codes  [code:count]               200:224
Error Set:
Conclusion
This set-up demonstrates how we can use Prometheus Adapter to autoscale deployments based on some custom metrics. For the sake of simplicity we have only fetched one metric from our Prometheus Server. However, the Adapter configmap can be extended to fetch some or all the available metrics and use them for autoscaling.
If the Prometheus installation is outside of our Kubernetes cluster, we just need to make sure that the query end-point is accessible from the cluster and update it in the Adapter deployment manifest. We can have complex scenarios where multiple metrics can be fetched and used in combination to make scaling decisions.
If you're interested in using Prometheus, but the setup and management of it would be too resource-consuming, book a demo and talk to us about how Hosted Prometheus can fit into your monitoring environment. You can also get right onto a free trial, and check it out now.
This article was written by our guest blogger Vaibhav Thakur. If you liked this article, check out his LinkedIn for more.


