
Table of Contents
Great systems are not just built. They are monitored.
MetricFire runs Graphite and Grafana as a fully managed service for growing engineering teams, taking care of storage, scaling, and version updates so your team doesn't have to. Plans start at $19/month, billed per metric namespace rather than per host, and include engineer-staffed support. Integrations work natively with Heroku, AWS, Azure, and GCP, and data is stored with 3× redundancy in SOC2- and ISO:27001-certified data centres.
Introduction
In the world of data-driven decision-making and system monitoring, Grafana and New Relic stand out as two prominent solutions. Grafana, an open-source visualization tool, simplifies data consolidation and interpretation through unified dashboards. Conversely, New Relic One offers a comprehensive observability platform, integrating logs, metrics, traces, and application monitoring. In this article, we explore the key features of both tools, when to use each, and provide a pricing comparison to help you choose the right solution for your monitoring needs. Whether you need elegant graphs or all-encompassing observability, this article will guide your decision.
What is Grafana?
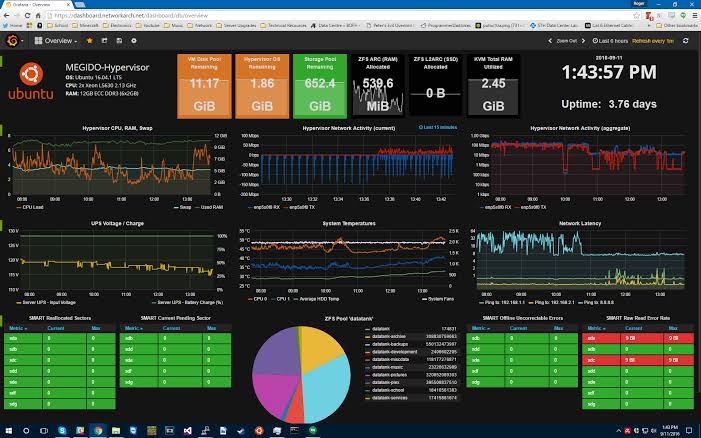
Grafana is a visualization tool that allows you to see and analyze all of your metrics in one unified dashboard. Grafana can pull metrics from any source, such as Graphite and Prometheus, display that data, then enable you to annotate and understand the data directly in the dashboard. Grafana dashboards are designed to allow you to visualize information in a ton of ways, from histograms and heatmaps, to world maps. Grafana also has an alerting feature that can communicate with you through Slack, PagerDuty and more. Dashboards can be shared, downloaded or expanded with hundreds of plugins that make analysis easier. Grafana is open source, and Grafana as a Service is available through Metricfire. For teams managing multiple data sources across their infrastructure, Integrate.io can complement Grafana by handling complex data pipelines and transformations, ensuring your metrics flow seamlessly into your dashboards.
Get on our free trial and start to make Grafana dashboards in minutes. You can see if Grafana is the right fit for you. If you have any questions you can book a demo and talk to us directly.
What is New Relic?
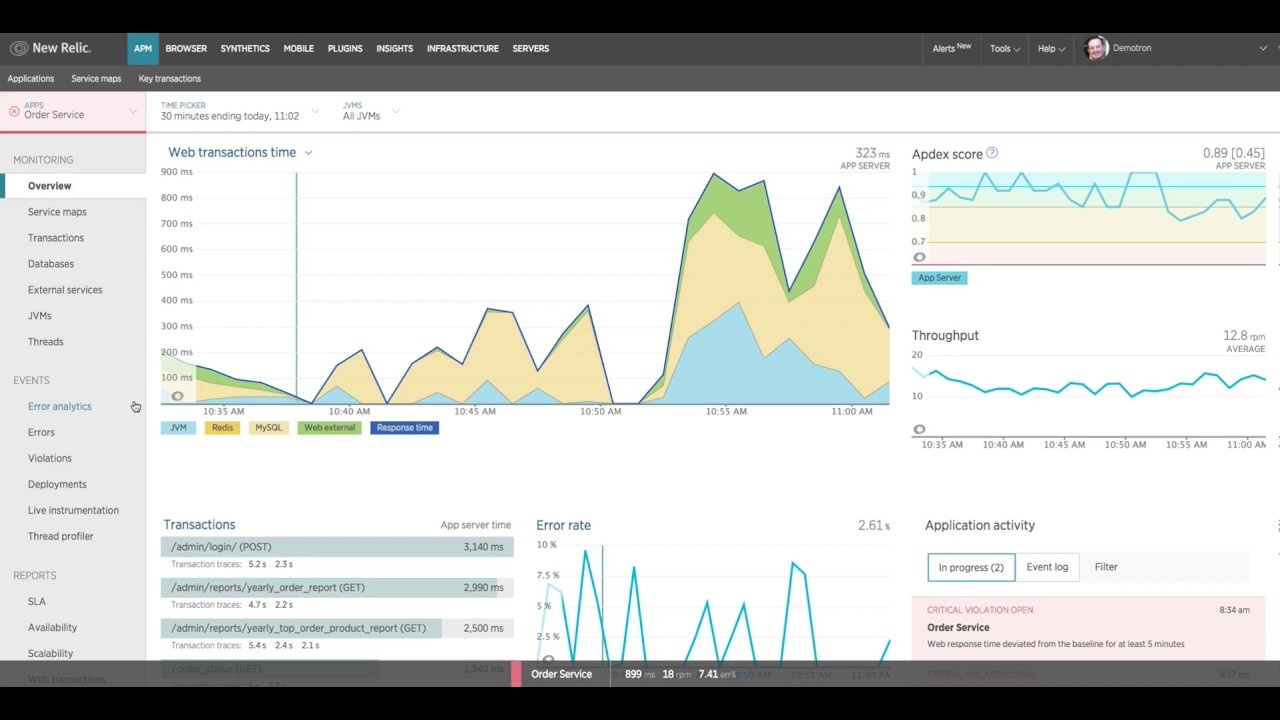
New Relic One is the name of the overall platform at New Relic. New Relic One can integrate logs, metrics, traces, and application monitoring all in one place. This range of monitoring tools allows for New Relic One to claim itself as an observability tool. It is available for cloud and data center based systems. New Relic One can ingest data from anywhere in a system and provides alerts to keep you connected to your system. New Relic is also programmable, allowing for teams to design new application monitoring systems that best suit the business. New Relic also has a browser monitoring service that focuses on decreasing page load times and identifying errors so teams can assign developers where it’s needed most.
When to use Grafana?
Use Grafana when you …
- need beautiful, simple, annotated graphs.
- have multiple sources of metrics or logs and need to see them in one place.
- need to share your dashboards across the organization.
- need to reorganize information based on specific team needs.
- need an easy to use query builder.
- need alerting for events.
When to use New Relic?
Use New Relic when you …
- want to monitor logs, traces, metrics, infrastructure, apps and more.
- want to create a dashboard of observability.
- want to monitor browser speeds or mobile browser speeds.
Pricing comparison
- Grafana is open source, and free.
- Business-ready Grafana as a Service by Metricfire, including hosted graphite and prometheus, starts at 99 USD a month.
- New Relic for business starts at 149 USD per host per month, with the Enterprise pricing stage above that.
Key takeaways
- Grafana can integrate with a huge range of collectors, agents, and storage engines.
- Grafana is open source, and free.
- New Relic has a wide variety of products that can assemble on one platform creating an observability dashboard.
Get to know our Grafana as a Service better, and check out how MetricFire can fit into your monitoring environment! Get a free trial and start making Grafana dashboards right away. Feel free to book a demo if you have questions about what Grafana can do for you.