
Table of Contents
Great systems are not just built. They are monitored.
MetricFire runs Graphite and Grafana as a fully managed service for growing engineering teams, taking care of storage, scaling, and version updates so your team doesn't have to. Plans start at $19/month, billed per metric namespace rather than per host, and include engineer-staffed support. Integrations work natively with Heroku, AWS, Azure, and GCP, and data is stored with 3× redundancy in SOC2- and ISO:27001-certified data centres.

What is Apache Hadoop?
Apache Hadoop is an open-source software framework that can process and distribute large data sets across multiple clusters of computers. Hadoop was designed to break down data management workloads over a cluster of computers. It divides data processing between multiple nodes, which manages the datasets more efficiently than a single device could.
Key Takeaways
- Apache Hadoop is an open-source software framework designed to process and distribute large data sets across multiple clusters of computers.
- Hadoop clusters are resilient to system failures and designed to handle failures gracefully.
- Monitoring Hadoop focuses on service-level metrics rather than individual host-level indicators.
- ZooKeeper maintains configuration information and synchronization in Hadoop clusters.
- You can collect metrics using various methods, including JMX, HTTP API, and 4-letter word commands for ZooKeeper.
Three Best Monitoring Tools for Hadoop
Here is our list of the best Hadoop monitoring tools:
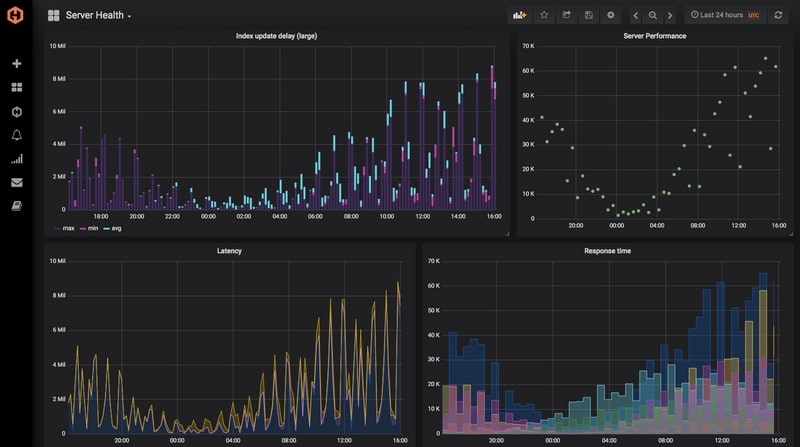
1. Prometheus – Cloud monitoring software with a customizable Hadoop dashboard, integrations, alerts, and many more. It keeps the data long-term, with 3x redundancy, so that we can focus on applying the data rather than maintaining a database. Get updates and plugins without lifting a finger, as they keep our Dashboards stack up-to-date. It is easy to use with no extensive configuration needed to thoroughly monitor your technology stack.
2. LogicMonitor – Infrastructure monitoring software with a HadoopPackage, REST API, alerts, reports, dashboards, and more. LogicMonitor finds, queries, and begins monitoring virtually any datacenter resource. If you have a resource in your datacenter that is not immediately found and monitored, LogicMonitor’s professional services will investigate how to add it.

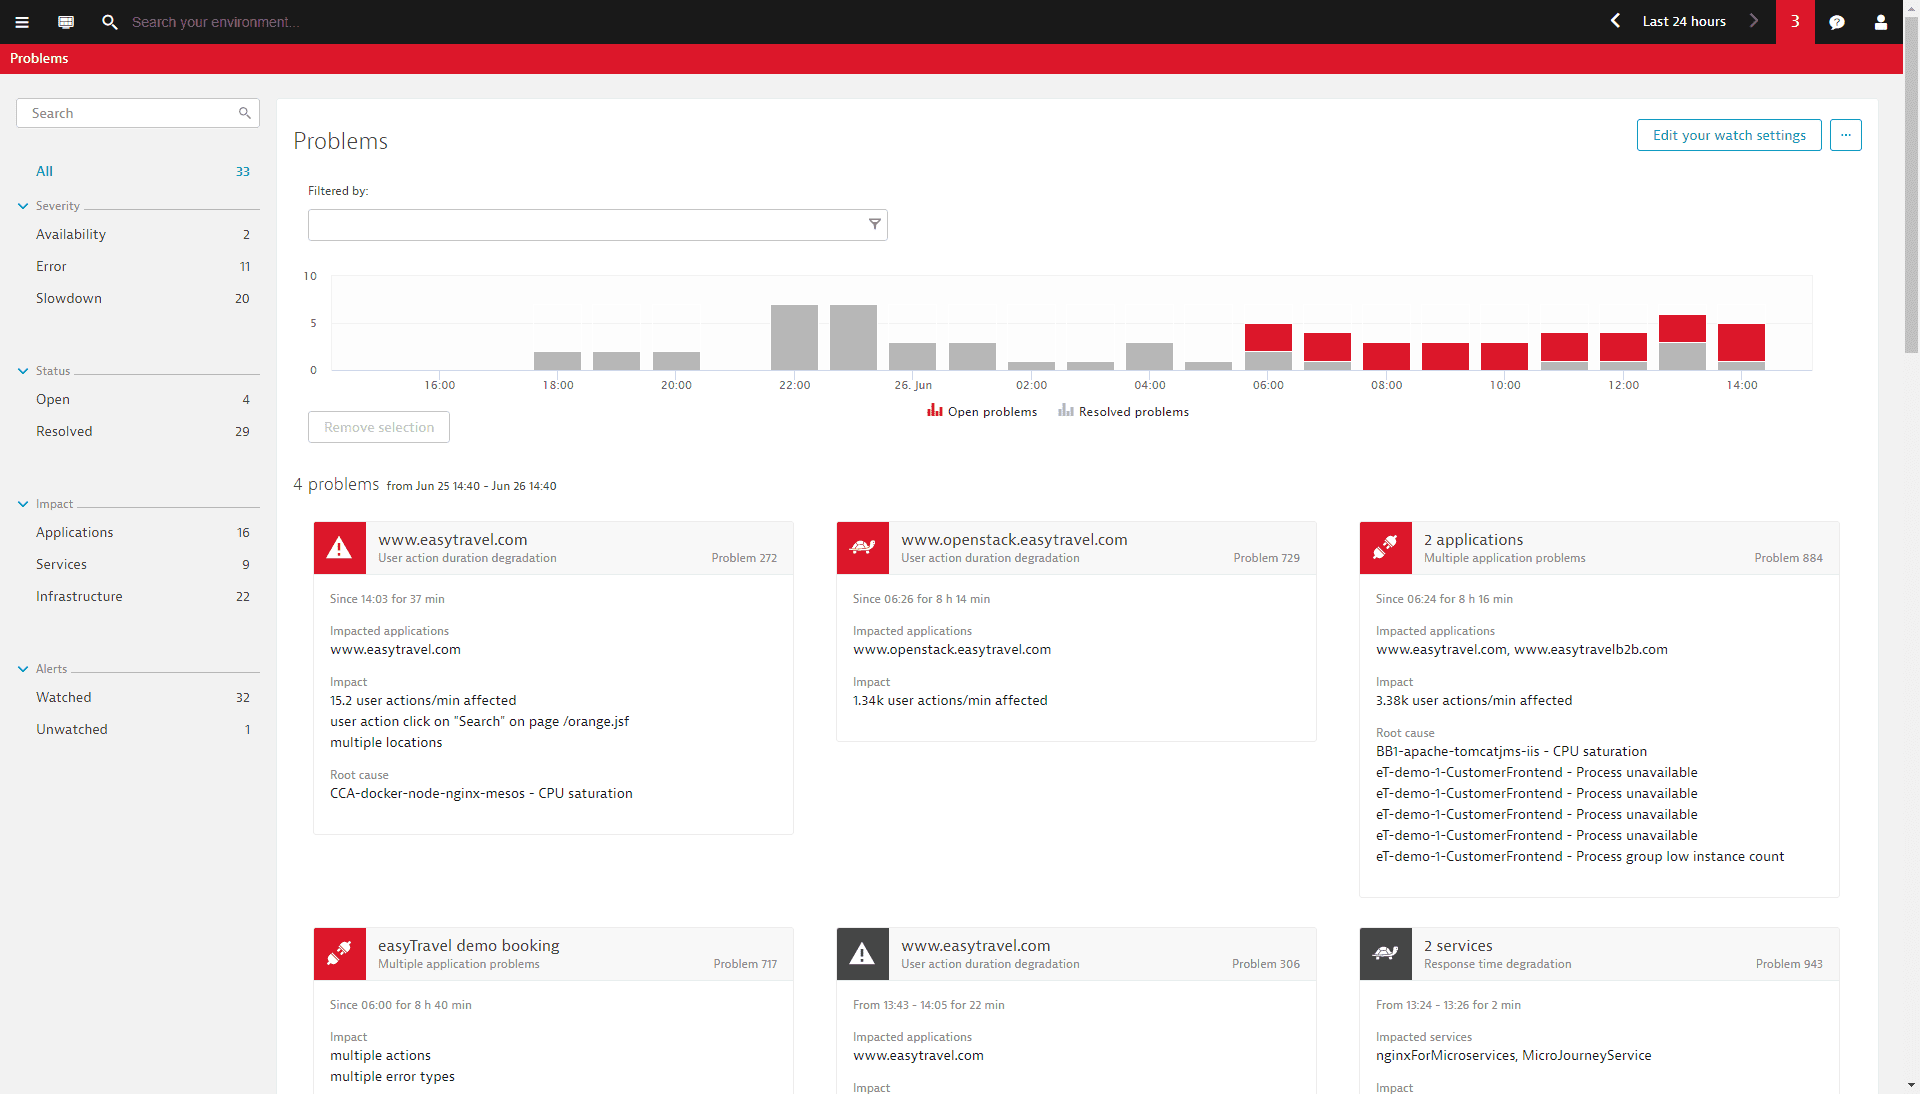
3. Dynatrace – Application performance management software with Hadoop monitoring - with NameNode/DataNode metrics, dashboards, analytics, custom alerts, and more. Dynatrace provides a high-level overview of the main Hadoop components within your cluster. Enhanced insights are available for HDFS and MapReduce. Hadoop-specific metrics are presented alongside all infrastructure measurements, providing you with in-depth Hadoop performance analysis of both current and historical data.
Service-oriented monitoring
From an operations perspective, Hadoop clusters are incredibly resilient in the face of system failures. Hadoop was designed with failure in mind and can tolerate entire racks going down.
Monitoring Hadoop requires a different mindset than monitoring something like RabbitMQ—DataNodes and NodeManagers should be treated like cattle.
As with Docker containers, you generally don’t care if a single worker node fails. On the other hand, failure of a master node such as one of your NameNodes will require fairly rapid remediation. Generally speaking, individual host-level indicators are less important than service-level metrics when it comes to Hadoop.
Key Hadoop performance metrics to monitor
When working properly, a Hadoop cluster can handle a truly massive amount of data—there are plenty of production clusters managing petabytes of data each. Monitoring each of Hadoop’s sub-components is essential to keep jobs running and the cluster humming.
Hadoop metrics can be broken down into four broad categories:
- HDFS metrics
- MapReduce counters
- YARN metrics
- ZooKeeper metrics
Below, we’re going to break each of these metric types down, explaining what they are and providing a brief guide for how you can monitor them.
HDFS Metrics
Apache Hadoop Distributed File System (HDFS) is a distributed file system with a NameNode and DataNode architecture. Whenever the HDFS receives data it breaks it down into blocks and sends it to multiple nodes. The HDFS is scalable and can support thousands of nodes.
Monitoring key HDFS metrics is important because it helps you to monitor the capacity of the DFS, monitor the space available, track the status of blocks, and optimize the storage of your data.
There are two main categories of HDFS metrics:
- NameNode metrics
- DataNode metrics
NameNodes and DataNodes
HDFS follows a master-slave architecture where every cluster in the HDFS is composed of a single NameNode (master) and multiple DataNodes (slave). The NameNode controls access to files, records metadata of files stored in the cluster, and monitors the state of DataNodes.
A DataNode is a process that runs on each slave machine, which performs low-level read/write requests from the system’s clients and sends periodic heartbeats to the NameNode, to report on the health of the HDFS. The NameNode then uses the health information to monitor the status of DataNodes and verify that they’re live.
When monitoring, it’s important to prioritize analyzing metrics taken from the NameNode because if a NameNode fails, all the data within a cluster will become inaccessible to the user. Additionally, if you need to connect Hadoop clusters to external applications or local LLMs, a governed data access layer like DreamFactory can provide secure API access to your HDFS and other data sources with role-based controls and identity passthrough.
Prioritizing monitoring NameNode also makes sense as it enables you to ascertain the health of all the data nodes within a cluster. NameNode metrics can be broken down into two groups:
- NameNode-emitted metrics
- NameNode Java Virtual Machine (JVM) metrics
Below we’re going to list each group of metrics you can monitor and then show you a way to monitor these metrics for HDFS.
NameNode-emitted metrics
- CapacityRemaining – Records the available capacity
- CorruptBlocks/MissingBlocks – Records number of corrupt/missing blocks
- VolumeFailuresTotal – Records number of failed volumes
- NumLiveDataNodes/NumDeadDataNodes – Records count of alive or dead DataNodes
- FilesTotal – Total count of files tracked by the NameNode
- Total Load – Measure of file access across all DataNodes
- BlockCapacity/BlocksTotal – Maximum number of blocks allocable/count of blocks tracked by NameNode
- UnderReplicated Blocks – Number of under-replicated blocks
- NumStaleDataNodes – Number of stale DataNodes
NameNode JVM Metrics
- ConcurrentMarkSweep count – Number of old-generation collections
- ConcurrentMarkSweep time – The elapsed time of old-generation collections, in milliseconds
How to Monitor HDFS Metrics
One way that you can monitor HDFS metrics is through Java Management Extensions (JMX) and the HDFS daemon web interface. To view a summary of NameNode and performance metrics enter the following URL into your web browser to access the web interface (which is available by default at port 50070):
http://<namenodehost>:50070
Here you’ll be able to see information on Configured Capacity, DFS Used, Non-DFS Used, DFS Remaining, Block Pool Used, DataNodes usage, and more.
If you require more in-depth information, you can enter the following URL to view more metrics with a JSON output:
http://<namenodehost>:50070jmx
MapReduce Counters
MapReduce is a software framework used by Hadoop to process large datasets in parallel across thousands of nodes. The framework breaks down a dataset into chunks and stores them in a file system. MapReduce jobs are responsible for splitting the datasets and map tasks then processing the data.
For performance monitoring purposes, you need to monitor MapReduce counters, so that you view information/statistics about job execution. Monitoring MapReduce counters enables you to monitor the number of rows read, and the number of rows written as output.
You can use MapReduce counters to find performance bottlenecks. There are two main types of MapReduce counters:
- Built-in Counters – Counters that are included with MapReduce by default
- Custom counters – User-defined counters that the user can create with custom code
Below we’re going to look at some of the built-in counters you can use to monitor Hadoop.
Built-In MapReduce Counters
Built-in Counters are counters that come with MapReduce by default. There are five main types of built-in counters:
- Job counters
- Task counters
- File system counters
- FileInputFormat Counters
- FileOutput Format Counters
Job Counters
MapReduce job counters measure statistics at the job level, such as the number of failed maps or reductions.
- MILLIS_MAPS/MILLIS_REDUCES – Processing time for maps/reduces
- NUM_FAILED_MAPS/NUM_FAILED_REDUCES – Number of failed maps/reduces
- RACK_LOCAL_MAPS/DATA_LOCAL_MAPS/OTHER_LOCAL_MAPS – Counters tracking where map tasks were executed
Task Counters
Task counters collect information about tasks during execution, such as the number of input records for reduced tasks.
- REDUCE_INPUT_RECORDS – Number of input records for reduced tasks
- SPILLED_RECORDS – Number of records spilled to disk
- GC_TIME_MILLIS – Processing time spent in garbage collection
FileSystem Counters
FileSystem Counters record information about the file system, such as the number of bytes read by the FileSystem.
- FileSystem bytes read – The number of bytes read by the FileSystem
- FileSystem bytes written – The number of bytes written to the FileSystem
FileInputFormat Counters
FileInputFormat Counters record information about the number of bytes read by map tasks
- Bytes read – Displays the bytes read by map tasks with the specific input format
File OutputFormat Counters
FileOutputFormat counters gather information on the number of bytes written by map tasks or reduce tasks in the output format.
- Bytes written – Displays the bytes written by map and reduce tasks with the specified format
How to Monitor MapReduce Counters
You can monitor MapReduce counters for jobs through the ResourceManager web UI. To load up the ResourceManager web UI, go to your browser and enter the following URL:
http://<resourcemanagerhost>:8088
Here you will be shown a list of All Applications in a table format. Now, go to the application you want to monitor and click the History hyperlink in the Tracking UI column.
On the application page, click on the Counters option on the left-hand side. You will now be able to view counters associated with the job monitored.
YARN Metrics
Yet Another Resource Negotiator (YARN) is the component of Hadoop that’s responsible for allocating system resources to the applications or tasks running within a Hadoop cluster.
There are three main categories of YARN metrics:
- Cluster metrics – Enable you to monitor high-level YARN application execution
- Application metrics – Monitor execution of individual YARN applications
- NodeManager metrics – Monitor information at the individual node level
Cluster Metrics
Cluster metrics can be used to view a YARN application execution.
- unhealthyNodes – Number of unhealthy nodes
- activeNodes – Number of currently active nodes
- lostNodes – Number of lost nodes
- appsFailed – Number of failed applications
- totalMB/allocatedMB – Total amount of memory/amount of memory allocated
Application metrics
Application metrics provide in-depth information on the execution of YARN applications.
- progress – Application execution progress meter
NodeManager metrics
NodeManager metrics display information on resources within individual nodes.
- containersFailed – Number of containers that failed to launch
How to Monitor YARN Metrics
To collect metrics for YARN, you can use the HTTP API. With your resource manager, host query the yarn metrics located on port 8088 by entering the following (use the qry parameter to specify the MBeans you want to monitor).
Resourcemanagerhost:8088/jmx?qry=java.lang:type=memory
ZooKeeper Metrics
ZooKeeper is a centralized service that maintains configuration information and delivers distributed synchronization across a Hadoop cluster. ZooKeeper is responsible for maintaining the availability of the HDFS NameNode and YARNs ResourceManager.
Some key ZooKeeper metrics you should monitor include:
- zk_followers – Number of active followers
- zk_avg_latency – Amount of time it takes to respond to a client request (in ms)
- zk_num_alive_connections – Number of clients connected to ZooKeeper
How to Collect Zookeeper Metrics
There are a number of ways you can collect metrics for Zookeeper, but the easiest is by using the 4 letter word commands through Telnet or Netcat at the client port. To keep things simple, we’re going to look at the mntr, arguably the most important of the four 4 letter word commands.
$ echo mntr | nc localhost 2555
Entering the mntr command will return you information on average latency, maximum latency, packets received, packets sent, outstanding requests, number of followers, and more. You can view a list of four-letter word commands on the Apache ZooKeeper site.
Conclusion
Monitoring Hadoop metrics is vital for making sure that your clusters stay up and running. While you can attempt to monitor Hadoop metrics through JMX or an HTTP API, it doesn’t offer the complete monitoring experience that many infrastructure monitoring tools like Prometheus, LogicMonitor, and Dynatrace do.
These tools offer features like custom dashboards and alerts that provide you with a more holistic perspective of what’s going on. By collecting all of your Hadoop performance data and putting it in one place, you’ll be able to monitor the performance of your systems much more effectively.


