
Table of Contents
- Introduction
- Configure Your Apache Server
- Getting Started with the Telegraf Agent
- Configure the Telegraf Apache Input Plugin
- Step 1: Configure Promtail to Collect Apache Logs
- Create a Loki Data Source in our Hosted Grafana
- Use Hosted Graphite by MetricFire to Create Custom Dashboards and Alerts
- Conclusion
Great systems are not just built. They are monitored.
MetricFire runs Graphite and Grafana as a fully managed service for growing engineering teams, taking care of storage, scaling, and version updates so your team doesn't have to. Plans start at $19/month, billed per metric namespace rather than per host, and include engineer-staffed support. Integrations work natively with Heroku, AWS, Azure, and GCP, and data is stored with 3× redundancy in SOC2- and ISO:27001-certified data centres.
Introduction
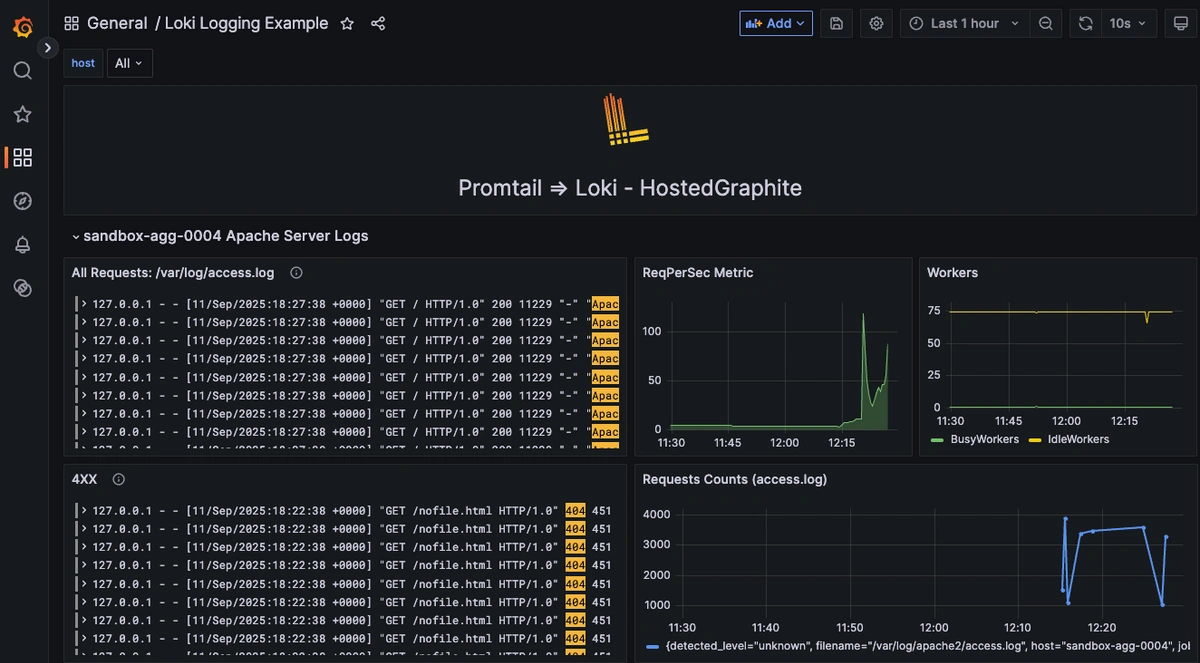
When you’re running Apache in production, metrics alone only tell half the story. Numbers like requests per second, busy workers, or CPU load can show you that something is happening, but they don’t explain why. That’s where logs come in. Access and error logs provide the line-by-line context like which endpoints are getting hammered, which clients are failing authentication, and what errors the server is throwing under load. By combining Apache’s metrics with its access/error logs, you move from raw performance counters to a complete observability picture: trends that highlight incidents, and detailed evidence that pinpoints their root causes.
In this article, we'll detail how to use Promtail to ship logs to Loki, and the Telegraf agent to collect Apache HTTP server performance statistics and forward them to a data source.
Configure Your Apache Server
This article assumes that you already have an Apache server running, but here's a quick install guide (ubuntu) if you want to configure one for testing purposes:
- Install Apache: sudo apt install apache2
- Optionally, adjust the firewall settings to allow outside traffic: sudo ufw allow 'Apache'
- Enable and start the service: sudo systemctl enable --now apache2
- If there are errors, make sure no other processes are running on Apache's default port 80: sudo netstat -tulpn | grep :80
Getting Started with the Telegraf Agent
Telegraf is a plugin-driven server agent built on InfluxDB that collects and sends metrics/events from databases, systems, processes, devices, and applications. It is written in Go and compiles into a single binary with no external dependencies and requires a minimal memory footprint. Telegraf is compatible with many operating systems and has many useful output plugins and input plugins for collecting and forwarding a wide variety of system performance metrics.
Setup the Telegraf Collector
If you don't already have an instance of Telegraf running in your server, install our handy HG-CLI tool to quickly install/configure Telegraf:
curl -s "https://www.hostedgraphite.com/scripts/hg-cli/installer/" | sudo sh
NOTE: You will need to input your Hosted Graphite API key, and follow the prompts to select which metric sets you want.
Configure the Telegraf Apache Input Plugin
Telegraf has many input plugins that can collect a wide range of data from many popular technologies and 3rd party sources. In this example, we'll demonstrate how to collect and forward metrics from your Apache server.
Just add the following inputs.apache section in your /etc/telegraf/telegraf.conf file:
 [[inputs.apache]]
  urls = ["http://localhost/server-status?auto"]
Then, you can save your changes, restart the apache2 service, and run the telegraf daemon using the following command. This will help you see if there are any configuration errors in the output:
telegraf --config telegraf.conf
Telegraf will now be forwarding roughly 40 metrics (per host), to your configured datasource. This is what the metrics look like in the Graphite format:
telegraf.<host>.80.localhost.apache.BusyWorkers
telegraf.<host>.80.localhost.apache.BytesPerReq
telegraf.<host>.80.localhost.apache.BytesPerSec
telegraf.<host>.80.localhost.apache.CPUChildrenSystem
telegraf.<host>.80.localhost.apache.CPUChildrenUser
telegraf.<host>.80.localhost.apache.CPULoad
telegraf.<host>.80.localhost.apache.CPUSystem
telegraf.<host>.80.localhost.apache.CPUUser
telegraf.<host>.80.localhost.apache.ConnsAsyncClosing
telegraf.<host>.80.localhost.apache.ConnsAsyncKeepAlive
telegraf.<host>.80.localhost.apache.ConnsAsyncWriting
telegraf.<host>.80.localhost.apache.ConnsTotal
telegraf.<host>.80.localhost.apache.DurationPerReq
telegraf.<host>.80.localhost.apache.IdleWorkers
telegraf.<host>.80.localhost.apache.Load1
telegraf.<host>.80.localhost.apache.Load15
telegraf.<host>.80.localhost.apache.Load5
telegraf.<host>.80.localhost.apache.ParentServerConfigGeneration
telegraf.<host>.80.localhost.apache.ParentServerMPMGeneration
telegraf.<host>.80.localhost.apache.Processes
telegraf.<host>.80.localhost.apache.ReqPerSec
telegraf.<host>.80.localhost.apache.ServerUptimeSeconds
telegraf.<host>.80.localhost.apache.Stopping
telegraf.<host>.80.localhost.apache.TotalAccesses
telegraf.<host>.80.localhost.apache.TotalDuration
telegraf.<host>.80.localhost.apache.TotalkBytes
telegraf.<host>.80.localhost.apache.Uptime
telegraf.<host>.80.localhost.apache.scboard_closing
telegraf.<host>.80.localhost.apache.scboard_dnslookup
telegraf.<host>.80.localhost.apache.scboard_finishing
telegraf.<host>.80.localhost.apache.scboard_idle_cleanup
telegraf.<host>.80.localhost.apache.scboard_keepalive
telegraf.<host>.80.localhost.apache.scboard_logging
telegraf.<host>.80.localhost.apache.scboard_open
telegraf.<host>.80.localhost.apache.scboard_reading
telegraf.<host>.80.localhost.apache.scboard_sending
telegraf.<host>.80.localhost.apache.scboard_starting
telegraf.<host>.80.localhost.apache.scboard_waiting
See the official GitHub repository for additional details and configuration options for the Apache plugin.
Step 1: Configure Promtail to Collect Apache Logs
We support log collection via OpenTelemetry Contrib and Promtail. In this example, we'll detail how to configure Promtail since it is an official log shipping agent for Grafana Loki. It runs as a lightweight binary that tails log files (like /var/log/*) and forwards them to our Hosted Loki endpoint over HTTP. (This article assumes that you are already running an instance of Nginx that is serving traffic on a designated port).
Install/unpack Promtail (Ubuntu)
wget https://github.com/grafana/loki/releases/download/v3.5.3/promtail_3.5.3_amd64.deb

sudo apt-get install -y ./promtail_3.5.3_amd64.deb
Configure Promtail to Forward Logs
Update your Promtail configuration file at /etc/promtail/config.yml to include the following:
server:
  http_listen_port: 9080
  grpc_listen_port: 0

positions:
  filename: /tmp/positions.yaml

clients:
  - url: https://<YOUR-API-KEY>@www.hostedgraphite.com/logs/sink

scrape_configs:
  - job_name: apache-logs
    static_configs:
      - targets:
          - localhost
        labels:
          host: <HOST-NAME>
          job: apache-logs
          __path__: /var/log/apache2/*.log
NOTE: Make sure to replace YOUR-API-KEY and HOST-NAME in the above config and restart the Promtail service:
sudo systemctl restart promtail
sudo systemctl status promtail
Create a Loki Data Source in our Hosted Grafana
REACH OUT TO US about trying our new Logging feature for FREE, and we will create a Loki Access Key in your Hosted Graphite account. If you don't already have a Hosted Graphite account, sign up for a free trial here to obtain a Hosted Graphite API key and Loki Access Key.
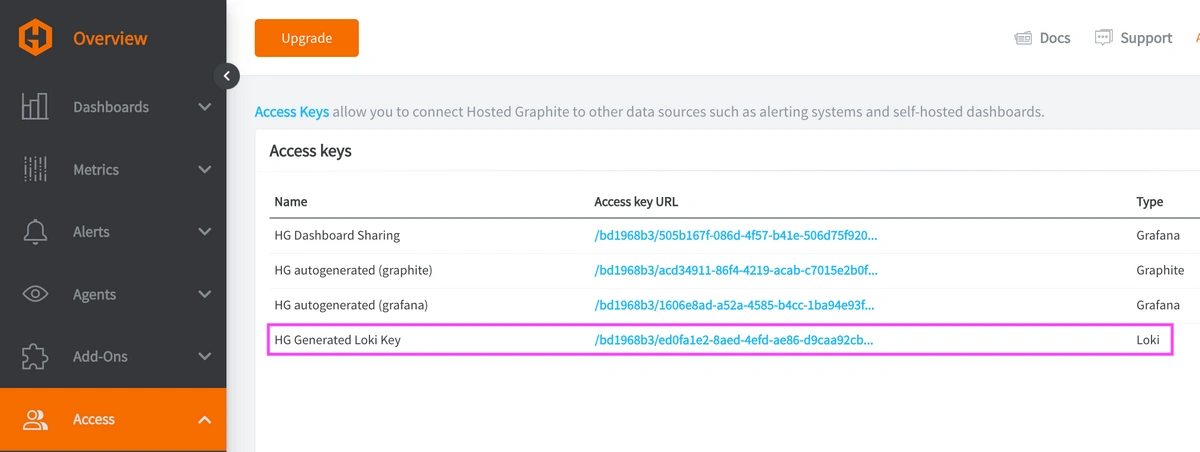
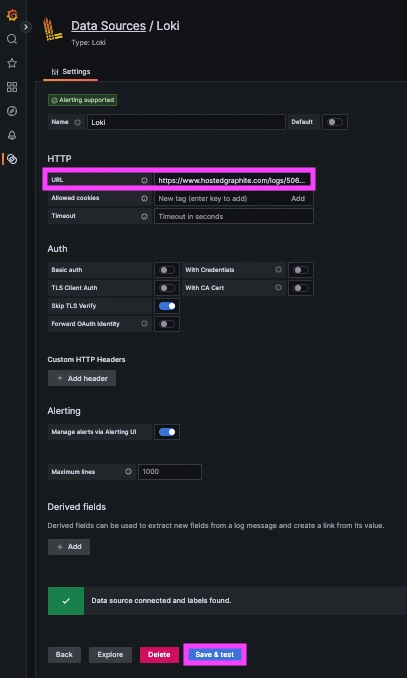
Now within the Hosted Graphite UI, you can navigate to Dashboards => Settings => Data sources => Add New Data source (Loki). You'll be able to add the URL for your HG Loki endpoint, which includes your new Loki Access Key: https://www.hostedgraphite.com/logs/<UID>/<LOKI-ACCESS-KEY>
Use Hosted Graphite by MetricFire to Create Custom Dashboards and Alerts
MetricFire is a monitoring platform that enables you to gather, visualize and analyze metrics and data from sources such as servers, databases, networks, processes, devices, and applications. Using MetricFire, you can effortlessly identify problems and optimize resources within your infrastructure. Hosted Graphite by MetricFire removes the burden of self-hosting your monitoring solution, allowing you more time and freedom to work on your most important tasks.
Once you have signed up for a Hosted Graphite account and used the above steps to configure your server(s) with the Telegraf Agent, metrics will be forwarded, timestamped, and aggregated into the Hosted Graphite backend.
-
Metrics will be sent and stored in the Graphite format of: metric.name.path <numeric-value> <unix-timestamp>
-
The dot notation format provides a tree-like data structure, making it efficient to query
-
Metrics are stored in your Hosted Graphite account for two years, and you can use them to create custom Alerts and Grafana dashboards.
Build Dashboards in Hosted Graphite's Hosted Grafana
In the Hosted Graphite UI, navigate to Dashboards => Primary Dashboards and select the + button to create a new panel.
Then you can use the query UI in Edit mode to select a graphite metric path (the default data source will be the hosted graphite backend if you are accessing Grafana via your HG account):
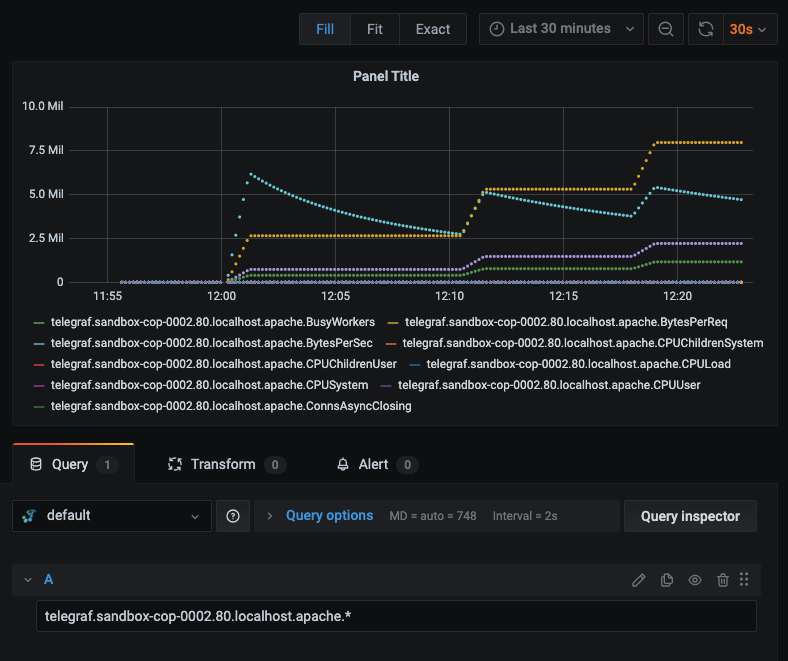
NOTE: The Hosted Graphite datasource also supports wildcard (*) searching to grab all metrics that match a specified path.
Now you can apply Graphite functions to these metrics like aliasByNode() to format the name and exclude() to omit specified patterns:
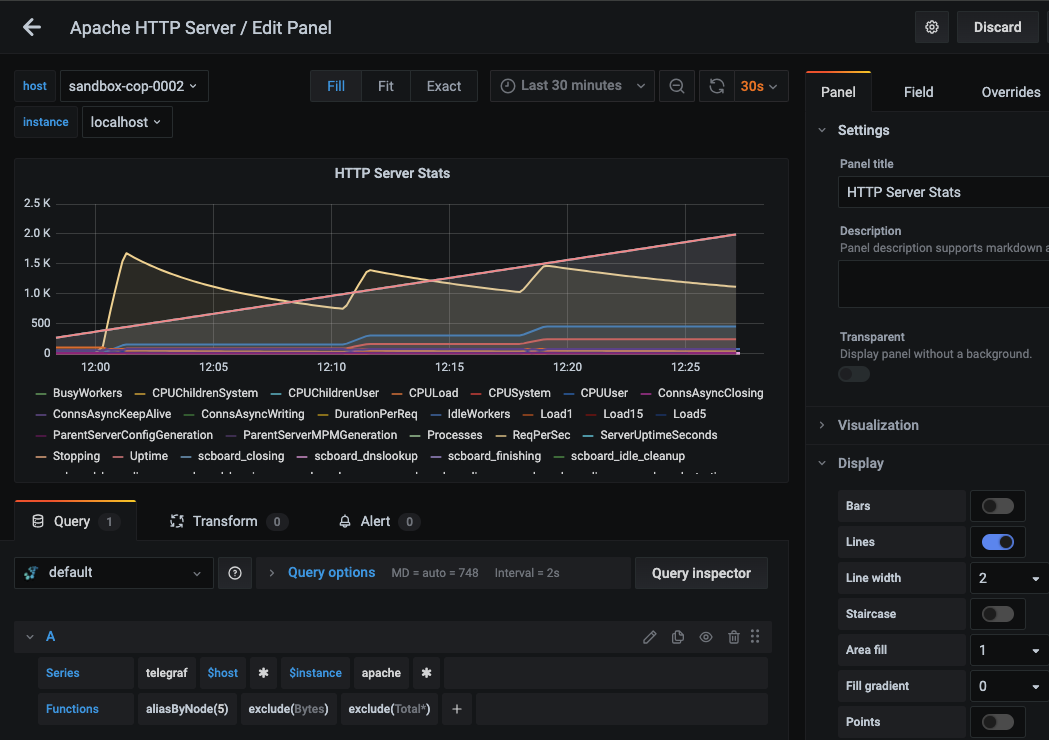
Grafana has many additional options to apply different visualizations, modify the display, set units of measurement, and some more advanced features like configuring dashboard variables and event annotations.
The above example has a dashboard variable configured for 'instance' at index 4 of the metric series. See the Hosted Graphite dashboard docs for more details.
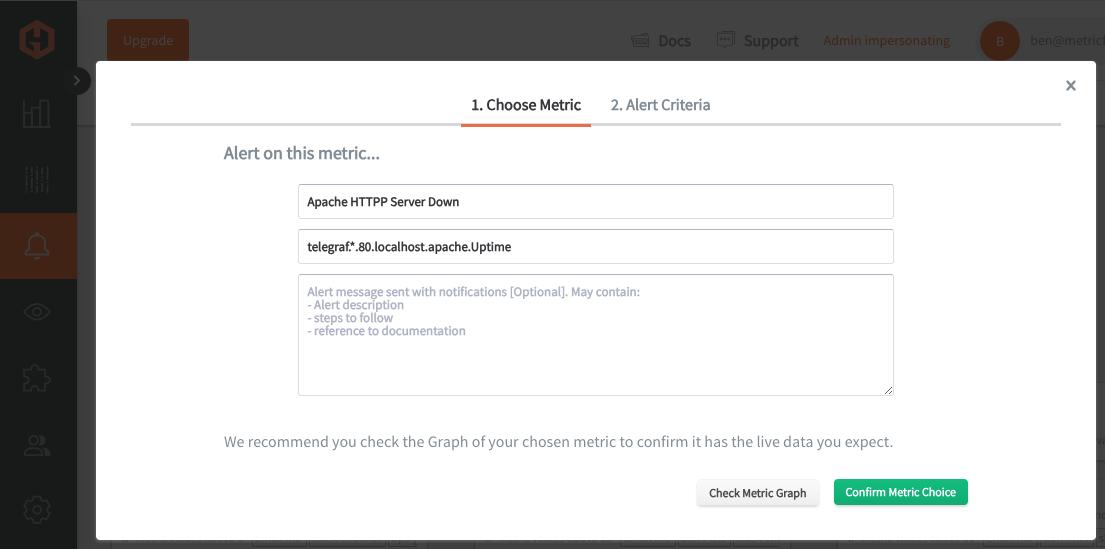
Creating Graphite Alerts
In the Hosted Graphite UI, navigate to Alerts => Graphite Alerts to create a new alert. Name the alert, add a query to the alerting metric field, and add a description of what this alert is:
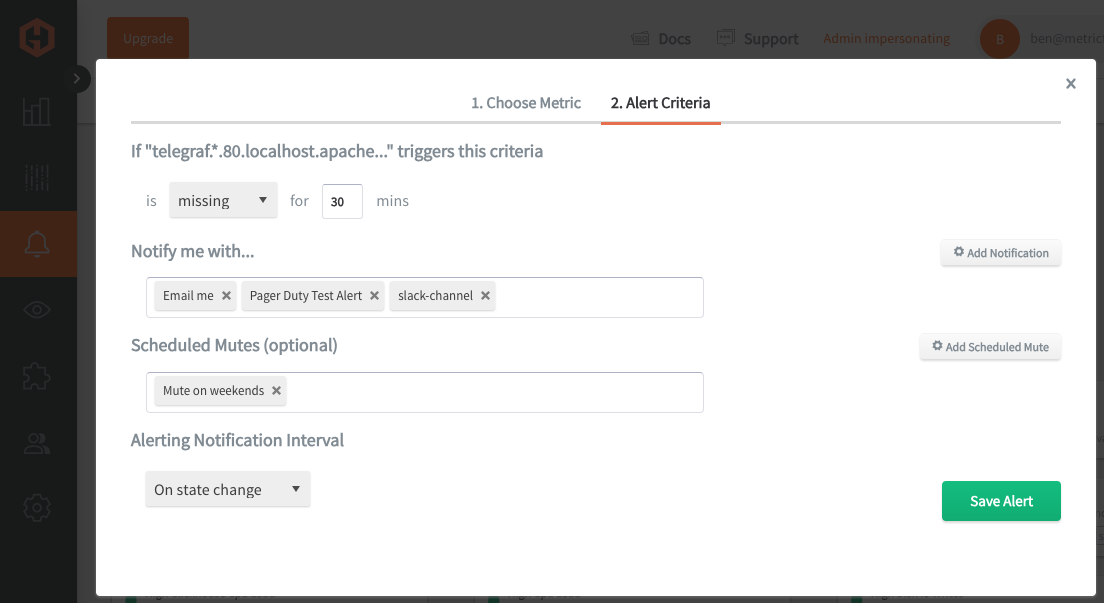
Then, select the Alert Criteria tab to set a threshold and select a notification channel. The default notification channel will be the email you used to sign up for the Hosted Graphite account. Still, you can easily configure channels for Slack, PagerDuty, Microsoft Teams, OpsGenie, custom webhooks and more. See the Hosted Graphite docs for more details on notification channels:
Conclusion
Monitoring the full performance of your Apache servers is vital for maintaining optimal operation and ensuring the highest level of service availability for your business. It not only aids in detecting and mitigating issues before they affect users but also supports strategic planning and security enhancements.
Tools like dashboards and alerts will complement your data by providing real-time visualization, proactive identification of issues, historical trend analysis, and facilitating informed decision-making, all essential for maintaining a robust and efficient infrastructure.
Sign up for the free trial and experiment with monitoring your Apache instances today. You can also book a demo and talk to the MetricFire team directly about your monitoring needs.


