
Table of Contents
Great systems are not just built. They are monitored.
MetricFire runs Graphite and Grafana as a fully managed service for growing engineering teams, taking care of storage, scaling, and version updates so your team doesn't have to. Plans start at $19/month, billed per metric namespace rather than per host, and include engineer-staffed support. Integrations work natively with Heroku, AWS, Azure, and GCP, and data is stored with 3× redundancy in SOC2- and ISO:27001-certified data centres.
Introduction
Before we discuss the specifics of each alternative to Datadog, let's address the most critical point: scaling. Datadog is great for users who need to do a little bit of everything, but DataDog's biggest weakness is scaling.
Datadog can do logs, APM, time series and more, but scaling time-series metrics, alerts, and servers will cause your monthly bill to escalate. The graph below shows what you pay at Datadog vs. MetricFire, a leading competitor:
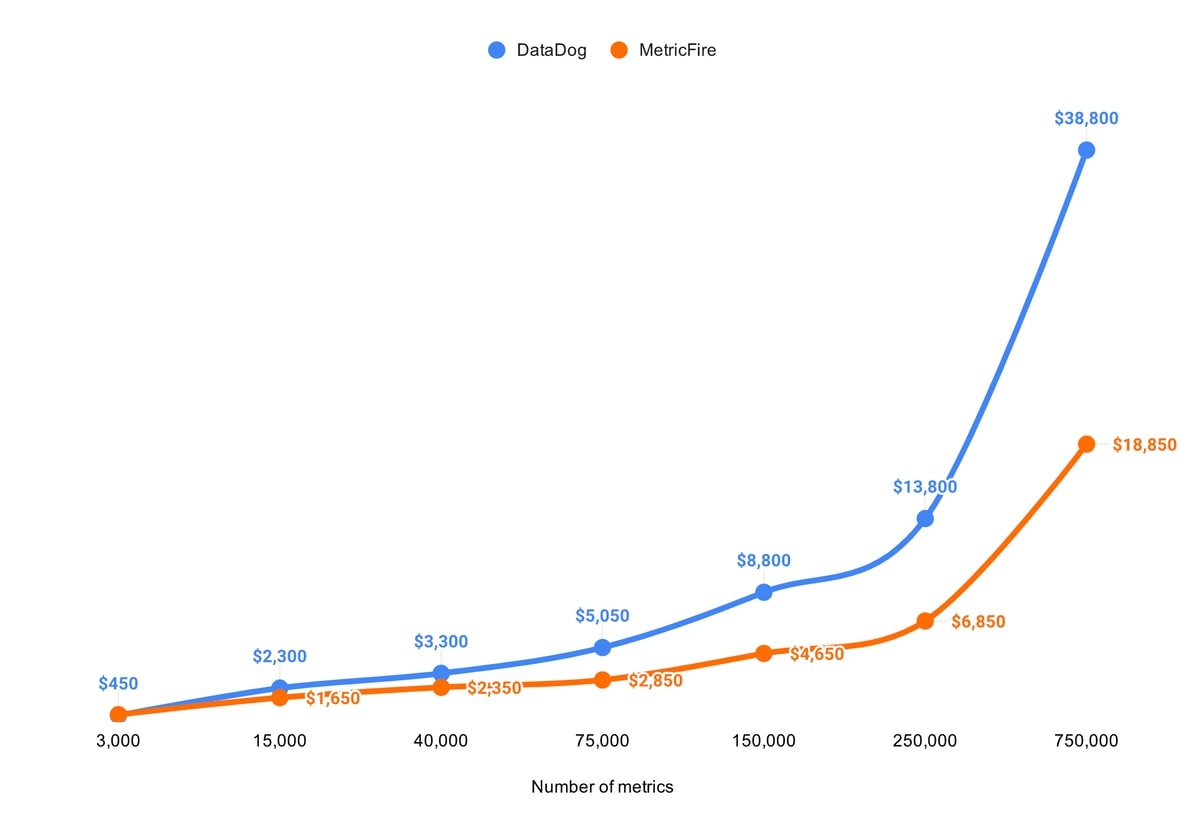
MetricFire is a time-series metrics monitoring platform built on the open-source Graphite and Hosted Dashboards. MetricFire specializes in scaling custom-series metrics, whereas Datadog doesn't. MetricFire balances the cost, functionality, and ease of use that today's DevOps engineers seek. To find out more, book a demo with the MetricFire team!
Key Takeaways
-
Scaling is a critical issue for Datadog, as it becomes expensive to scale time-series metrics, alerts, and servers, causing the monthly bill to escalate.
-
MetricFire is an enterprise-focused monitoring solution that specializes in scaling custom-series metrics. Hosted Graphite runs on Riak and offers increased support for tagged metrics, backups, and 24/7 support from engineers, all starting at $99 a month.
-
New Relic provides infrastructure monitoring that records metrics and watches for events affecting servers in near real-time. It provides pre-configured dashboards for 50 or more services, including Amazon Web Services, Microsoft Azure, and Google Cloud Platform and their integrations.
-
Prometheus is an open-source monitoring system that provides an end-to-end monitoring solution for its own time-series database. Its focus is on reliability, multidimensional data collection, and visualizations through dashboards.
-
AWS CloudWatch is a suite of tools that includes a wide range of capabilities, such as monitoring operational health and performance, log analysis, and event management. It also allows users to automate actions to troubleshoot issues.
MetricFire
MetricFire is an enterprise-focused monitoring solution that provides users with end-to-end infrastructure monitoring built on open-source services, including Graphite and Dashboards. MetricFire has improved these open-source systems and made the open-source projects available as one hosted product. It is designed for teams of every size, from startups to large-scale enterprises.
With Hosted Graphite on MetricFire, we store your data for up to two years with 3 times redundancy. With Hosted Graphite running on Riak, essentially replacing Graphite’s antiquated file-based whisper storage, one can seamlessly scale with a cluster-based database. MetricFire additionally provides increased support for tagged metrics, backups and 24/7 support from engineers, all starting at $19 a month. MetricFire helps get your business up quickly - you can get your infrastructure monitoring solution up and running today by signing up for a free two-week MetricFire free trial.
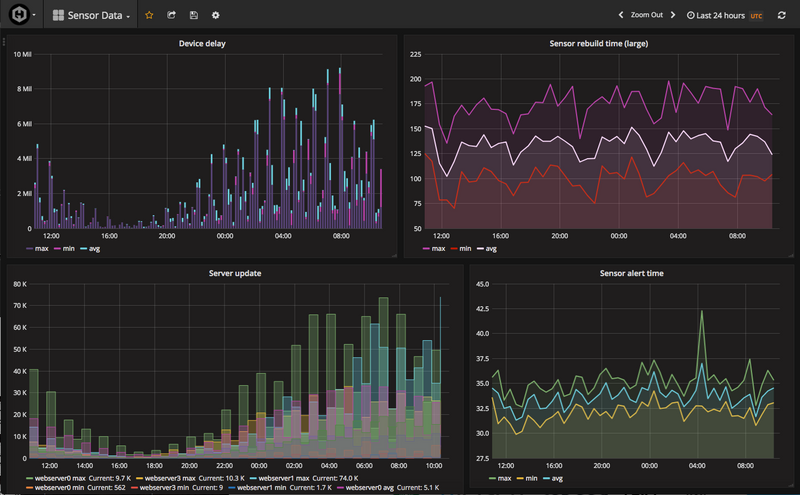
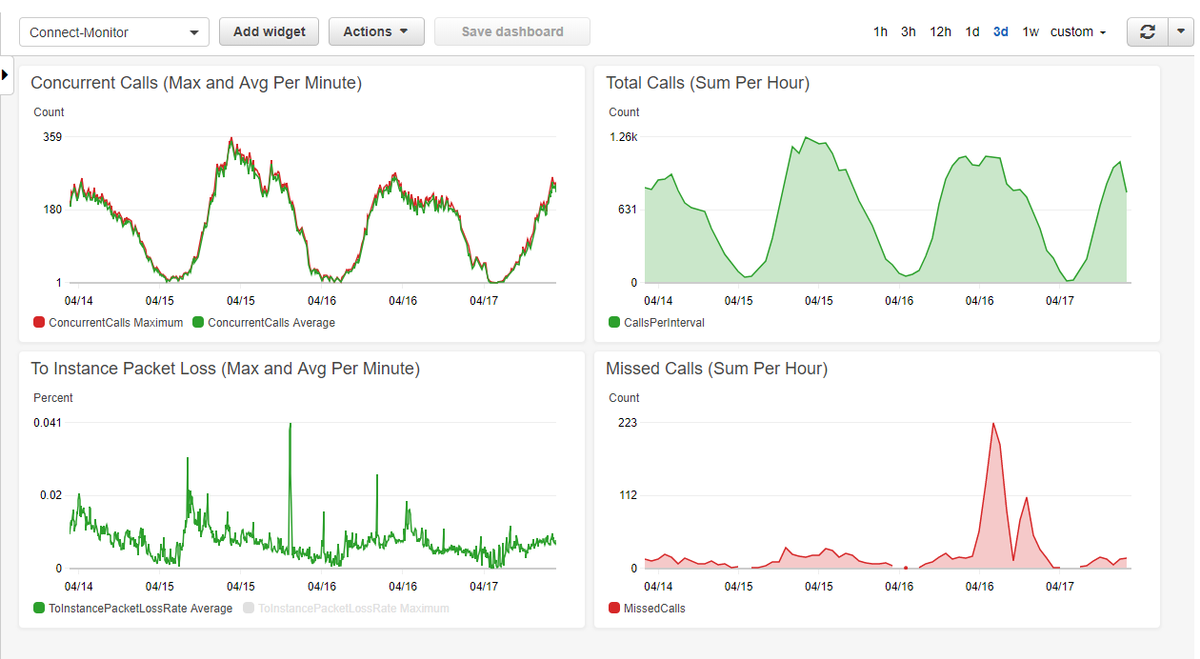
Dashboards as a service is a highly intuitive user interface included in all of MetricFire's standard pricing plans.
Datadog
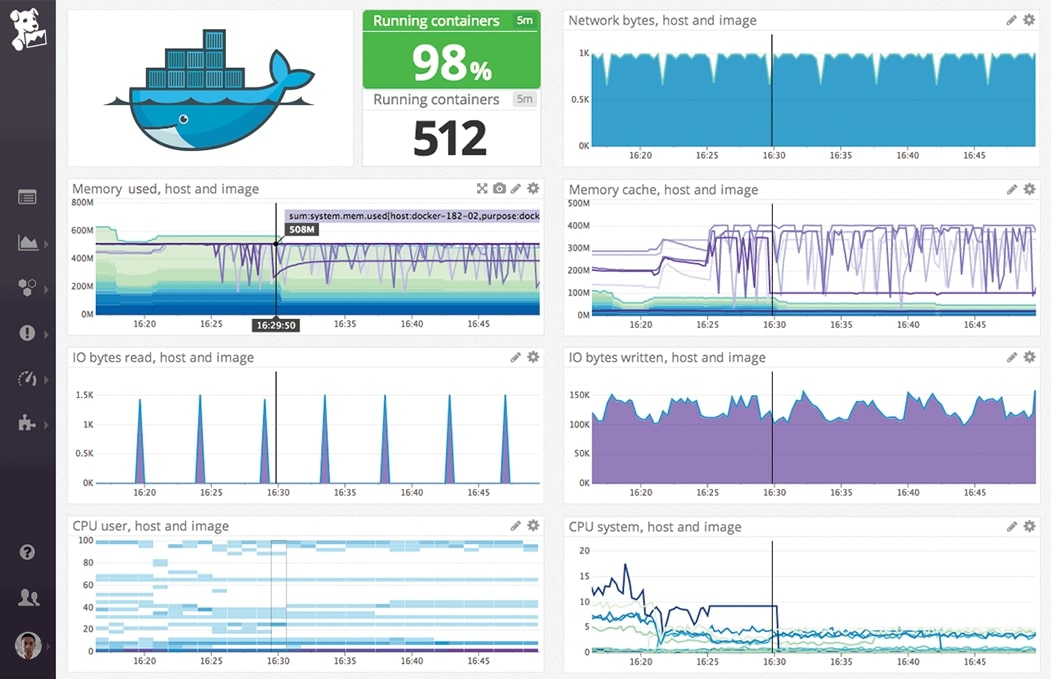
Datadog is a software-as-a-service (SaaS) infrastructure and application monitoring tool. It is used mainly in environments that need to monitor a diverse range of tools and services over the cloud—from network to system to server monitoring. Datadog covers it all with its 200+ integrations for tools and services, making it easier to monitor every component of the tech stack. Book a demo with MetricFire!
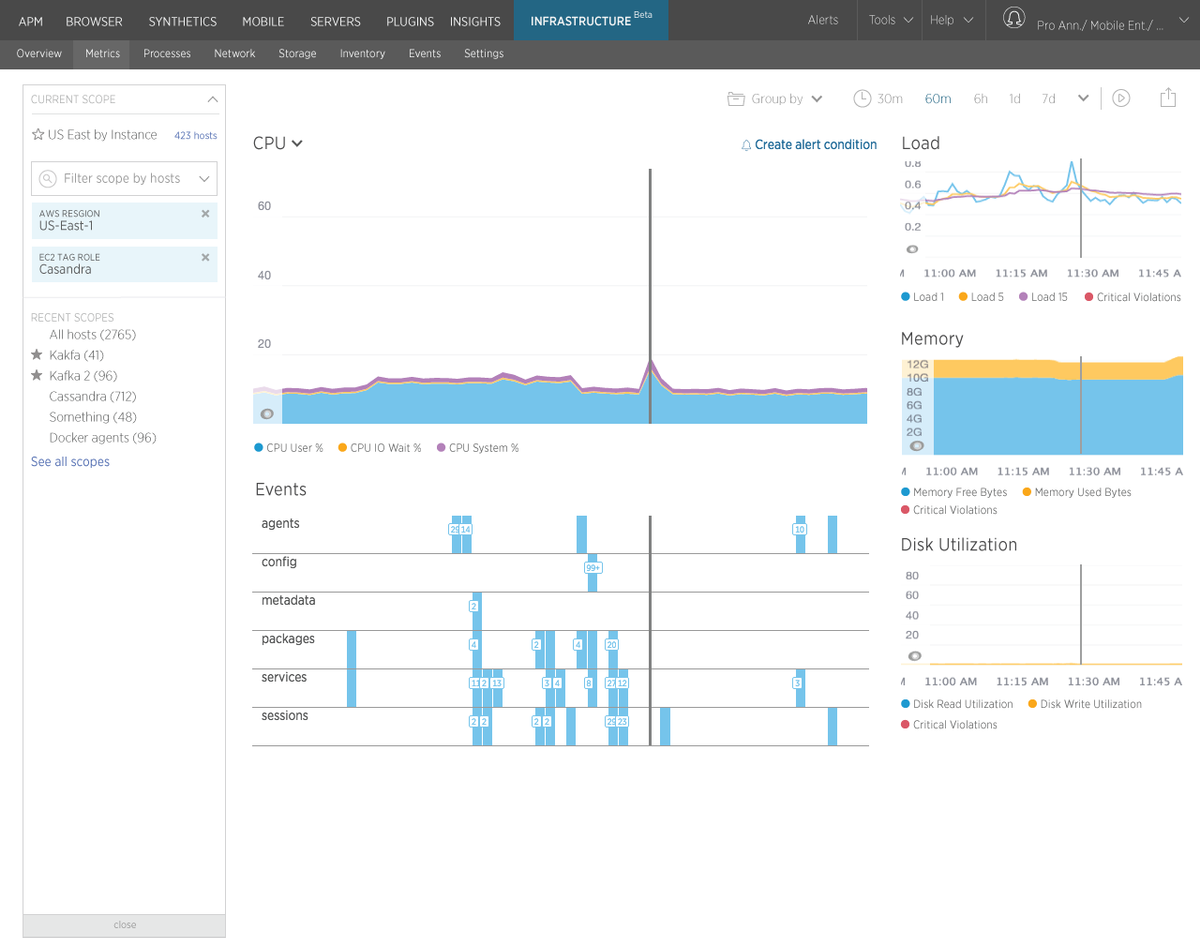
Datadog started in 2010 as a cloud infrastructure monitoring service with dashboards, alerts, and metrics visualisations. As cloud adoption increased, Datadog grew rapidly and expanded its product offering to cover service providers, including Amazon Web Services (AWS), Microsoft Azure, Google Cloud Platform, Red Hat OpenStack, and OpenStack. Datadog also quite recently launched its application monitoring service.
Datadog, with its customizable dashboards, is free for up to 5 hosts (with 1-day data retention). After that, customers are billed $15/per host per month. There’s also a 14-day free trial available. You can check the updated pricing of the Datadog infrastructure on the website. The UI can sometimes be a bit murky, with a steep learning curve, as it takes some time to get used to it. Integrating with apps such as PagerDuty or Slack to receive notifications is possible. Scaling time series metrics can also be very expensive at Datadog.
New Relic
New Relic is a solid alternative to Datadog. It provides infrastructure monitoring that records metrics and watches out for events that affect the servers in near real-time. It also provides pre-configured dashboards for 50 or more services, including Amazon Web Services, Microsoft Azure, and Google Cloud Platform, as well as their integrations.
Monitoring capabilities for Kubernetes allow customers to troubleshoot, access, and analyze metrics across application-related and infrastructure-related use cases. It can also create dynamic alerting, build custom integrations through New Relic’s integration SDK, and configure management tools. New Relic is undoubtedly a strong contender to DataDog. However, New Relic’s integrations aren’t easy for everyone to set up and require technical understanding. On the documentation and UI front, New Relic can do much better.
To compare pricing, at first New Relic provides a 30-day free trial. Then the essentials pack goes for $7.20 per user per month, and the pro pack goes for $14.40 per person per month. You can learn more about what’s included by checking the pricing page here.
Prometheus
Prometheus is an open-source monitoring system providing an end-to-end monitoring solution for its time-series database. It’s part of the Cloud Native Foundation, and it's well supported by the community. It can receive data and store it, in addition to supporting queries, graphs, and built-in alerting. It comes with a push gateway for exporting metrics from ephemeral or batch jobs and comes with a range of exporters. The Prometheus query language (PromQL) can be used to explore metrics and draw simple graphs with a lot of complexity.
Prometheus is built for system monitoring and dynamic service-oriented architectures. Its design is focused on reliability, multidimensional data collection, and visualizations through dashboards. While being open-source and free, Prometheus can be quite technical, not to mention time-intensive to set up, configure, and deploy in enterprise environments. Open-source Prometheus metrics have a default retention period of 15 days, which can be increased with the amount of storage you assign.
AWS CloudWatch
AWS CloudWatch is a suite of tools encompassing many cloud resources, including collecting logs and metrics, monitoring, visualization, alerting, and automated action in response to operational health changes. The resources can be on AWS, on-premises or a combination of both. CloudWatch is an excellent tool because it allows you to go beyond monitoring into observability.
Suppose you have an application running and it's using EC2, SNS, and AWS Lambda. In that case, CloudWatch can take care of the application performance data and the infrastructure monitoring information that goes with it. Also, it simultaneously displays both on the same dashboard. CloudWatch collects the metrics, monitors instances and alerts (Alarms and Events functions) and analyzes the overall system. CloudWatch charges on a pay-per-metric basis, where the cost of processing large metrics can grow substantially higher than competing monitoring solutions.
While it can’t be customized like other open-source alternatives, it’s the best tool for monitoring other services in Amazon Web Services. However, there is no Dashboard customization available, and AWS doesn’t automatically provide storage metrics. CloudWatch must improve integrations with a broader range of services to become a more widely applicable infrastructure monitoring tool.
Graphite
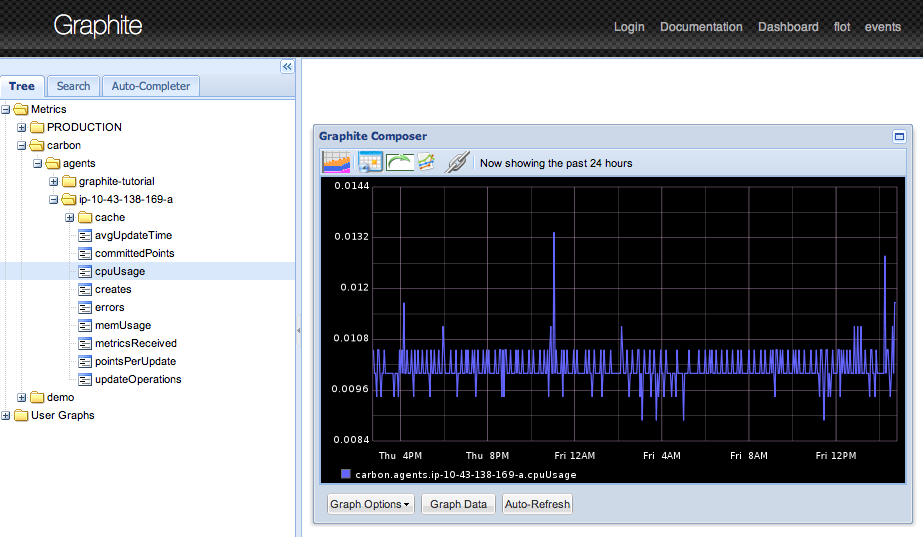
Graphite is designed to be a time-series monitoring and graphing tool. It was a genuinely groundbreaking tool when it was released back in 2006. Graphite was way ahead of its time in the monitoring space, boasting the best performance whether installed on cheap hardware or Cloud infrastructure. More than a decade later, the community is loyal to its stability and performance.
Graphite stores numeric time-series data and renders graphs of this data on demand. According to its architecture, Graphite doesn’t collect any metrics on its own, rather it offers a simpler path for getting your measurements into a time-series DB. You can use several already available metric collectors like StatsD and Telegraf. You can see more about implementing StatsD with Graphite in the StatsD configuration article.
Vanilla Graphite has been getting mixed reviews over the last few years because it has issues when running at scale and in clustered environments. The Carbon daemon is not always able to perform optimally due to its native code written in Python, and it doesn't have the best UI. However, these issues are sorted out by MetricFire's Hosted Graphite. MetricFire's Hosted Graphite improves upon open-source Graphite in other ways, such as adding team accounts, a metrics collector agent, granular dashboard permissions, and further integrations.
If you want an open-source metrics and visualization tool with features on par with many enterprise tools, Graphite is a suitable option for your monitoring requirements. MetricFire's Hosted Graphite service takes the good parts of open-source Graphite and supercharges them. Adding everything vanilla Graphite is missing: a built-in agent, team accounts, granular dashboard permissions, and integrations to other technologies and services like AWS, Heroku, Kubernetes and more.
Dynatrace
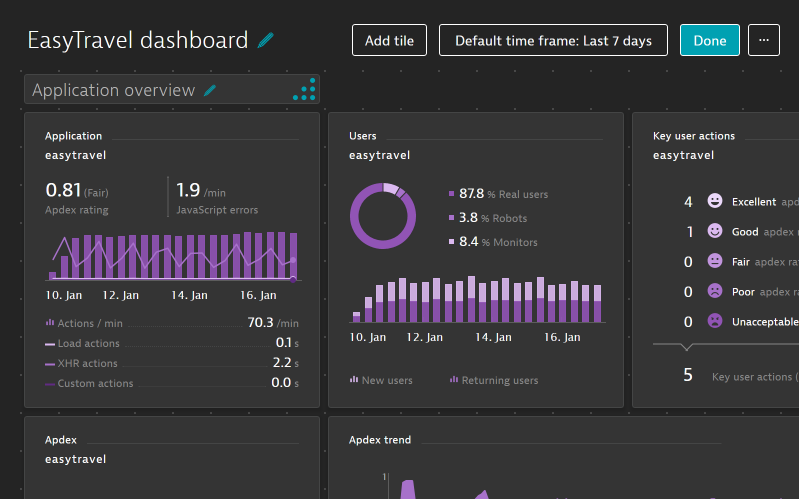
Dynatrace’s cloud infrastructure entities serve its users with ML-powered solutions spanning native and hybrid environments, with continuous auto-discovery of host machines, containers, events, and logs. Dynatrace also permits its users to analyze key infrastructure health metrics in real-time. With AI-Ops, one can deduce precise and immediate answers about anomalies and data points of possible concern. Dynatrace enterprise can be set up on bare metal, VMware, OpenStack, AWS, Azure, or as a hybrid solution.
Dynatrace went public in August 2019. From then, APM, AIOps, cloud infrastructure monitoring, and more. Dynatrace has transaction tracing, synthetic, honest user, and network monitoring. The software manages the availability and performance of software applications and the impact on overall user experience. The free version allows up to 5 servers to be monitored unlimitedly. However, it excludes data retention. The number of visits on the free version is capped at 100k.
While there is no mention of pricing on the Dynatrace website, the free version is suitable for small and immediate deployment infrastructures. The interface seemed cluttered, especially for users with no experience with cloud monitoring tools. Otherwise all and all a solid alternative to Datadog.
Conclusion
There are many extremely competitive tools available for infrastructure monitoring. Hopefully, this post provides you with the right insight, knowledge, and advice before choosing the right tool.
If you're ready to start monitoring now, try MetricFire's free trial. You can also book a demo and talk to us directly about your monitoring needs.