
Table of Contents
Great systems are not just built. They are monitored.
MetricFire runs Graphite and Grafana as a fully managed service for growing engineering teams, taking care of storage, scaling, and version updates so your team doesn't have to. Plans start at $19/month, billed per metric namespace rather than per host, and include engineer-staffed support. Integrations work natively with Heroku, AWS, Azure, and GCP, and data is stored with 3× redundancy in SOC2- and ISO:27001-certified data centres.
Introduction
Visualization and Analytics are two of the most important aspects of monitoring without which the entire data stack could just mean NOTHING. Considering the plethora of graphing tools available in the market today, selecting the right one could often be confusing. In our blogs at Metricfire, we break down the best tools in terms of their setup efforts, usage, market competitors, pricing models, best practices, and many more.
Grafana and Chronograf both are among the best tools available today. Both of them provide innovative dashboarding features. However, selecting the best is never easy. In this article, we compare their features and highlight their differences in terms of dashboards and help you make the right choice.
For more details on other features and instructions, read our blog here. If you want to try out Grafana, head to MetricFire's free trial of Hosted Grafana.
Key Takeaways
- Visualization and analytics are crucial components of effective monitoring, enhancing the value of data. Without these, the data stack lacks meaning and utility.
- Grafana's strength lies in its versatile, feature-rich dashboards. Each dashboard comprises panels organized in rows, supporting diverse visualizations. Dashboards need to be created from scratch, but the official library offers a wide range of visualization options.
- Chronograf's dashboards are straightforward and automatically generated based on enabled telegraf input plugins. It's tailored to work seamlessly with InfluxDB and simplifies the TICK platform usage.
- Grafana offers broader data source support, a wider range of visualization types, and a more sophisticated interface. Chronograf, on the other hand, is tailored to work specifically with InfluxDB and provides a simpler interface.
What is Grafana?
Grafana is an open-source analytics and monitoring solution developed and supported by Grafana Labs. It lets you query, graph, and alert on your time-series metrics no matter where the data is stored.
Grafana has a very lightweight backend and can seamlessly integrate with your workflow to help explore metrics, visualize data, explore logs, evaluate data points, and notify issues in real time.
Grafana supports over 30+ open-source and commercial data sources and is backed by a vibrant community of developers. It’s used by thousands of companies today to monitor anything and everything.
Dashboards in Grafana
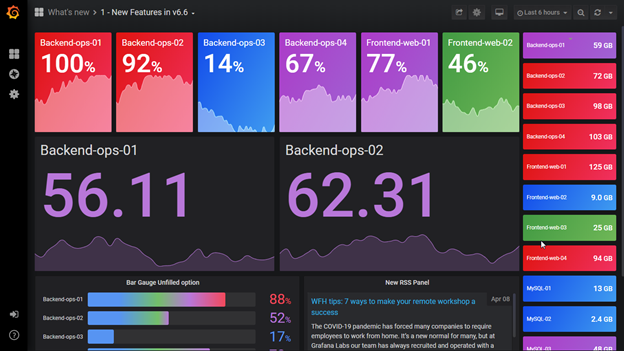
The power of Grafana lies in its feature-rich dashboards that are easy to set up and configure. Every dashboard in Grafana consists of one or more panels that are organized into rows. There are no restrictions on having similar or different types of visualizations. However, each panel must be configured with an input query that results in an accepted output format.
Grafana, out-of-the-box doesn’t come with pre-built dashboards and needs to be custom-created right from the beginning. By default, it offers a wide range of visualizations and provides the option to choose more from its official library.
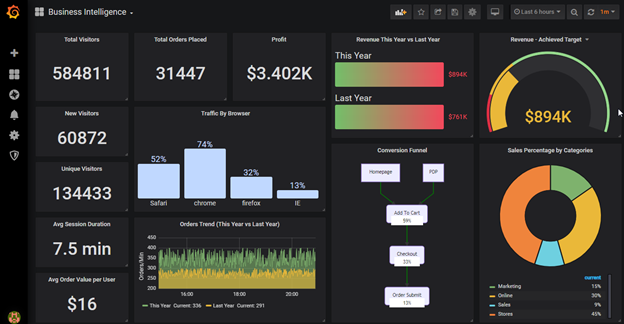
Data in Grafana can be displayed using panels like Line Graph, Single Stat, Polystat, Table, Gauge, Pie Chart, etc. They also contain many advanced panels like Worldmap, Heatmap, Progress List, Picture Graphs, and many more.
Each of the panels has its own config settings and allows making changes like metric selection, display modifications, grid settings, scaling, etc. Some panels also offer time-shifting data. This is essential in correlating metric values or comparing week-over-week trends. Grafana provides a lot of flexibility in terms of minute visual details letting you represent your data, the way you want.
Not only this, but the Official Library also contains plugins for integrating Grafana with different data sources like ElasticSearch, InfluxDB, Amazon Cloudwatch, Prometheus, etc., and also various applications like Zabbix, Cloudflare, Kubernetes, etc. The offerings are even more for premium Grafana Enterprise users.
Creating Template variables in dashboards is an important feature of Grafana that lets you configure variables and modify graphs on the runtime depending on the selected variables. The just-launched version of Grafana 7.0 has a lot to offer in this context.
Some Grafana panels allow you to attach thresholds to your dashboard panels. These panels continuously evaluate data for degradation and color change in the graphs according to their predefined thresholds. Some panels also have a notification system that can send out alert events over multiple channels like email, Slack, PagerDuty, VictorOps, etc. Users can easily add annotations to any service outages or planned maintenance.
Grafana overall maintains a huge collection of plugins for anything and everything making it one of the most widely used visualization tools in the world. All thanks to their active developers and their large community of contributors.
Like Dashboards? Read more on our article Our Favorite Grafana Dashboards.
Like Grafana? Set up Grafana as a Service in minutes. Try our 14-day free trial.
What is Chronograf?
Chronograf is the user interface for InfluxDb’s 1.x platform. Recently with the launch of InfluxDb 2.0, Chronograf was merged into the time series platform and is now a part of the single binary and known as visualization.
Chronograf is one of the components of InfluxDb’s TICK Stack that comprises InfluxDB (the time-series database), Telegraf (the data collector), Chronograf (the web interface), and Kapacitor (the data processing and alerting engine). Chronograf lets you see the data stored in your InfluxDB and quickly build real-time dashboards using simple templates and libraries.
Dashboards in Chronograph
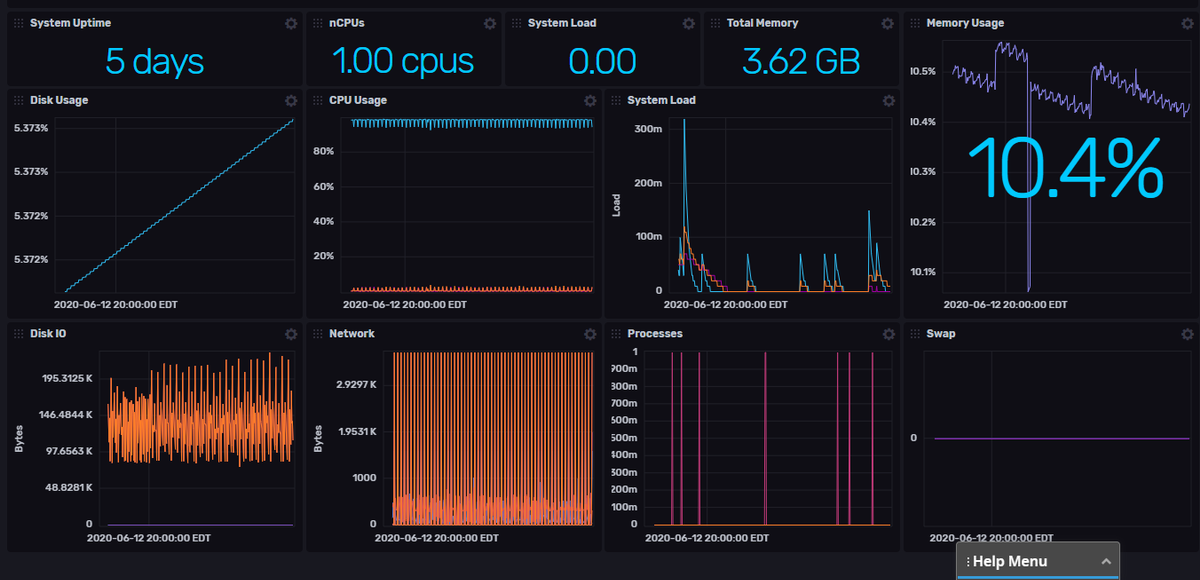
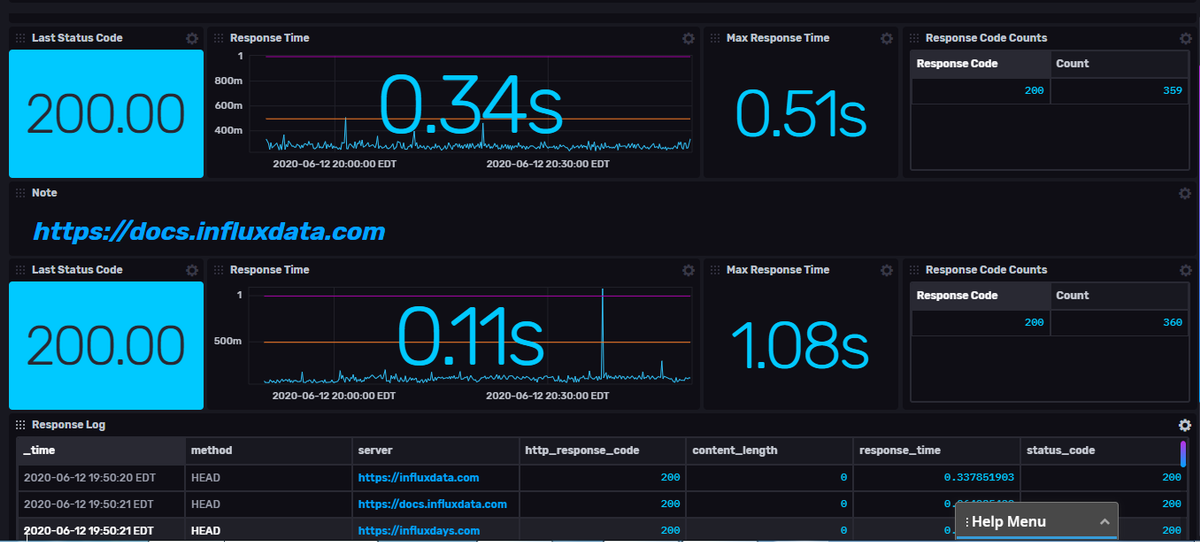
Dashboards in Chronograf are simple and easy to create. Depending on the telegraf input plugins enabled, Chronograf automatically creates pre-built dashboards for its users. These dashboards, however, cannot be cloned or edited. Users can select from a list of apps that come with these pre-created dashboards. Users can also create custom dashboards by building queries in the Data Explorer.
Unlike Grafana, Chronograf was primarily built to integrate with only the InfluxDB time-series database. It was designed to simplify the use of the entire InfluxDB TICK platform. Chronograf supports many visualization types like Line Graphs, Single Stat, Bar Graphs, Gauges, Tables, and others. Editors and administrators can choose to mark or add important events, system outages, comments, etc. using annotations in the Chronograf interface.
Like Grafana, Chronograph also allows creation template variables to allow dynamically changing dashboards. This is an important feature of dashboarding and is utilized by most developers to generate dashboards that can be reused for hundreds of metrics and can filter or select data based on variables. Users can select the values of these variables at runtime and results are auto-generated as per their selection.
Chronograf integrates with Kapacitor providing a user interface for its alerting engine. Kapacitor in turn continuously evaluates data points in real-time and upon data degradation and pushes a message to the handler. Messages could be pushed to log files, email services, or any third-party services like Slack, VictorOps, PagerDuty, and many more.
Differences Between Grafana and Chronograf in Terms of Dashboards:
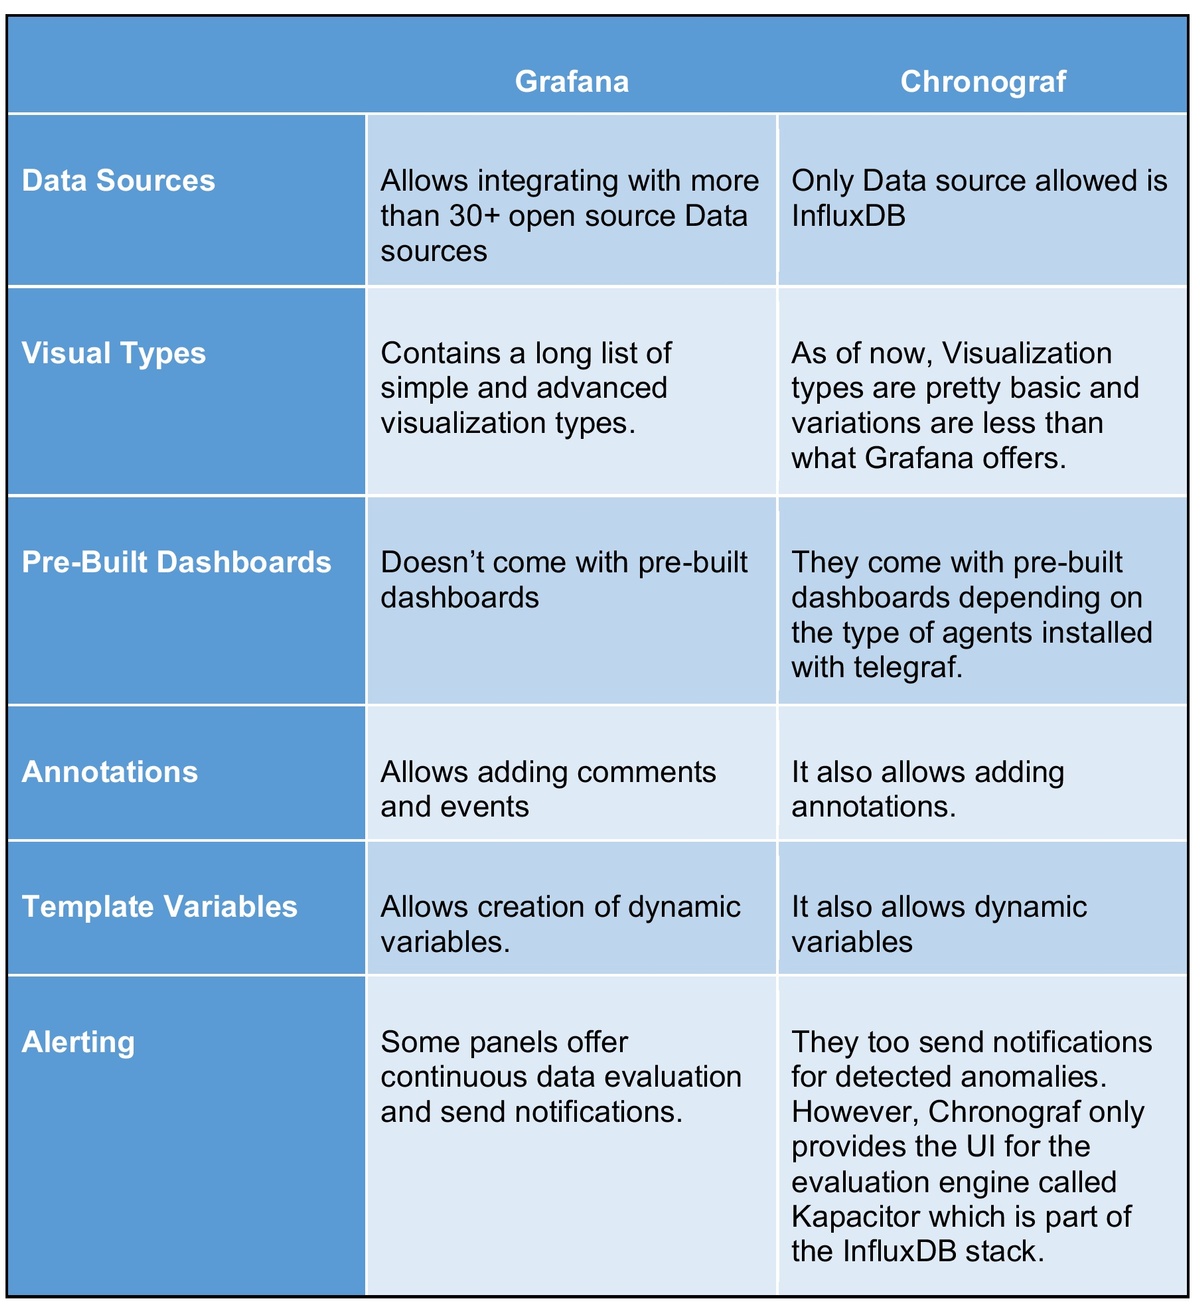
Conclusion
Grafana and Chronograf are similar solutions developed to display data and provide analytical insights. However, Chronograf majorly lags by offering only InfluxDB as a data source. Grafana also provides extra visual types for deeper analytics and has a better interface than current versions of Chronograf.
If you need a single solution for all your backend data sources, we suggest Grafana. But if you just need a simple interface to filter your InfluxDB data, go for InfluxDB. InfluxDB 2.0 is the latest version and simplifies installation by merging separate components into one.
Don’t want to go through nerdy installation procedures and dashboard setups? Sign up for MetricFire's free trial to build Grafana dashboards, book a demo, and talk to our team at MetricFire. You only have to sit back and relax while we do everything for you.


