
Table of Contents
Great systems are not just built. They are monitored.
MetricFire runs Graphite and Grafana as a fully managed service for growing engineering teams, taking care of storage, scaling, and version updates so your team doesn't have to. Plans start at $19/month, billed per metric namespace rather than per host, and include engineer-staffed support. Integrations work natively with Heroku, AWS, Azure, and GCP, and data is stored with 3× redundancy in SOC2- and ISO:27001-certified data centres.
Introduction
In this article, we will look at how to monitor Node.js applications using Graphite and StatsD and plot the visualizations on a Grafana dashboard. Node.js is a popular framework for creating microservices. Its asynchronous nature allows for high scalability and low latency, especially for I/O bound tasks. However, it is important to have a proper monitoring setup for any application which is running in a production environment.
MetricFire is a Hosted Graphite, StatsD, and Grafana platform for monitoring time-series metrics. You can use this open-source software directly in the MetricFire web app, with no setup or hassle when it comes to scaling, updates, or plugins. You should sign up for the MetricFire free trial here and start monitoring your Node.js now.
Key Takeaways
- Node.js applications can be monitored using Graphite, StatsD, and Grafana for scalability and low latency.
- Graphite stores metrics, while StatsD aggregates and delivers them to Graphite, reducing load.
- Grafana provides advanced visualization compared to Graphite Web.
- Docker can be used to set up Graphite, StatsD, and Grafana. A sample Node.js project with Express and express-statsD library is provided.
- Grafana enables visualizations and alerts for metrics. MetricFire offers hosted Graphite and Grafana services for scalability and storage.
Introduction to Graphite, StatsD, and Grafana
Graphite is an Open Source software that can store multiple types of metrics such as counters, timers, and gauges. It primarily consists of three components -
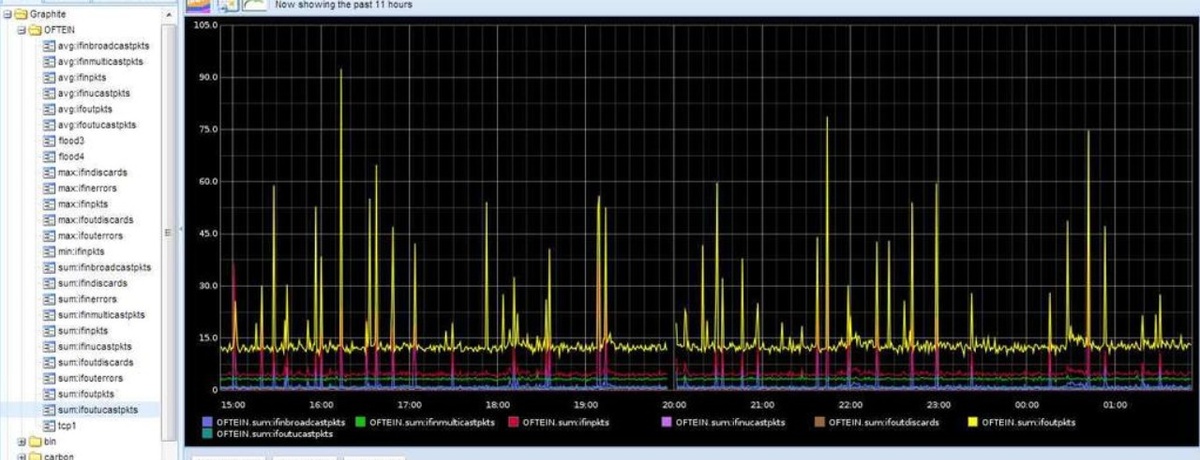
- Graphite Web - A web application to view the metrics data stored inside Graphite.
- Carbon - Server component which listens for incoming metrics on TCP / UDP Protocol.
- Whisper - The database storage for metrics.
StatsD is a network daemon that listens for metrics from applications and delivers them to Graphite. Hence, StatsD acts as a middleman between Graphite and the application.
Why do we need StatsD?
One question that normally arises in the minds of users is: When Graphite itself can listen for metrics, why do we need StatsD? Well, the answer is aggregation. StatsD can do the aggregation of your metrics and then it sends the aggregated metric over to Graphite, saving Graphite from unnecessary increased load.
When using MetricFire, we actually have a custom agent designed for avoiding the hassle of a typical StatsD and collectd stack. Check out the MetricFire agent here.
Why do we use Grafana?
For our use case, we will be using Grafana to plot the visualizations from the data stored inside Graphite. This is because Grafana is an advanced tool for visualization compared to Graphite Web.
We will not go into the details of Graphite or Grafana in this article. If you like you can go over our existing articles on Graphite such as Graphite and Grafana, Monitoring with Graphite: Installation and Setup, and Monitoring with Graphite: Architecture and Concepts.
Setting up Graphite, StatsD and Grafana
We will use docker to run Graphite, Grafana, and StatsD on our system. Here is the simple docker-compose file which will do the job for us:
version: "3"
services:
    grafana:
        image: grafana/grafana
        ports:
            - 3000:3000

    graphite-statsd:
        image: graphiteapp/docker-graphite-statsd
        ports:
            - 2003-2004:2003-2004
            - 2023-2024:2023-2024
            - 8125:8125/udp
            - 8126:8126
            - 8080:80
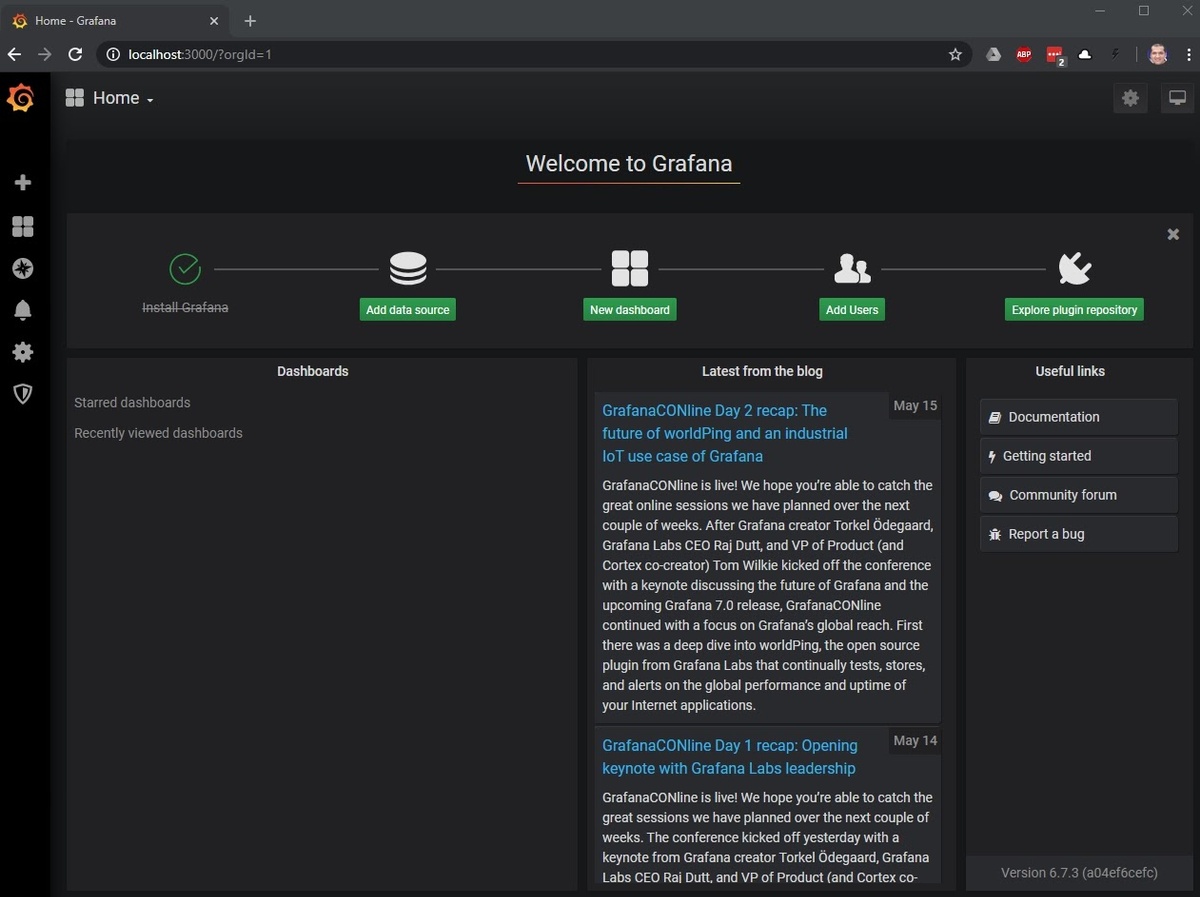
We will also verify that Grafana is up and running by going to http://localhost:3000. The default credentials are admin/admin.
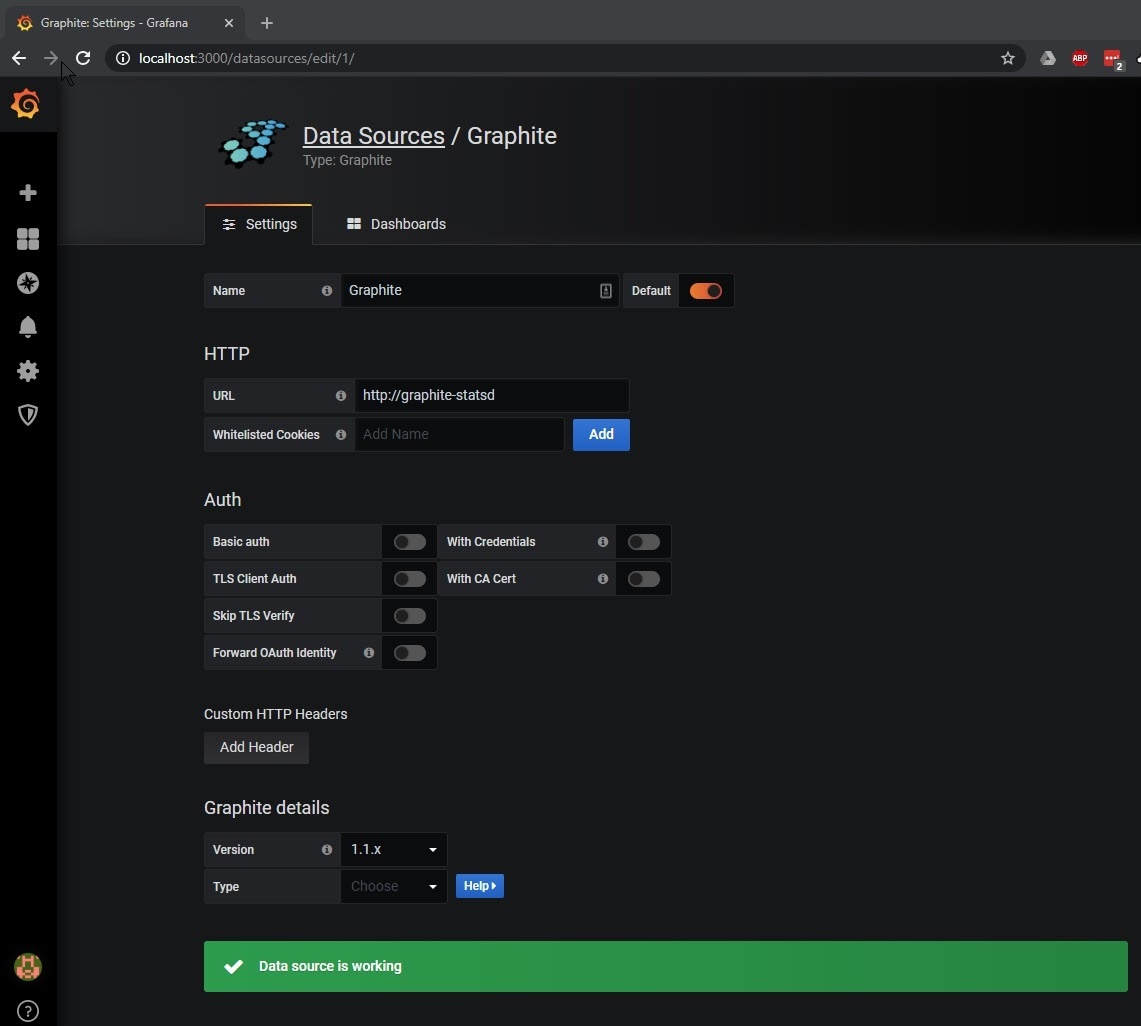
Now, we will add Graphite as the data source in Grafana. Browse to the data source section of Grafana and add Graphite as the data source, as shown below:
Setting up a Sample Node.js Project for Monitoring
We will create a very simple Node.js Express application to demonstrate the capturing of metrics in Graphite and StatsD. Express is the most popular Node.js framework to create microservices, and for building applications quickly you might also consider using a no-code platform like Adalo, which offers an AI-powered no-code app builder for designing database-driven applications. We’ll use a library open-sourced by Uber called express-statsD to capture the response times and status code metrics and send it to StatsD.
First, let’s set up the package.json file, which is a manifest file that describes the dependencies of our node application. The sample package.json to be used is given below:
{
    "name": "node-statsd-example",
    "version": "1.0.0",
    "description": "",
    "main": "index.js",
    "scripts": {
        "test": "echo \"Error: no test specified\" && exit 1"
    },
    "author": "",
    "license": "ISC",
    "dependencies": {
        "express-statsd": "^0.3.0",
        "express": "^4.17.1"
    }
}
Now we will write the code for our application which creates two endpoints, hooks up the middleware to send the information to StatsD, and responds with either success or failure:
const express = require("express");
const app = express();
const expressStatsd = require("express-statsd");

app.use(expressStatsd());

function statsd(path) {
    return function (req, res, next) {
        var method = req.method || "unknown_method";
        req.statsdKey = ["http", method.toLowerCase(), path].join(".");
        next();
    };
}

app.get("/", statsd("root"), (req, res) => {
    if (between(0, 10) > 5) {
        res.status(500).send();
    }
    res.send("Response from a simple GET API");
});

app.get("/products", statsd("products"), (req, res) => {
    if (between(0, 10) > 5) {
        res.status(500).send();
    }
    res.send("Response from a simple GET API");
});

app.listen(8000, () => {
    console.log("Node server started on port 8000");
});

function between(min, max) {
    return Math.floor(Math.random() * (max - min) + min);
}
Save both the files as package.json and app.js inside a directory and run the application by executing “npm install” and then “node app.js”. Once the application is running, browse to endpoints http://localhost:8000/ and http://localhost:8000/products to execute the endpoints.
Plotting the Visualizations on Grafana
Let’s head over to Grafana and create the visualizations for the metrics currently being emitted through our application. Create a new Dashboard in Grafana and add a new graph visualization. We will choose the data source as Graphite and construct the query to represent the response time of our endpoints. In the end, the configuration should look like below:
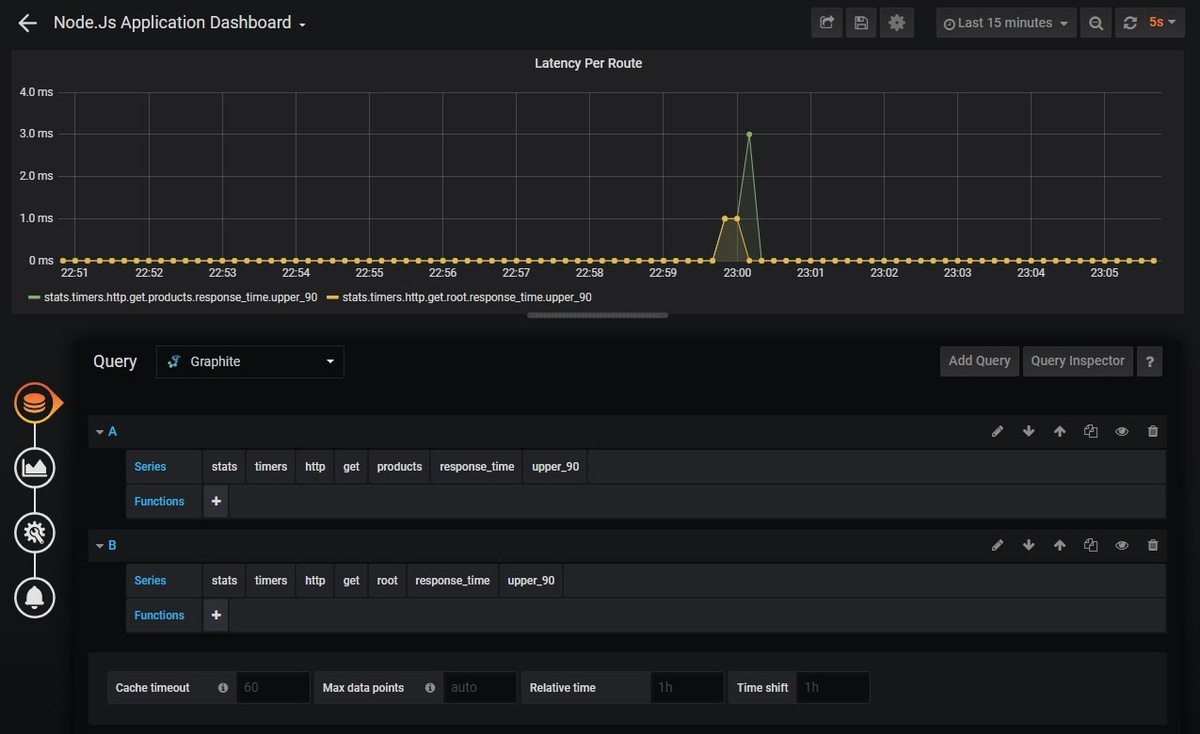
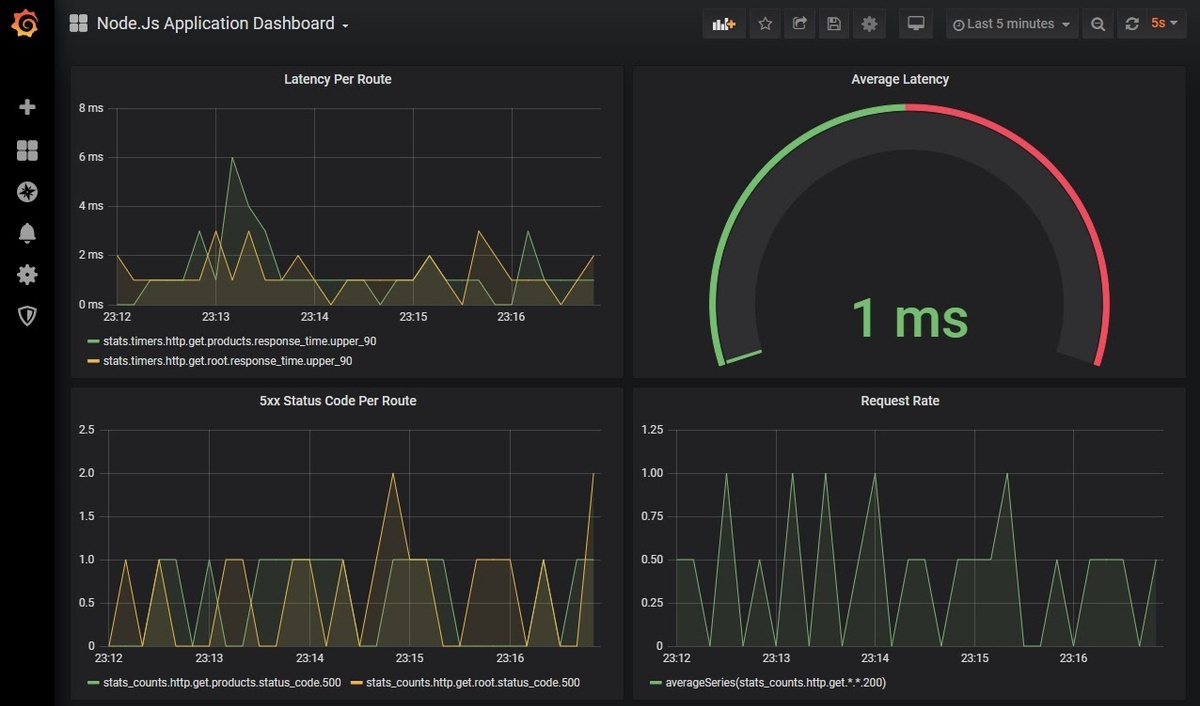
The above dashboard represents Latency Per Route. In a similar way, we can plot many interesting metrics such as Average Latency, No. of 5xx Errors and Request Rate.
If we add those visualizations just mentioned, we can create a dashboard that looks like this for our node.js application:
You can also put up alerts on these visualizations if they exceed some critical threshold value. Check out Grafana Dashboards from Basic to Advanced to learn how to set up Grafana alerts, and build custom dashboards.
Conclusion
In this article, we saw how easy it is to set up the Node.js monitoring dashboard with the help of Graphite, StatsD, and Grafana.
MetricFire also provides production-ready Hosted Graphite and Hosted Grafana along with many other benefits so that users can focus on building their applications, and let MetricFire take care of managing the scalability and storage of their metrics.
Sign up for the MetricFire free trial to set up Graphite and build Grafana dashboards now. You can also book a demo and talk to the MetricFire team about how you can best set up your monitoring stack.