
Table of Contents
Great systems are not just built. They are monitored.
MetricFire runs Graphite and Grafana as a fully managed service for growing engineering teams, taking care of storage, scaling, and version updates so your team doesn't have to. Plans start at $19/month, billed per metric namespace rather than per host, and include engineer-staffed support. Integrations work natively with Heroku, AWS, Azure, and GCP, and data is stored with 3× redundancy in SOC2- and ISO:27001-certified data centres.
Introduction
Since server outages can lead to a loss of customers, reputation, and other troubles and it is important to get information on the status of the server on time. MetricFire's Hosted Grafana and Graphite will help you monitor server load in a timely and efficient manner.
Servers generate a large number of metrics and it is essential to not only track their values but also to observe their changes over time. There is also a possibility to correlate app statistics with server load metrics. For example, if your server load metrics are showing issues, you will be able to correlate it with page load speed or another KPI of your app.
Graphite copes well with these tasks, and Grafana makes visualization beautiful and understandable. These two programs complement each other well and make server monitoring simple and efficient.
MetricFire specializes in monitoring systems and uses both Graphite and Grafana. This is very convenient for solving the tasks described above.
You can use our product with minimal configuration to gain in-depth insight into your environment. If you would like to learn more about it please book a demo with us, or sign up for the free trial today.
Key Takeaways
- Server outages can lead to loss of customers and reputation, making it crucial to monitor server load in a timely manner.
- Graphite and Grafana complement each other well in the metrics collection and visualization process.
- Collectd is a useful metric collector that sends data to Graphite for analysis and visualization.
- Grafana allows users to create customized interactive dashboards for monitoring various server metrics such as CPU usage, system load, memory usage, disk I/O, and used disk space.
- Graphite focuses on data collection, storage, serialization, and transmission, while Grafana excels in data visualization and analysis.
General overview
The metrics collection system may have different compositions. It may include a different number of components, each of which somehow interacts with the others, has its configuration file, and is a unique way to start. Even Graphite, in itself, consists of at least three subsystems - a metric collection Daemon (carbon), a database with metrics (Whisper, etc.), and a web application for visualization.
At the same time, the standard Graphite web application can be replaced with the more advanced Grafana. In general, the metrics collection system can be described with the following diagram:
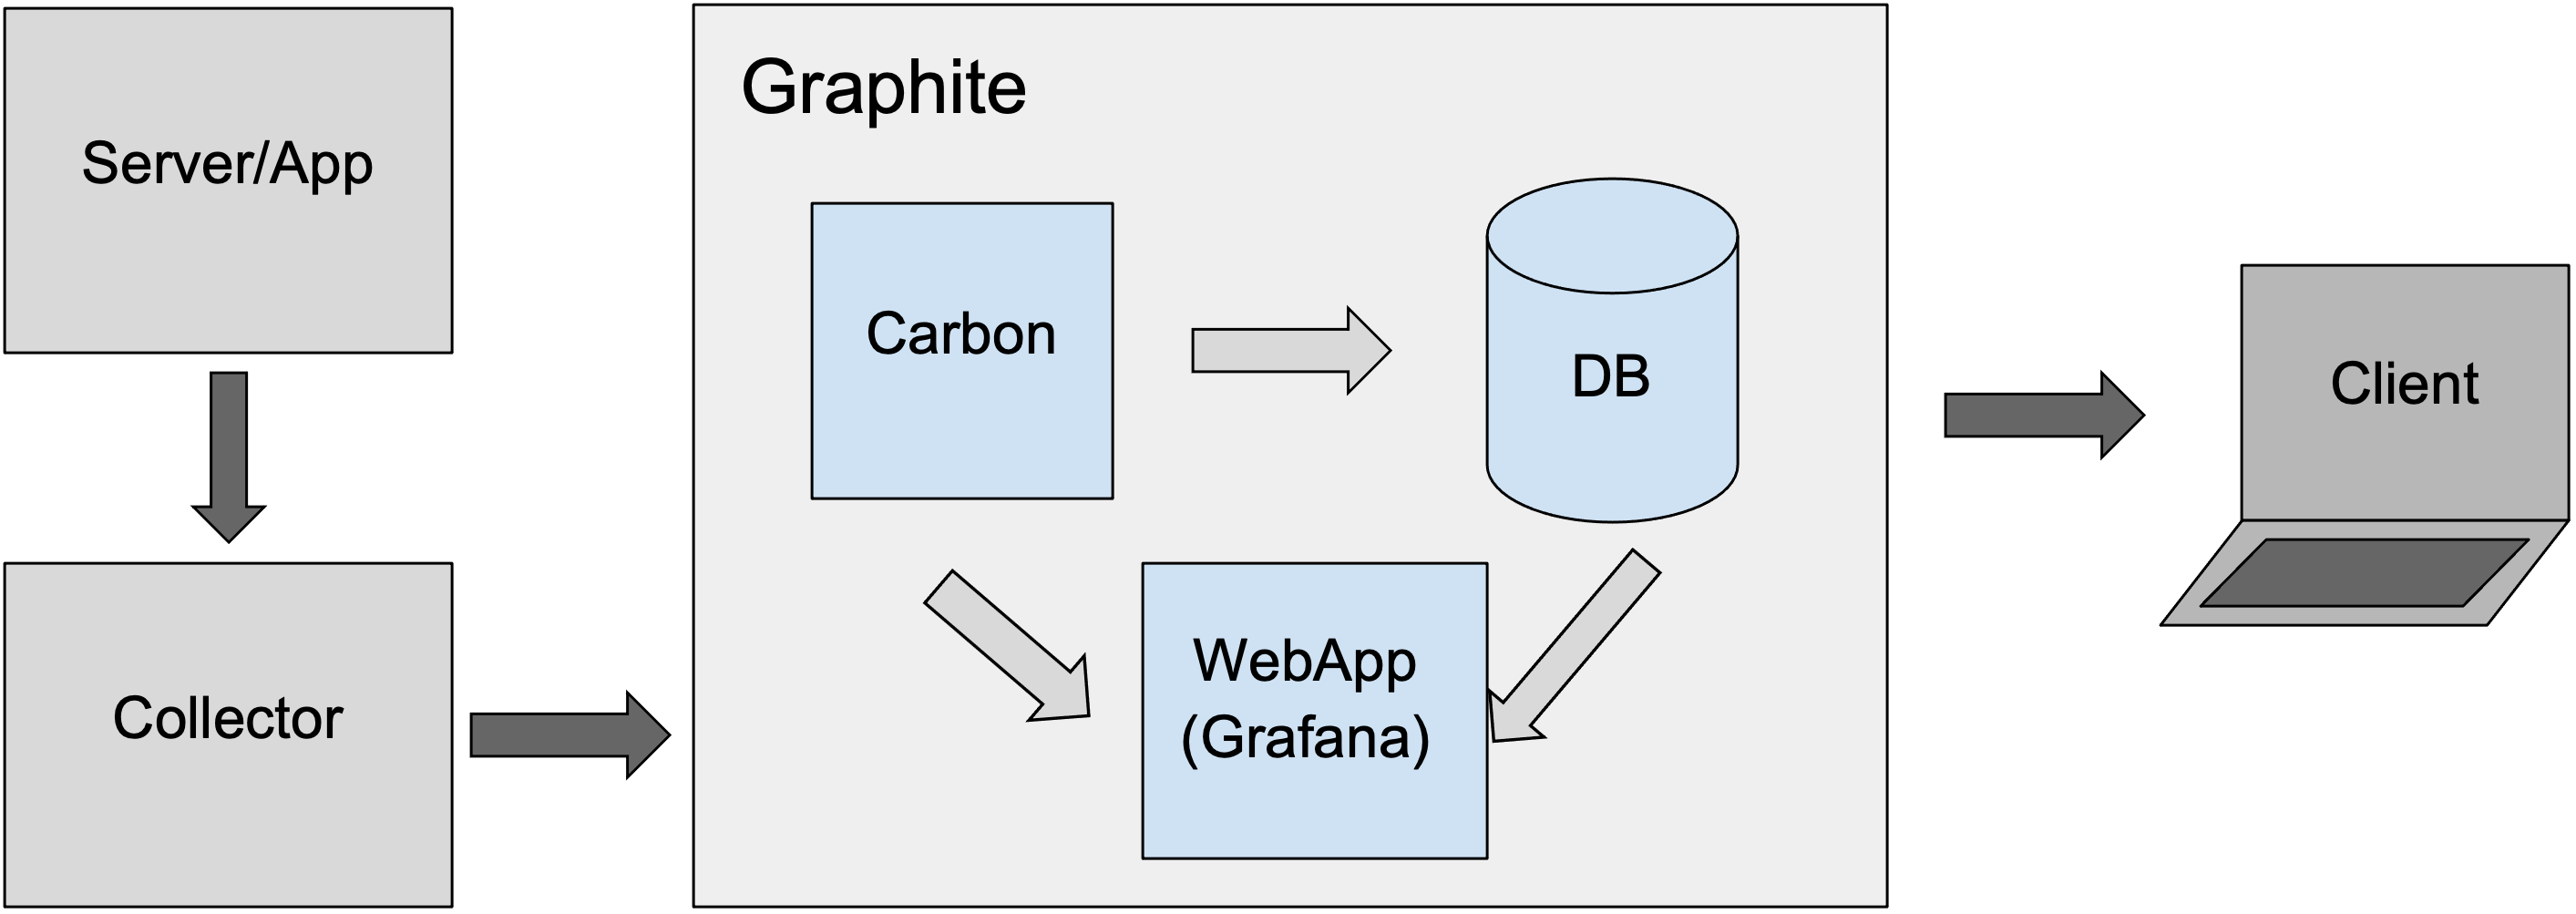
The server generates metrics and sends them to the collector. The collector partially aggregates them and sends them to Carbon with a given frequency. Carbon gradually puts them in storage (DB). The web application pulls data from storage and builds graphs.
In this article, we will monitor server load with Ubuntu 18.04 LTS operating system. For this reason, we will use Collectd as the metric collector. It’s a small application that was designed to collect metrics. Collectd must be installed on each PC, whose indicators you need to monitor. It tracks and sends metrics to Graphite via its plugins.
There are many plugins for a wide variety of purposes. The most common plugins can be the following: monitor CPU, memory, network, and swap usage. Also, there are plugins to monitor different software, plugins that can aggregate and push metrics to a database, and many others.
Collectd sends metrics to Graphite via the “Write Graphite” plugin on port number 2003. If you need more information about Collectd installation and its plugins, please read our blog post-Collectd plugins. Note that with the help of Graphite and Grafana, you can also monitor cloud servers that provide all of the providers: AWS, GCP, Azure, Digital Ocean, etc.
What are Graphite and Grafana?
So let’s summarize what Graphite and Grafana are. Graphite is a monitoring tool that efficiently stores time-related data (through the Whisper database), provides an interface for basic visualization of the stored data, and gives mathematical functions to sum/group/scale stored data in real time.
Grafana is a powerful visualization tool that allows you to connect to Graphite and build customized interactive dashboards, set alerts for specific events, and much more.
How to monitor server load with the Grafana dashboard
Now let's figure out how to build a Grafana dashboard to monitor server load. First of all, we need to set up a data source because Grafana concentrates on the visualization part of the metric analysis.
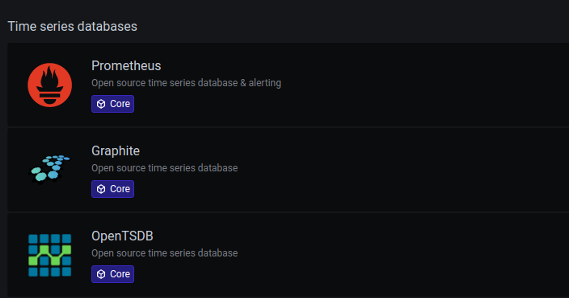
Go to “Configuration” and choose “Data Sources”. Then click “Add data source”. By default, Grafana supports Graphite, Open TSDB, and several other aggregators. If the standard plugins are not enough you can download the one you need.
Choose “Graphite” and configure data source settings:
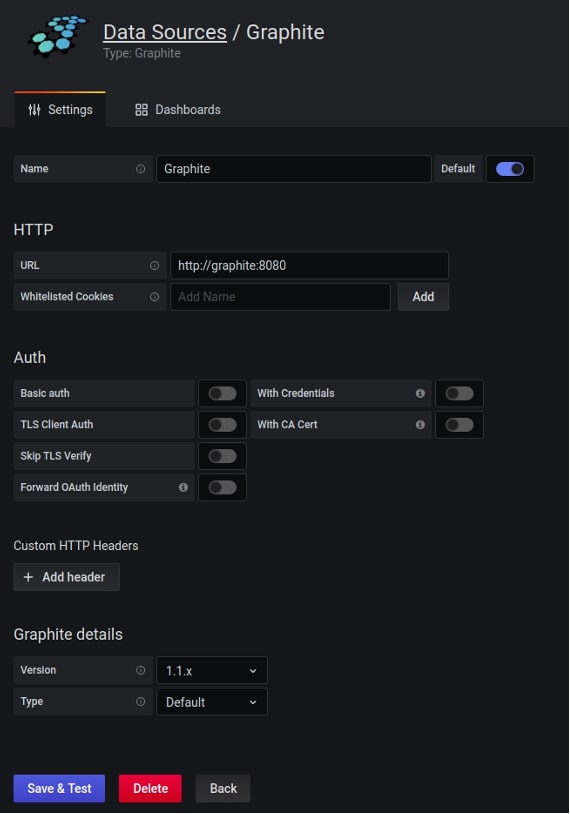
You need to specify the Name and URL. By default, Graphite uses an 8080 port. You can also specify that this data source will be used by default. Click “Save & Test” and Grafana will check the connection and save the data source. Once Grafana begins to receive data from the source, we can begin to create a dashboard.
A dashboard is a set of panels. The Grafana out-of-the-box has a large set of different panels for visualizing metrics. There are graphs, tables, diagrams, notification lists, heat maps, and a lot of others.
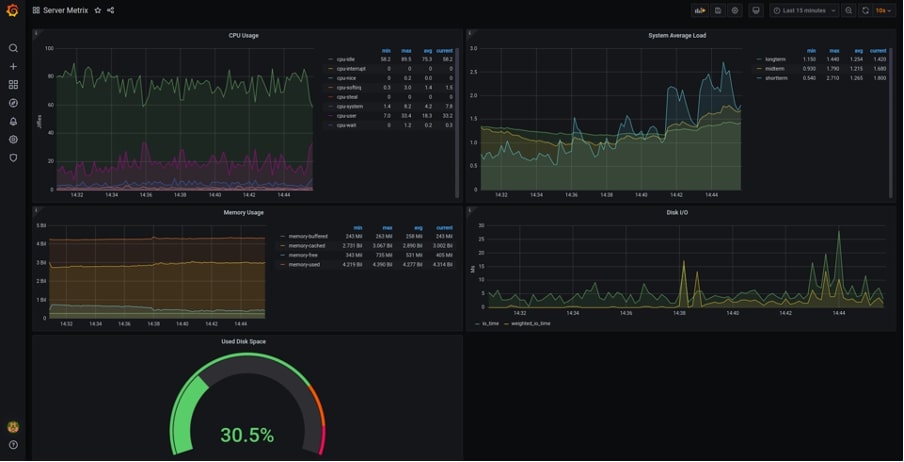
In this article, we will build a dashboard for monitoring server load with the following metrics:
- CPU usage
- System average load
- Memory usage
- Disk I/O
- Used disk space
CPU usage
To add a new dashboard, you need to click "Create" and select "Dashboard". You will see the dashboard edit panel. Click on the dashboard settings in the upper right corner.
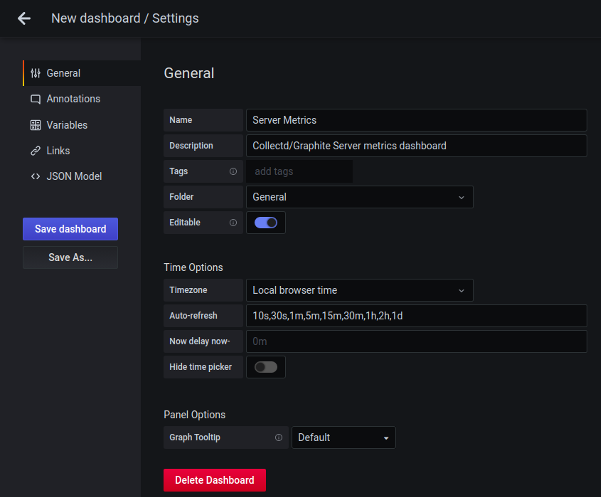
Set the name of the dashboard, and its description, and select the time zone. Save the changes and click "Add panel" in the same upper left corner.
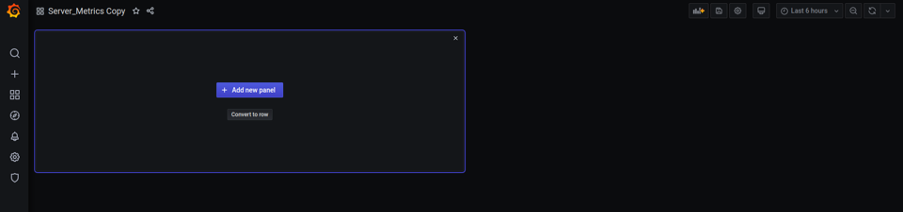
Click "Add new panel" and go to the panel editor.
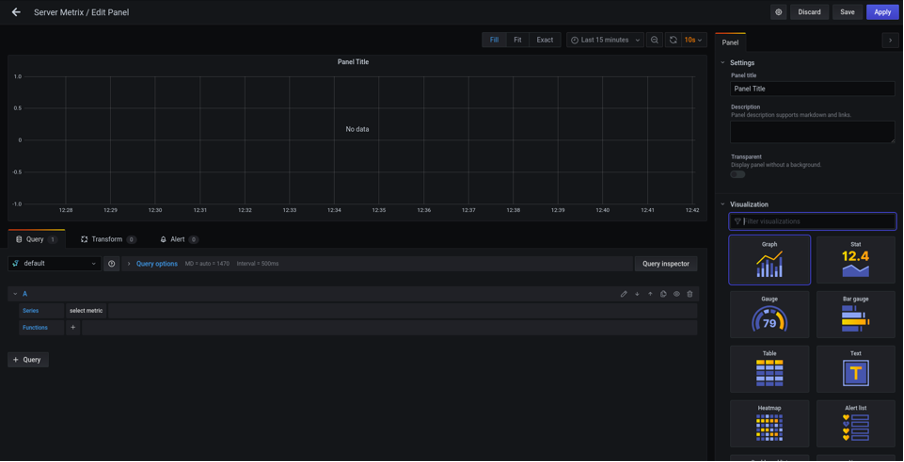
The first panel will be a panel for monitoring CPU usage. This panel shows the amount of time spent by the CPU in various states, such as executing user code, executing system code, waiting for IO operations, and being idle.
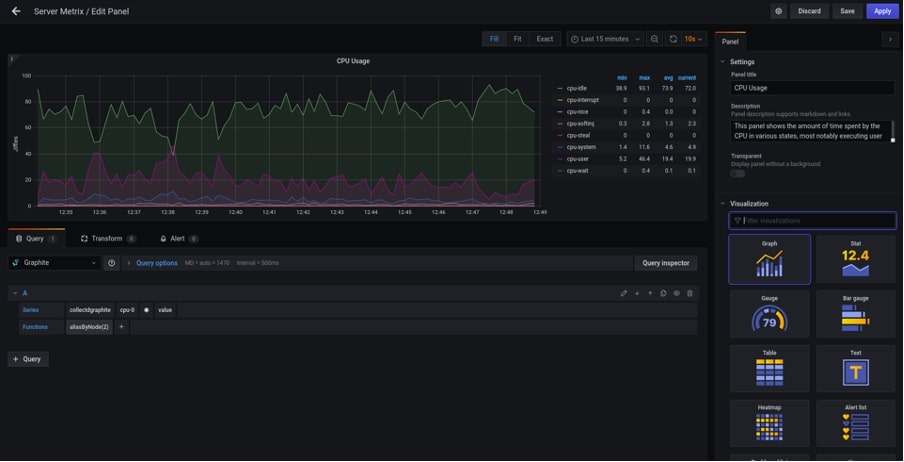
First of all set a panel title, and description, and select the data source “Graphite”. The visualization type will be “Graph”. Then in the “A” query in the “Series” section select a metric with the “Collectd” prefix (the name of the metric depends on the collector that you use). Then select “cpu”, “*” (to see all the CPU metrics provided by Collectd on one graph), and “value”.
You can use this guide for your Graphite graph menu reference.
In the “Functions” section select “Alias” -> “aliasByNode(2)”. This will make the titles of metrics in the legend shorter and more readable. In the “Panel” section go to the “Legend” and mark options - show, as a table, on the right and variables - min, max, avg, current.
As a result, we get the following panel:
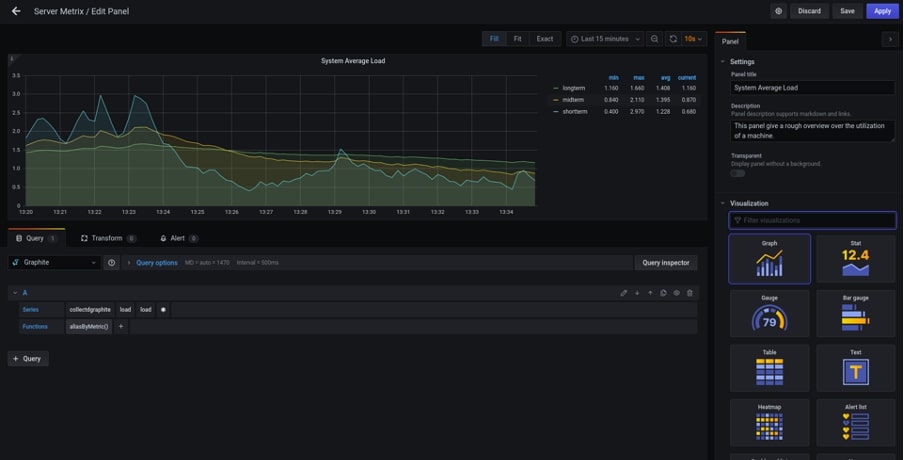
System average load
The next panel will be the system average load. This panel shows the system load. These numbers give a rough overview of the utilization of a machine. The system load is defined as many runnable tasks in the run-queue and is provided by many operating systems as a one (short term), five (middle term), or fifteen-minute (long term) average.
The procedure is almost the same as when creating the previous panel:
- add new panel
- set a panel title and description
- select data source “Graphite”
- select metric with “collectd” prefix -> load -> load -> *
- Functions -> “Alias” -> “aliasByMetric()”
- “Panel” section -> “Legend” -> mark options - show, as a table, on the right and variables - min, max, avg, current
Finally, we get the following panel:
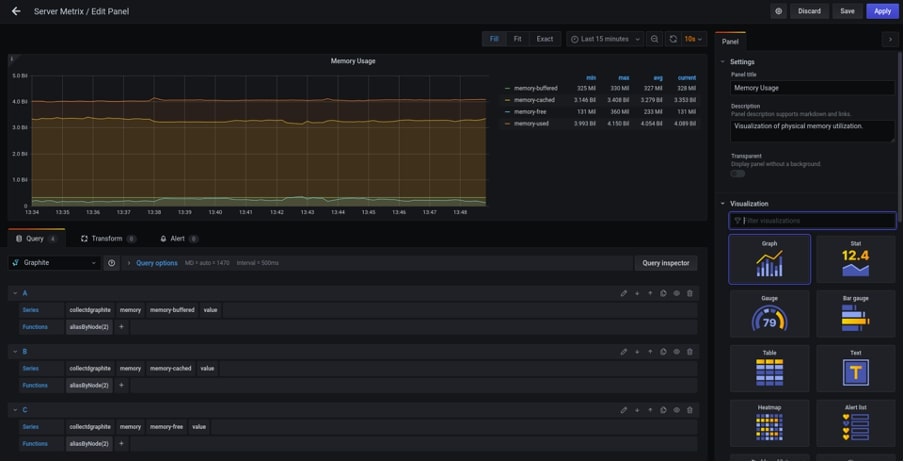
Memory usage
The memory plugin of Collectd collects physical memory utilization. The values are reported by their use by the operating system. Under Linux, the categories are:
- used
- buffered
- cached
- free
Free memory is the memory you paid for, that's using power and that doesn't do anything useful. Normally, the operating system puts that memory to use, for example by caching files it has accessed.
To make the memory usage monitoring panel:
- add new panel
- set a panel title and description
- select data source “Graphite”
- query A -> select metric with “collectd” prefix -> memory -> memory-buffered -> value; Functions -> “Alias” -> “aliasByNode(2)”
- query B -> select metric with “collectd” prefix -> memory -> memory-cached -> value; Functions -> “Alias” -> “aliasByNode(2)”
- query C -> select metric with “collectd” prefix -> memory -> memory-free -> value; Functions -> “Alias” -> “aliasByNode(2)”
- query D -> select metric with “collectd” prefix -> memory -> memory-used -> value; Functions -> “Alias” -> “aliasByNode(2)”
- “Panel” section -> “Legend” -> mark options - show, as a table, on the right and variables - min, max, avg, current
The panel will look like this:
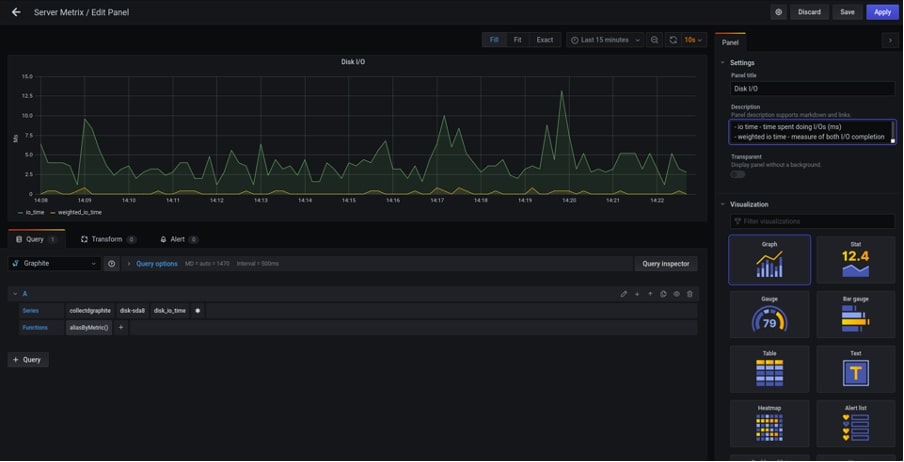
Disk I/O
Disk I/O encompasses the input/output operations on a physical disk. In the process of reading data from a file on a disk, the processor needs to wait for the file to be read (the same goes for writing). The time needed for reading and writing information from the disk is a very important index of server efficiency.
In our dashboard, we use two metrics that characterize disk I/O:
- io time - time spent doing I/Os (ms). This indicator can be considered as the percentage of device load (value of 1 second time spent matches 100% of load)
- weighted io time - the measure of both I/O completion time and the backlog that may be accumulating
To make dick i/o monitoring panel we must next:
- add new panel
- set a panel title and description
- select data source “Graphite”
- select metric with “collectd” prefix -> disk-your disk -> disk-io-time -> *
- Functions -> “Alias” -> “aliasByMetric()”
And here is the result:
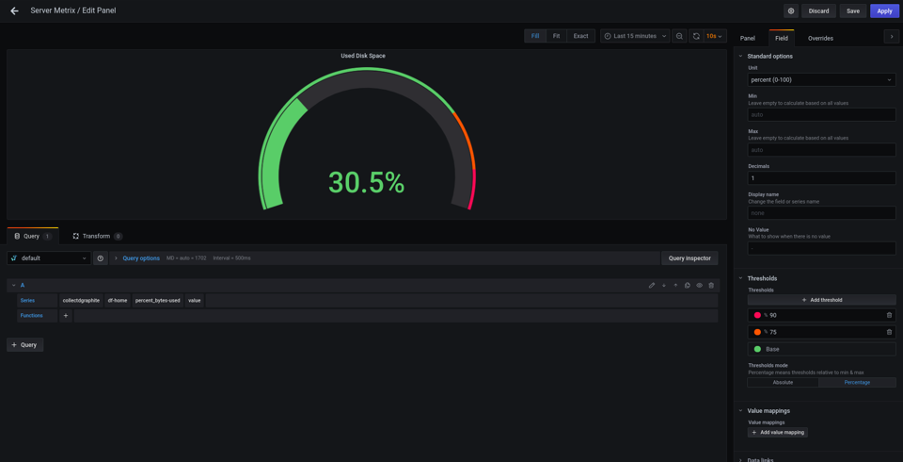
Used disk space
During the operation of the server, it is very important to understand how much free space is left on the disk.
This panel will be another visualization type, that Grafana provides - Gauge.
Do the next steps:
- add new panel
- set a panel title and description
- select data source “Graphite”
- select metric with “collectd” prefix -> df-your mounted partition -> percent_bytes-used -> value
- select visualization type “Gauge”
- Field section: Unit -> percent (1-100); Thresholds -> 90% -> red, 75% -> orange, base -> green
With these panel settings, the scale will change color according to this rule: up to 70% - green, 70-89% - orange, and 90% and more - red.
The panel will look like this:
As you can see, making dashboards with Grafana is very easy. For more efficient server load monitoring you can use other Grafana features:
Notifications: A Grafana can send a letter, chat message, or HTTP request when metrics go beyond a certain border. For example, as soon as less than 10% of free disk space is left, Grafana will send you a letter describing the problem.
Variables: If you need to monitor the server load of several servers, you can create a “server” variable and determine the number of servers to track. Then you can switch between servers by selecting the one you need from the drop-down list. The dashboard will display the data of the server you selected.
Playlists: You can make a playlist of several dashboards, display them on a separate screen, and put them in a circle.
Plugins: If you don’t find something in Grafana, then most likely it has already been done as a plugin. There are data source plugins, dashboard plugins, panels - a lot of things.
Conclusion
Graphite and Grafana are great to monitor server load parameters. While the strength of Grafana is visualization - the construction of various graphs, charts, tables, heatmaps, and much more, Graphite provides the collection, serialization, storage, and transmission of data for visualization.
In this article, you have seen how easy it is to create beautiful and informative dashboards using Grafana. But Grafana can build not just graphs. It can also notify you about the occurrence of a certain event, carry out various calculations with the metrics of your server, as well as work with the metrics of several servers, and easily switch between them.
Additionally, if you are interested in monitoring server load with Graphite and Grafana, MetricFire has a great solution for you. You can use our product with minimal configuration to gain in-depth insight into your environment.
If you would like to learn more about it please book a demo or sign up for a free trial and talk to one of our experts to know the best monitoring solutions for you!


